Basic Stats
| Institutional Owners | 102 total, 102 long only, 0 short only, 0 long/short - change of 8.42% MRQ |
| Average Portfolio Allocation | 0.3138 % - change of -0.85% MRQ |
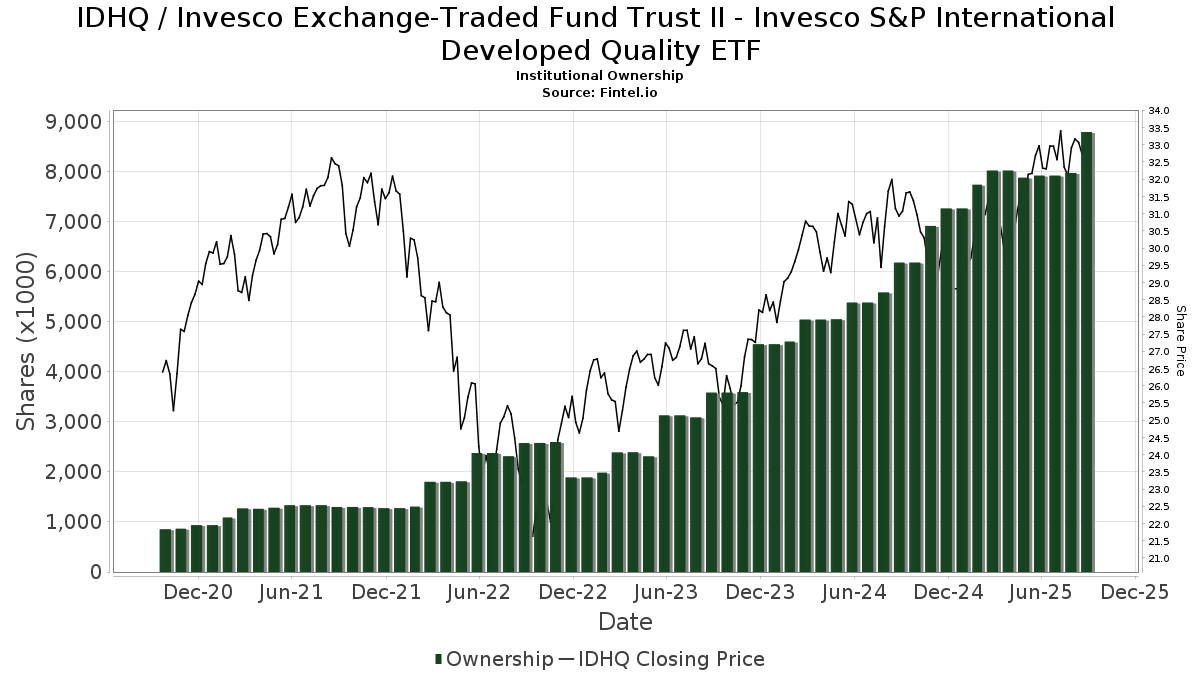
| Institutional Shares (Long) | 8,787,939 (ex 13D/G) - change of 0.87MM shares 11.04% MRQ |
| Institutional Value (Long) | $ 283,668 USD ($1000) |
Institutional Ownership and Shareholders
Invesco Exchange-Traded Fund Trust II - Invesco S&P International Developed Quality ETF (US:IDHQ) has 102 institutional owners and shareholders that have filed 13D/G or 13F forms with the Securities Exchange Commission (SEC). These institutions hold a total of 8,787,939 shares. Largest shareholders include LPL Financial LLC, Northwestern Mutual Wealth Management Co, Cedar Wealth Management, LLC, Morgan Stanley, Berkeley, Inc, Heck Capital Advisors, LLC, WCG Wealth Advisors LLC, KWB Wealth, Chaney Capital Management, Inc., and Raymond James Financial Inc .
Invesco Exchange-Traded Fund Trust II - Invesco S&P International Developed Quality ETF (ARCA:IDHQ) institutional ownership structure shows current positions in the company by institutions and funds, as well as latest changes in position size. Major shareholders can include individual investors, mutual funds, hedge funds, or institutions. The Schedule 13D indicates that the investor holds (or held) more than 5% of the company and intends (or intended) to actively pursue a change in business strategy. Schedule 13G indicates a passive investment of over 5%.
The share price as of September 10, 2025 is 33.20 / share. Previously, on September 11, 2024, the share price was 30.93 / share. This represents an increase of 7.34% over that period.
Fund Sentiment Score
The Fund Sentiment Score (fka Ownership Accumulation Score) finds the stocks that are being most bought by funds. It is the result of a sophisticated, multi-factor quantitative model that identifies companies with the highest levels of institutional accumulation. The scoring model uses a combination of the total increase in disclosed owners, the changes in portfolio allocations in those owners and other metrics. The number ranges from 0 to 100, with higher numbers indicating a higher level of accumulation to its peers, and 50 being the average.
Update Frequency: Daily
See Ownership Explorer, which provides a list of highest-ranking companies.
Institutional Put/Call Ratio
In addition to reporting standard equity and debt issues, institutions with more than 100MM assets under management must also disclose their put and call option holdings. Since put options generally indicate negative sentiment, and call options indicate positive sentiment, we can get a sense of the overall institutional sentiment by plotting the ratio of puts to calls. The chart to the right plots the historical put/call ratio for this instrument.
Using Put/Call Ratio as an indicator of investor sentiment overcomes one of the key deficiencies of using total institutional ownership, which is that a significant amount of assets under management are invested passively to track indices. Passively-managed funds do not typically buy options, so the put/call ratio indicator more closely tracks the sentiment of actively-managed funds.
13F and NPORT Filings
Detail on 13F filings are free. Detail on NP filings require a premium membership. Green rows indicate new positions. Red rows indicate closed positions. Click the link icon to see the full transaction history.
Upgrade
to unlock premium data and export to Excel ![]() .
.
| File Date | Source | Investor | Type | Avg Price (Est) |
Shares | Δ Shares (%) |
Reported Value ($1000) |
Δ Value (%) |
Port Alloc (%) |
|
|---|---|---|---|---|---|---|---|---|---|---|
| 2025-09-04 | 13F/A | Advisor Group Holdings, Inc. | 201,127 | -8.68 | 6,634 | 0.61 | ||||
| 2025-08-07 | 13F | Legacy Financial Advisors, Inc. | 43,249 | 6.07 | 1,426 | 16.89 | ||||
| 2025-07-18 | 13F | Truist Financial Corp | 64,960 | 23.59 | 2,142 | 36.17 | ||||
| 2025-05-15 | 13F/A | Orion Portfolio Solutions, LLC | 9,441 | 283 | ||||||
| 2025-08-12 | 13F | Financial Advocates Investment Management | 17,890 | 0.77 | 590 | 11.11 | ||||
| 2025-08-12 | 13F | Jpmorgan Chase & Co | 63,728 | 149.42 | 2,102 | 175.00 | ||||
| 2025-08-12 | 13F | NorthStar Asset Management LLC /NJ/ | 24,714 | 3.44 | 815 | 13.99 | ||||
| 2025-07-25 | 13F | NorthRock Partners, LLC | 33 | 0.00 | 1 | |||||
| 2025-07-24 | 13F | McKinley Carter Wealth Services, Inc. | 13,077 | -13.74 | 431 | -4.86 | ||||
| 2025-08-12 | 13F | Steward Partners Investment Advisory, Llc | 17,879 | 8.94 | 590 | 19.96 | ||||
| 2025-05-06 | 13F | WT Wealth Management | 0 | -100.00 | 0 | |||||
| 2025-07-09 | 13F | Bulwark Capital Corp | 6,978 | 230 | ||||||
| 2025-07-28 | 13F | Sterling Financial Planning, Inc. | 7,926 | 1.72 | 261 | 12.02 | ||||
| 2025-07-16 | 13F | Falcon Wealth Planning | 126,419 | 60.02 | 4,169 | 76.28 | ||||
| 2025-08-11 | 13F | Berkeley, Inc | 457,029 | 58.19 | 15,073 | 74.26 | ||||
| 2025-08-01 | 13F | Delta Investment Management, LLC | 6,391 | -32.72 | 211 | -26.06 | ||||
| 2025-08-12 | 13F | Global Retirement Partners, LLC | 2,338 | 420.71 | 77 | 541.67 | ||||
| 2025-07-22 | 13F | Merit Financial Group, LLC | 103,259 | -2.23 | 3,405 | 7.72 | ||||
| 2025-08-14 | 13F | Mml Investors Services, Llc | 13,099 | 4.67 | 0 | |||||
| 2025-08-04 | 13F | Flagship Harbor Advisors, Llc | 6,246 | -30.43 | 206 | -23.51 | ||||
| 2025-07-28 | 13F | Harbour Investments, Inc. | 495 | 0.00 | 16 | 14.29 | ||||
| 2025-08-14 | 13F | Sunbelt Securities, Inc. | 37 | 0.00 | 1 | 0.00 | ||||
| 2025-07-09 | 13F | Dynamic Advisor Solutions LLC | 6,697 | 221 | ||||||
| 2025-08-14 | 13F | Raymond James Financial Inc | 271,459 | 12.52 | 8,953 | 23.95 | ||||
| 2025-08-06 | 13F | Commonwealth Equity Services, Llc | 62,149 | 7.72 | 2 | 100.00 | ||||
| 2025-08-14 | 13F | Royal Bank Of Canada | 6,054 | -7.74 | 200 | 2.04 | ||||
| 2025-07-16 | 13F | Octavia Wealth Advisors, LLC | 27,123 | -0.26 | 895 | 9.83 | ||||
| 2025-04-21 | 13F | Dunhill Financial, LLC | 0 | -100.00 | 0 | |||||
| 2025-07-30 | 13F | Cullen/frost Bankers, Inc. | 5,313 | -1.72 | 175 | 8.70 | ||||
| 2025-08-07 | 13F | Kestra Private Wealth Services, Llc | 8,545 | 282 | ||||||
| 2025-08-06 | 13F | Centerpoint Advisory Group | 6,709 | -0.61 | 221 | 9.41 | ||||
| 2025-07-10 | 13F | Sovran Advisors, LLC | 7,231 | 237 | ||||||
| 2025-08-11 | 13F | Principal Securities, Inc. | 102,408 | 3,313.60 | 3,377 | 3,920.24 | ||||
| 2025-08-18 | 13F/A | National Bank Of Canada /fi/ | 1,519 | 0.00 | 50 | 8.89 | ||||
| 2025-08-12 | 13F | Cornerstone Wealth Management, LLC | 153,733 | 1.65 | 5,070 | 11.97 | ||||
| 2025-07-31 | 13F | Cambridge Investment Research Advisors, Inc. | 74,719 | 12.50 | 2 | 100.00 | ||||
| 2025-08-12 | 13F | Chaney Capital Management, Inc. | 324,821 | 10.27 | 10,713 | 21.47 | ||||
| 2025-08-14 | 13F | Marshall Investment Management, Llc | 0 | -100.00 | 0 | |||||
| 2025-08-14 | 13F | Comerica Bank | 686 | 0.00 | 23 | 10.00 | ||||
| 2025-07-17 | 13F | Fifth Third Securities, Inc. | 9,983 | 2.08 | 329 | 12.67 | ||||
| 2025-07-23 | 13F | Heck Capital Advisors, LLC | 332,189 | 19.97 | 10,956 | 32.16 | ||||
| 2025-08-08 | 13F | OmniStar Financial Group, Inc. | 18,313 | -2.34 | 604 | 6.91 | ||||
| 2025-08-13 | 13F | Flow Traders U.s. Llc | 0 | -100.00 | 0 | |||||
| 2025-07-31 | 13F | Opes Wealth Management LLC | 132,660 | -1.25 | 4,375 | 8.78 | ||||
| 2025-07-17 | 13F | KWB Wealth | 325,785 | -42.76 | 9,754 | -39.48 | ||||
| 2025-08-13 | 13F | Fisher Asset Management, LLC | 13,414 | 442 | ||||||
| 2025-05-28 | 13F | Intrua Financial, LLC | 0 | -100.00 | 0 | -100.00 | ||||
| 2025-07-24 | 13F | Leo Wealth, LLC | 10,117 | 334 | ||||||
| 2025-07-29 | 13F | Interactive Financial Advisors | 37,123 | -16.79 | 1,224 | -8.31 | ||||
| 2025-08-04 | 13F | Spire Wealth Management | 166 | 1.22 | 5 | 25.00 | ||||
| 2025-08-15 | 13F | Morgan Stanley | 577,888 | 42.96 | 19,059 | 57.48 | ||||
| 2025-08-08 | 13F | SBI Securities Co., Ltd. | 379 | 3.27 | 12 | 20.00 | ||||
| 2025-07-15 | 13F | Well Done, LLC | 123,410 | 157.75 | 4,070 | 200.37 | ||||
| 2025-07-02 | 13F | Dentgroup LLC | 23,076 | 76.00 | 761 | 94.13 | ||||
| 2025-08-14 | 13F | Cascades Capital Asset Management, LLC | 7,212 | 15.89 | 238 | 27.42 | ||||
| 2025-08-14 | 13F | CoreCap Advisors, LLC | 4,149 | 4.75 | 137 | 15.25 | ||||
| 2025-08-08 | 13F | Avantax Advisory Services, Inc. | 266,910 | 7.71 | 8,803 | 18.64 | ||||
| 2025-08-13 | 13F | Jones Financial Companies Lllp | 36,877 | 90.94 | 1,214 | 107.35 | ||||
| 2025-07-31 | 13F | Leavell Investment Management, Inc. | 22,525 | 2.08 | 743 | 12.42 | ||||
| 2025-08-01 | 13F | American Financial & Tax Strategies Inc | 21,401 | -8.72 | 706 | 0.57 | ||||
| 2025-08-14 | 13F | Stifel Financial Corp | 85,606 | 7.11 | 2,823 | 18.02 | ||||
| 2025-07-29 | 13F | Stratos Wealth Partners, LTD. | 98,089 | -3.10 | 3,235 | 6.73 | ||||
| 2025-07-08 | 13F | Parallel Advisors, LLC | 1,558 | 155,700.00 | 51 | |||||
| 2025-08-13 | 13F | WCG Wealth Advisors LLC | 328,572 | 4.95 | 10,836 | 15.61 | ||||
| 2025-07-07 | 13F | Park Edge Advisors, LLC | 60,479 | 1,995 | ||||||
| 2025-08-14 | 13F | Jane Street Group, Llc | 47,928 | 1.04 | 1,581 | 11.27 | ||||
| 2025-07-29 | 13F | Private Trust Co Na | 3,993 | 6.85 | 132 | 18.02 | ||||
| 2025-08-11 | 13F | Strategic Wealth Partners, Ltd. | 50 | 2 | ||||||
| 2025-08-12 | 13F | LPL Financial LLC | 1,272,965 | 7.56 | 41,982 | 18.48 | ||||
| 2025-08-13 | 13F | Northwestern Mutual Wealth Management Co | 802,732 | 7.56 | 26,474 | 18.48 | ||||
| 2025-07-21 | 13F | Matauro, Llc | 6,845 | 0.78 | 226 | 10.84 | ||||
| 2025-07-22 | 13F | Valley National Advisers Inc | 0 | -100.00 | 0 | |||||
| 2025-08-14 | 13F | Susquehanna International Group, Llp | 13,878 | 458 | ||||||
| 2025-08-15 | 13F | Kestra Advisory Services, LLC | 10,195 | 39.07 | 336 | 53.42 | ||||
| 2025-08-14 | 13F | Citadel Advisors Llc | 88,428 | 2,916 | ||||||
| 2025-04-21 | 13F | PSI Advisors, LLC | 0 | -100.00 | 0 | |||||
| 2025-08-06 | 13F | True Wealth Design, LLC | 5,511 | -45.32 | 182 | -39.87 | ||||
| 2025-08-14 | 13F | Wells Fargo & Company/mn | 2,109 | -0.05 | 70 | 9.52 | ||||
| 2025-07-16 | 13F | Meridian Financial, LLC | 15,786 | 3.45 | 521 | 14.04 | ||||
| 2025-07-11 | 13F | Pinnacle Bancorp, Inc. | 0 | -100.00 | 0 | |||||
| 2025-08-08 | 13F | Pnc Financial Services Group, Inc. | 53 | 0.00 | 2 | 0.00 | ||||
| 2025-07-11 | 13F | Ullmann Financial Group, Inc. | 10,009 | 0.06 | 330 | 10.37 | ||||
| 2025-08-04 | 13F | Creative Financial Designs Inc /adv | 44,281 | 1.73 | 1,460 | 12.05 | ||||
| 2025-08-11 | 13F | Citigroup Inc | 200 | 0.00 | 7 | 20.00 | ||||
| 2025-07-21 | 13F | Monticello Wealth Management, Llc | 53,296 | -0.14 | 1,758 | 10.02 | ||||
| 2025-08-04 | 13F | Daymark Wealth Partners, Llc | 8,450 | 279 | ||||||
| 2025-08-13 | 13F | Providence Capital Advisors, LLC | 660 | 22 | ||||||
| 2025-08-18 | 13F | Front Row Advisors LLC | 867 | 0.00 | 29 | 12.00 | ||||
| 2025-08-14 | 13F | C M Bidwell & Associates Ltd | 78 | 0.00 | 3 | 0.00 | ||||
| 2025-08-14 | 13F | Fmr Llc | 1,443 | 3.96 | 48 | 14.63 | ||||
| 2025-08-18 | 13F | Geneos Wealth Management Inc. | 155 | 0.00 | 5 | 25.00 | ||||
| 2025-07-24 | 13F | Edge Financial Advisors LLC | 9,585 | 0.69 | 316 | 11.27 | ||||
| 2025-08-08 | 13F | Capital Investment Advisory Services, LLC | 2,900 | 26.09 | 96 | 39.71 | ||||
| 2025-05-13 | 13F | UBS Group AG | 0 | -100.00 | 0 | |||||
| 2025-08-13 | 13F | Valued Retirements, Inc. | 6,900 | -65.92 | 228 | -62.54 | ||||
| 2025-08-13 | 13F | Vertex Planning Partners, LLC | 37,367 | -1.10 | 1,232 | 8.93 | ||||
| 2025-07-16 | 13F | BOS Asset Management, LLC | 228,365 | 0.27 | 7,531 | 10.46 | ||||
| 2025-08-08 | 13F | Cetera Investment Advisers | 197,849 | 6.49 | 6,525 | 17.31 | ||||
| 2025-08-11 | 13F | HighTower Advisors, LLC | 18,472 | -5.38 | 609 | 4.28 | ||||
| 2025-08-14 | 13F | CIBC World Markets Inc. | 26,708 | 22.82 | 881 | 35.18 | ||||
| 2025-08-01 | 13F | Envestnet Asset Management Inc | 80,322 | 8.26 | 2,649 | 19.27 | ||||
| 2025-08-14 | 13F | Brinker Capital Investments, LLC | 0 | -100.00 | 0 | |||||
| 2025-07-16 | 13F | New Insight Wealth Advisors | 17,370 | -0.57 | 573 | 9.37 | ||||
| 2025-07-23 | 13F | Meitav Dash Investments Ltd | 7,364 | -3.60 | 242 | 6.14 | ||||
| 2025-07-30 | 13F | Financial Perspectives, Inc | 4,220 | 81.43 | 139 | 101.45 | ||||
| 2025-08-11 | 13F | Private Advisor Group, LLC | 14,988 | 9.95 | 494 | 21.08 | ||||
| 2025-08-15 | 13F | Equitable Holdings, Inc. | 0 | -100.00 | 0 | |||||
| 2025-04-28 | 13F | Novem Group | 0 | -100.00 | 0 | |||||
| 2025-08-14 | 13F | Bank Of America Corp /de/ | 83,083 | 95.37 | 2,740 | 115.24 | ||||
| 2025-08-13 | 13F | Kilter Group LLC | 0 | 0 | ||||||
| 2025-07-25 | 13F | Cwm, Llc | 1,518 | 3,350.00 | 0 | |||||
| 2025-07-24 | 13F | Capital Advisors, Ltd. LLC | 3,010 | 42.18 | 0 | |||||
| 2025-08-12 | 13F | MAI Capital Management | 18,203 | -11.63 | 600 | -2.60 | ||||
| 2025-08-08 | 13F | Cedar Wealth Management, LLC | 782,599 | 0.07 | 25,810 | 10.24 | ||||
| 2025-07-09 | 13F | Breakwater Capital Group | 73,842 | -0.04 | 2,435 | 10.13 | ||||
| 2025-08-12 | 13F | Proequities, Inc. | 0 | 0 | ||||||
| 2025-04-10 | 13F | Thurston, Springer, Miller, Herd & Titak, Inc. | 0 | -100.00 | 0 |