Basic Stats
| Institutional Owners | 89 total, 89 long only, 0 short only, 0 long/short - change of 0.00% MRQ |
| Average Portfolio Allocation | 0.3480 % - change of 61.04% MRQ |
| Institutional Shares (Long) | 2,345,608 (ex 13D/G) - change of -0.15MM shares -6.06% MRQ |
| Institutional Value (Long) | $ 245,242 USD ($1000) |
Institutional Ownership and Shareholders
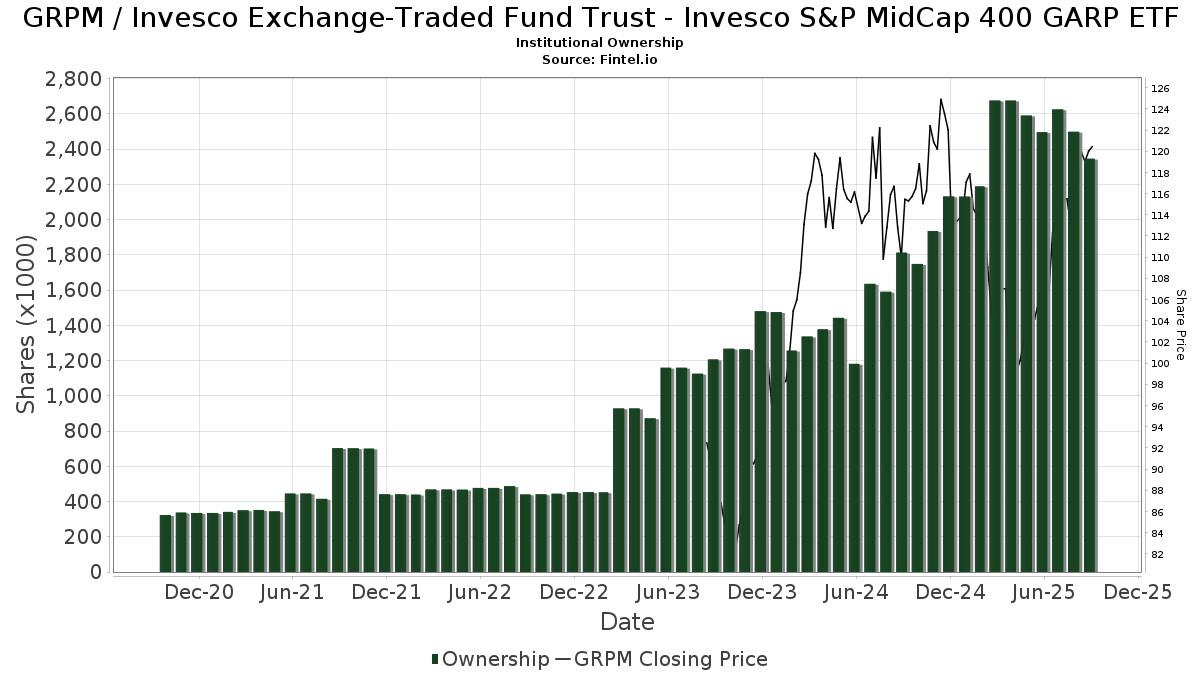
Invesco Exchange-Traded Fund Trust - Invesco S&P MidCap 400 GARP ETF (US:GRPM) has 89 institutional owners and shareholders that have filed 13D/G or 13F forms with the Securities Exchange Commission (SEC). These institutions hold a total of 2,345,608 shares. Largest shareholders include Morgan Stanley, LPL Financial LLC, Fortitude Financial, LLC, Northwestern Mutual Wealth Management Co, Bank Of America Corp /de/, Advisor Group Holdings, Inc., 626 Financial, LLC, Private Advisor Group, LLC, Jones Financial Companies Lllp, and WealthCare Investment Partners, LLC .
Invesco Exchange-Traded Fund Trust - Invesco S&P MidCap 400 GARP ETF (ARCA:GRPM) institutional ownership structure shows current positions in the company by institutions and funds, as well as latest changes in position size. Major shareholders can include individual investors, mutual funds, hedge funds, or institutions. The Schedule 13D indicates that the investor holds (or held) more than 5% of the company and intends (or intended) to actively pursue a change in business strategy. Schedule 13G indicates a passive investment of over 5%.
The share price as of September 5, 2025 is 120.75 / share. Previously, on September 6, 2024, the share price was 110.15 / share. This represents an increase of 9.62% over that period.
Fund Sentiment Score
The Fund Sentiment Score (fka Ownership Accumulation Score) finds the stocks that are being most bought by funds. It is the result of a sophisticated, multi-factor quantitative model that identifies companies with the highest levels of institutional accumulation. The scoring model uses a combination of the total increase in disclosed owners, the changes in portfolio allocations in those owners and other metrics. The number ranges from 0 to 100, with higher numbers indicating a higher level of accumulation to its peers, and 50 being the average.
Update Frequency: Daily
See Ownership Explorer, which provides a list of highest-ranking companies.
Institutional Put/Call Ratio
In addition to reporting standard equity and debt issues, institutions with more than 100MM assets under management must also disclose their put and call option holdings. Since put options generally indicate negative sentiment, and call options indicate positive sentiment, we can get a sense of the overall institutional sentiment by plotting the ratio of puts to calls. The chart to the right plots the historical put/call ratio for this instrument.
Using Put/Call Ratio as an indicator of investor sentiment overcomes one of the key deficiencies of using total institutional ownership, which is that a significant amount of assets under management are invested passively to track indices. Passively-managed funds do not typically buy options, so the put/call ratio indicator more closely tracks the sentiment of actively-managed funds.
13F and NPORT Filings
Detail on 13F filings are free. Detail on NP filings require a premium membership. Green rows indicate new positions. Red rows indicate closed positions. Click the link icon to see the full transaction history.
Upgrade
to unlock premium data and export to Excel ![]() .
.
| File Date | Source | Investor | Type | Avg Price (Est) |
Shares | Δ Shares (%) |
Reported Value ($1000) |
Δ Value (%) |
Port Alloc (%) |
|
|---|---|---|---|---|---|---|---|---|---|---|
| 2025-07-21 | 13F | Seros Financial, LLC | 8,336 | 2.36 | 911 | 6.92 | ||||
| 2025-08-08 | 13F | Larson Financial Group LLC | 792 | 87 | ||||||
| 2025-08-14 | 13F | GWM Advisors LLC | 2,758 | 925.28 | 301 | 975.00 | ||||
| 2025-07-31 | 13F | Glass Jacobson Investment Advisors llc | 605 | -9.70 | 66 | -12.00 | ||||
| 2025-08-08 | 13F | Gts Securities Llc | 27,099 | 55.74 | 2,962 | 62.60 | ||||
| 2025-08-08 | 13F | Capital Investment Advisory Services, LLC | 325 | -52.76 | 36 | -51.39 | ||||
| 2025-08-13 | 13F | Crescent Grove Advisors, LLC | 2,300 | 0.00 | 251 | 4.58 | ||||
| 2025-08-04 | 13F | Spire Wealth Management | 0 | -100.00 | 0 | |||||
| 2025-06-30 | NP | Northern Lights Fund Trust - PFG Invesco(R) Thematic ESG Strategy Class R Shares | 26,272 | 5.48 | 2,634 | -7.35 | ||||
| 2025-04-22 | 13F | Crews Bank & Trust | 0 | -100.00 | 0 | |||||
| 2025-08-12 | 13F | PSI Advisors, LLC | 0 | -100.00 | 0 | |||||
| 2025-07-10 | 13F | Exchange Traded Concepts, Llc | 108 | 12 | ||||||
| 2025-08-11 | 13F | Private Advisor Group, LLC | 70,828 | 99.99 | 7,741 | 108.74 | ||||
| 2025-07-24 | 13F | IFP Advisors, Inc | 20 | -94.74 | 2 | -94.87 | ||||
| 2025-05-02 | 13F | Prevail Innovative Wealth Advisors, Llc | 0 | -100.00 | 0 | |||||
| 2025-08-15 | 13F | Kestra Advisory Services, LLC | 5,363 | 5.26 | 586 | 9.94 | ||||
| 2025-08-12 | 13F | LPL Financial LLC | 160,429 | -8.81 | 17,533 | -4.81 | ||||
| 2025-08-14 | 13F | Integrated Wealth Concepts LLC | 18,656 | 2,039 | ||||||
| 2025-08-14 | 13F | Goldman Sachs Group Inc | 28,643 | 80.11 | 3,130 | 87.99 | ||||
| 2025-08-14 | 13F | Wells Fargo & Company/mn | 337 | -18.60 | 37 | -16.28 | ||||
| 2025-08-14 | 13F | EP Wealth Advisors, Inc. | 1,835 | 201 | ||||||
| 2025-05-13 | 13F/A | Heck Capital Advisors, LLC | 0 | -100.00 | 0 | -100.00 | ||||
| 2025-08-14 | 13F | Modern Wealth Management, LLC | 31,864 | 18.88 | 3,482 | 24.09 | ||||
| 2025-08-04 | 13F | Quaker Wealth Management, LLC | 140 | 15 | ||||||
| 2025-08-14 | 13F | Royal Bank Of Canada | 11,268 | -70.10 | 1,231 | -68.80 | ||||
| 2025-08-19 | 13F | Cape Investment Advisory, Inc. | 66 | 7 | ||||||
| 2025-07-25 | 13F | Cwm, Llc | 107 | 0.00 | 0 | |||||
| 2025-05-09 | 13F | North Ridge Wealth Advisors, Inc. | 0 | -100.00 | 0 | |||||
| 2025-08-06 | 13F | Commonwealth Equity Services, Llc | 20,320 | 3.92 | 2 | 0.00 | ||||
| 2025-08-13 | 13F | Victory Financial Group, Llc | 0 | -100.00 | 0 | |||||
| 2025-08-14 | 13F | Mariner, LLC | 4,278 | -1.20 | 468 | 3.09 | ||||
| 2025-08-12 | 13F | Ameritas Investment Partners, Inc. | 46,861 | 11.00 | 5,121 | 15.86 | ||||
| 2025-04-21 | 13F | Compass Capital Corp /ma/ /adv | 0 | -100.00 | 0 | |||||
| 2025-08-13 | 13F | Stenger Family Office, LLC | 38,498 | 5,348 | ||||||
| 2025-08-04 | 13F | Creative Financial Designs Inc /adv | 3,254 | 23.35 | 356 | 28.62 | ||||
| 2025-07-09 | 13F | WealthCare Investment Partners, LLC | 56,551 | -0.16 | 6,403 | 18.27 | ||||
| 2025-08-14 | 13F | Jane Street Group, Llc | 3,822 | -15.48 | 418 | -11.84 | ||||
| 2025-07-22 | 13F | Merit Financial Group, LLC | 17,723 | -73.08 | 1,937 | -71.91 | ||||
| 2025-07-21 | 13F | Ameritas Advisory Services, LLC | 344 | 38 | ||||||
| 2025-08-14 | 13F | Bank Of America Corp /de/ | 122,739 | -27.80 | 13,414 | -24.63 | ||||
| 2025-07-08 | 13F | Davis Investment Partners, LLC | 14,825 | -0.84 | 1,642 | 13.02 | ||||
| 2025-07-10 | 13F | Redhawk Wealth Advisors, Inc. | 4,011 | -37.08 | 438 | -34.33 | ||||
| 2025-08-14 | 13F | Susquehanna International Group, Llp | 8,405 | 13.64 | 919 | 18.60 | ||||
| 2025-08-13 | 13F | Northwestern Mutual Wealth Management Co | 129,346 | -30.97 | 14,136 | -27.94 | ||||
| 2025-07-31 | 13F | Cambridge Investment Research Advisors, Inc. | 41,225 | 91.79 | 5 | 100.00 | ||||
| 2025-08-12 | 13F | Proequities, Inc. | 0 | 0 | ||||||
| 2025-08-06 | 13F | AE Wealth Management LLC | 186 | -65.30 | 20 | -64.29 | ||||
| 2025-04-23 | 13F | Embree Financial Group | 0 | -100.00 | 0 | |||||
| 2025-08-13 | 13F | Cerity Partners LLC | 29,029 | -2.41 | 3,173 | 1.86 | ||||
| 2025-08-13 | 13F | Balance Wealth, LLC | 0 | -100.00 | 0 | |||||
| 2025-05-08 | 13F | Endeavor Private Wealth, Inc. | 0 | -100.00 | 0 | |||||
| 2025-08-11 | 13F | Principal Securities, Inc. | 789 | 995.83 | 86 | 975.00 | ||||
| 2025-07-25 | 13F | Courage Miller Partners, LLC | 1,983 | 0.00 | 217 | 4.35 | ||||
| 2025-08-08 | 13F | Cetera Investment Advisers | 56,033 | -44.76 | 6,124 | -42.34 | ||||
| 2025-08-15 | 13F | Morgan Stanley | 430,893 | -23.70 | 47,092 | -20.35 | ||||
| 2025-07-15 | 13F | Main Street Group, LTD | 1,860 | 70.02 | 203 | 78.07 | ||||
| 2025-09-04 | 13F/A | Advisor Group Holdings, Inc. | 112,369 | 76.79 | 12,294 | 84.76 | ||||
| 2025-08-08 | 13F | Creative Planning | 53,754 | -11.67 | 5,875 | -7.80 | ||||
| 2025-04-22 | 13F | Nilsine Partners, LLC | 0 | -100.00 | 0 | |||||
| 2025-08-05 | 13F | Bank Of Montreal /can/ | 3,729 | 0.49 | 408 | 4.90 | ||||
| 2025-08-01 | 13F | Envestnet Asset Management Inc | 31,081 | 0.28 | 3,397 | 4.65 | ||||
| 2025-08-04 | 13F | Integrity Alliance, Llc. | 0 | -100.00 | 0 | |||||
| 2025-08-14 | 13F | Fmr Llc | 469 | -36.62 | 51 | -33.77 | ||||
| 2025-08-14 | 13F | Raymond James Financial Inc | 39,050 | -4.76 | 4,268 | -0.58 | ||||
| 2025-08-05 | 13F | Arrowroot Family Office, LLC | 9,720 | -6.51 | 1,062 | -9.39 | ||||
| 2025-08-05 | 13F | Sigma Planning Corp | 19,252 | -3.62 | 2,104 | 0.62 | ||||
| 2025-07-29 | 13F | Private Trust Co Na | 150 | 16 | ||||||
| 2025-08-04 | 13F | Quaker Wealth Management, LLC | Put | 0 | -100.00 | 0 | -100.00 | |||
| 2025-08-07 | 13F | BOK Financial Private Wealth, Inc. | 146 | 0.00 | 16 | 0.00 | ||||
| 2025-08-04 | 13F/A | 626 Financial, LLC | 98,918 | -4.00 | 10,811 | 0.20 | ||||
| 2025-07-17 | 13F | Wagner Wealth Management, Llc | 0 | -100.00 | 0 | |||||
| 2025-08-07 | 13F | PFG Advisors | 4,686 | 3.38 | 512 | 8.02 | ||||
| 2025-08-15 | 13F | Asset Allocation Strategies LLC | 11,783 | 1,288 | ||||||
| 2025-07-24 | 13F | Us Bancorp \de\ | 749 | 0.00 | 82 | 3.85 | ||||
| 2025-07-24 | 13F | Tandem Capital Management Corp /adv | 4,755 | -1.76 | 520 | 2.57 | ||||
| 2025-04-28 | 13F | Financial Advocates Investment Management | 0 | -100.00 | 0 | |||||
| 2025-05-06 | 13F | SYM FINANCIAL Corp | 0 | -100.00 | 0 | |||||
| 2025-06-11 | 13F | Fortitude Financial, LLC | 143,018 | 825.14 | 14,974 | 759.04 | ||||
| 2025-08-12 | 13F | Cornerstone Wealth Management, LLC | 7,448 | -9.50 | 814 | -5.46 | ||||
| 2025-08-14 | 13F | UBS Group AG | 37,040 | 8.99 | 4,048 | 13.77 | ||||
| 2025-07-31 | 13F | Oppenheimer & Co Inc | 8,428 | 0.00 | 921 | 4.42 | ||||
| 2025-07-25 | 13F | Concurrent Investment Advisors, LLC | 16,622 | 1.32 | 1,817 | 5.77 | ||||
| 2025-07-28 | 13F | Sagespring Wealth Partners, Llc | 15,365 | 139.52 | 1,679 | 150.22 | ||||
| 2025-08-13 | 13F | Jones Financial Companies Lllp | 65,982 | 3.40 | 7,200 | 7.93 | ||||
| 2025-04-11 | 13F | Harbor Group, Inc. | 0 | -100.00 | 0 | |||||
| 2025-08-12 | 13F | Steward Partners Investment Advisory, Llc | 1,473 | 161 | ||||||
| 2025-08-06 | 13F | North Capital, Inc. | 24 | 0.00 | 3 | 0.00 | ||||
| 2025-08-08 | 13F | Avantax Advisory Services, Inc. | 11,171 | -1.00 | 1,221 | 3.30 | ||||
| 2025-08-04 | 13F | Bay Colony Advisory Group, Inc d/b/a Bay Colony Advisors | 2,646 | -11.80 | 289 | -7.67 | ||||
| 2025-08-26 | 13F/A | Thrivent Financial For Lutherans | 0 | -100.00 | 0 | |||||
| 2025-08-14 | 13F | Two Sigma Securities, Llc | 2,120 | -28.16 | 232 | -25.00 | ||||
| 2025-08-14 | 13F | Stifel Financial Corp | 38,898 | -51.61 | 4,255 | -49.48 | ||||
| 2025-07-28 | 13F | Axxcess Wealth Management, Llc | 7,475 | -6.76 | 817 | -2.74 | ||||
| 2025-08-14 | 13F | Citadel Advisors Llc | 13,436 | 47.42 | 1,468 | 53.88 | ||||
| 2025-05-05 | 13F | Mainstay Capital Management Llc /adv | 0 | -100.00 | 0 | |||||
| 2025-07-29 | 13F | Signature Estate & Investment Advisors Llc | 2,493 | -2.43 | 272 | 1.87 | ||||
| 2025-08-07 | 13F | Kestra Private Wealth Services, Llc | 47,392 | 5.24 | 5,179 | 9.86 | ||||
| 2025-08-12 | 13F | Gladstone Institutional Advisory LLC | 2,445 | 0.00 | 267 | 4.71 | ||||
| 2025-07-28 | 13F | Harbour Investments, Inc. | 143 | -83.04 | 16 | -82.95 | ||||
| 2025-08-13 | 13F | Flow Traders U.s. Llc | 5,832 | 155.68 | 1 | |||||
| 2025-07-24 | 13F | Capital Advisors, Ltd. LLC | 2,186 | 0.23 | 0 | |||||
| 2025-08-14 | 13F | Ameriprise Financial Inc | 31,442 | -3.10 | 3,436 | 0.61 | ||||
| 2025-05-12 | 13F | Townsquare Capital Llc | 0 | -100.00 | 0 | |||||
| 2025-08-08 | 13F | Thoroughbred Financial Services, Llc | 27,841 | -33.40 | 3 | -25.00 | ||||
| 2025-08-08 | 13F | Foundations Investment Advisors, LLC | 0 | -100.00 | 0 | |||||
| 2025-08-12 | 13F | Global Retirement Partners, LLC | 900 | 51.01 | 98 | 46.27 | ||||
| 2025-08-14 | 13F | Mml Investors Services, Llc | 5,367 | 21.48 | 1 | |||||
| 2025-07-17 | 13F | Janney Montgomery Scott LLC | 2,255 | 0.40 | 0 | |||||
| 2025-08-05 | 13F | Key FInancial Inc | 73 | 0.00 | 8 | 0.00 | ||||
| 2025-07-18 | 13F | Truist Financial Corp | 16,649 | -7.12 | 1,736 | -9.21 | ||||
| 2025-07-11 | 13F | International Private Wealth Advisors LLC | 4,560 | -1.81 | 498 | 2.47 | ||||
| 2025-08-13 | 13F | Lido Advisors, LLC | 3,147 | 0.00 | 344 | 4.26 | ||||
| 2025-05-12 | 13F | Independent Advisor Alliance | 0 | -100.00 | 0 | |||||
| 2025-08-14 | 13F | Marshall Investment Management, Llc | 0 | -100.00 | 0 | |||||
| 2025-04-22 | 13F | Manning & Napier Advisors Llc | 0 | -100.00 | 0 |