Basic Stats
| Institutional Owners | 176 total, 176 long only, 0 short only, 0 long/short - change of -1.12% MRQ |
| Average Portfolio Allocation | 0.1482 % - change of -6.21% MRQ |
| Institutional Shares (Long) | 46,435,842 (ex 13D/G) - change of 18.27MM shares 64.85% MRQ |
| Institutional Value (Long) | $ 390,779 USD ($1000) |
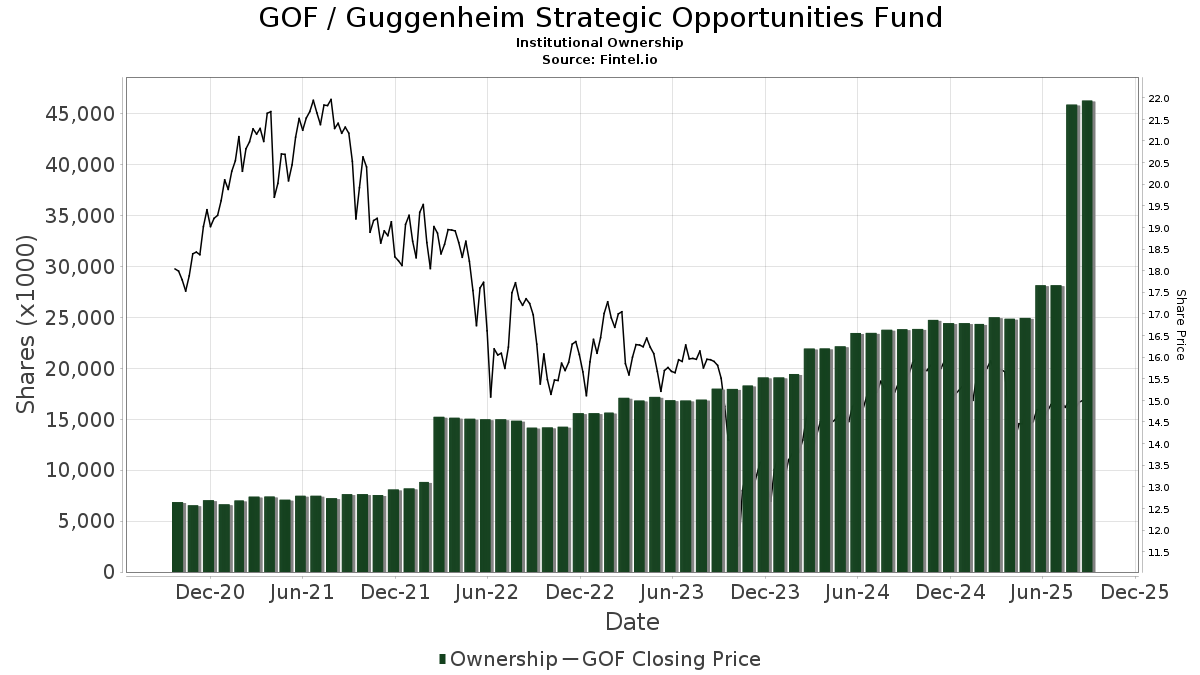
Institutional Ownership and Shareholders
Guggenheim Strategic Opportunities Fund (US:GOF) has 176 institutional owners and shareholders that have filed 13D/G or 13F forms with the Securities Exchange Commission (SEC). These institutions hold a total of 46,435,842 shares. Largest shareholders include Kingstone Capital Partners Texas, LLC, Morgan Stanley, LPL Financial LLC, Verus Capital Partners, Llc, UBS Group AG, Raymond James Financial Inc, Mml Investors Services, Llc, Advisor Group Holdings, Inc., Change Path, LLC, and Envestnet Asset Management Inc .
Guggenheim Strategic Opportunities Fund (NYSE:GOF) institutional ownership structure shows current positions in the company by institutions and funds, as well as latest changes in position size. Major shareholders can include individual investors, mutual funds, hedge funds, or institutions. The Schedule 13D indicates that the investor holds (or held) more than 5% of the company and intends (or intended) to actively pursue a change in business strategy. Schedule 13G indicates a passive investment of over 5%.
The share price as of September 4, 2025 is 15.08 / share. Previously, on September 5, 2024, the share price was 15.44 / share. This represents a decline of 2.33% over that period.
Fund Sentiment Score
The Fund Sentiment Score (fka Ownership Accumulation Score) finds the stocks that are being most bought by funds. It is the result of a sophisticated, multi-factor quantitative model that identifies companies with the highest levels of institutional accumulation. The scoring model uses a combination of the total increase in disclosed owners, the changes in portfolio allocations in those owners and other metrics. The number ranges from 0 to 100, with higher numbers indicating a higher level of accumulation to its peers, and 50 being the average.
Update Frequency: Daily
See Ownership Explorer, which provides a list of highest-ranking companies.
Institutional Put/Call Ratio
In addition to reporting standard equity and debt issues, institutions with more than 100MM assets under management must also disclose their put and call option holdings. Since put options generally indicate negative sentiment, and call options indicate positive sentiment, we can get a sense of the overall institutional sentiment by plotting the ratio of puts to calls. The chart to the right plots the historical put/call ratio for this instrument.
Using Put/Call Ratio as an indicator of investor sentiment overcomes one of the key deficiencies of using total institutional ownership, which is that a significant amount of assets under management are invested passively to track indices. Passively-managed funds do not typically buy options, so the put/call ratio indicator more closely tracks the sentiment of actively-managed funds.
13F and NPORT Filings
Detail on 13F filings are free. Detail on NP filings require a premium membership. Green rows indicate new positions. Red rows indicate closed positions. Click the link icon to see the full transaction history.
Upgrade
to unlock premium data and export to Excel ![]() .
.
| File Date | Source | Investor | Type | Avg Price (Est) |
Shares | Δ Shares (%) |
Reported Value ($1000) |
Δ Value (%) |
Port Alloc (%) |
|
|---|---|---|---|---|---|---|---|---|---|---|
| 2025-07-09 | 13F | Dynamic Advisor Solutions LLC | 77,521 | 2.65 | 1,154 | -1.79 | ||||
| 2025-04-23 | 13F | Walkner Condon Financial Advisors LLC | 0 | -100.00 | 0 | |||||
| 2025-08-26 | 13F/A | Thrivent Financial For Lutherans | 0 | -100.00 | 0 | |||||
| 2025-07-14 | 13F | Bank & Trust Co | 32 | 0.00 | 0 | |||||
| 2025-07-08 | 13F | Nbc Securities, Inc. | 22,523 | 11.93 | 0 | |||||
| 2025-08-01 | 13F | Envestnet Asset Management Inc | 730,756 | 70.77 | 10,881 | 63.31 | ||||
| 2025-08-11 | 13F | Semus Wealth Partners LLC | 21,028 | -3.66 | 313 | -7.67 | ||||
| 2025-08-12 | 13F | Founders Financial Alliance, LLC | 112,171 | -1.83 | 1,670 | -6.07 | ||||
| 2025-07-15 | 13F | Kentucky Trust Co | 1,500 | 0.00 | 22 | -4.35 | ||||
| 2025-07-18 | 13F | PFG Investments, LLC | 73,707 | 2.48 | 1,097 | -1.97 | ||||
| 2025-08-14 | 13F | Integrated Wealth Concepts LLC | 207,675 | 11.52 | 3,092 | 6.66 | ||||
| 2025-08-07 | 13F | Verus Capital Partners, Llc | 1,877,230 | 19.36 | 27,952 | 14.15 | ||||
| 2025-07-14 | 13F | Capital CS Group, LLC | 21,441 | 3.96 | 319 | -0.62 | ||||
| 2025-07-21 | 13F | Empirical Financial Services, LLC d.b.a. Empirical Wealth Management | 14,539 | 0.00 | 216 | -4.42 | ||||
| 2025-07-18 | 13F | Truist Financial Corp | 316,322 | 42.60 | 4,710 | 36.40 | ||||
| 2025-07-21 | 13F | Ameriflex Group, Inc. | 695 | 2.66 | 10 | 0.00 | ||||
| 2025-08-13 | 13F | Baird Financial Group, Inc. | 199,877 | 11.09 | 2,976 | 6.25 | ||||
| 2025-08-08 | 13F | Avantax Advisory Services, Inc. | 78,710 | 2.39 | 1,172 | -2.09 | ||||
| 2025-07-10 | 13F | Sovran Advisors, LLC | 80,886 | -11.38 | 1,211 | -7.42 | ||||
| 2025-08-12 | 13F | J.w. Cole Advisors, Inc. | 19,747 | 22.24 | 294 | 17.13 | ||||
| 2025-07-29 | 13F | Private Trust Co Na | 713 | 0.00 | 11 | -9.09 | ||||
| 2025-04-21 | 13F | ORG Partners LLC | 0 | -100.00 | 0 | |||||
| 2025-08-04 | 13F | Daymark Wealth Partners, Llc | 12,301 | 183 | ||||||
| 2025-07-03 | 13F | Garde Capital, Inc. | 2,258 | 0.00 | 34 | -5.71 | ||||
| 2025-07-08 | 13F | Zrc Wealth Management, Llc | 0 | -100.00 | 0 | |||||
| 2025-08-27 | 13F/A | Brinker Capital Investments, LLC | 27,975 | 113.53 | 417 | 104.93 | ||||
| 2025-08-11 | 13F | Pin Oak Investment Advisors Inc | 3,122 | 3.51 | 0 | |||||
| 2025-05-14 | 13F | Semmax Financial Advisors Inc. | 0 | -100.00 | 0 | |||||
| 2025-08-14 | 13F | IHT Wealth Management, LLC | 11,015 | -2.55 | 164 | -6.29 | ||||
| 2025-07-22 | 13F | Firethorn Wealth Partners, Llc | 10,588 | 3.76 | 158 | -0.63 | ||||
| 2025-08-08 | 13F | Larson Financial Group LLC | 2,293 | 0.97 | 34 | -2.86 | ||||
| 2025-08-15 | 13F | Kestra Advisory Services, LLC | 128,699 | 198.03 | 1,916 | 185.12 | ||||
| 2025-05-19 | 13F | Smith Asset Management Co., LLC | 19,395 | 302 | ||||||
| 2025-08-05 | 13F | Tsfg, Llc | 11,900 | 0.08 | 0 | |||||
| 2025-07-31 | 13F | WFA Asset Management Corp | 21,660 | 28.94 | 323 | 34.17 | ||||
| 2025-08-11 | 13F | Perennial Investment Advisors, LLC | 19,489 | 21.97 | 290 | 16.94 | ||||
| 2025-08-11 | 13F | Private Advisor Group, LLC | 102,502 | 3.72 | 1,526 | -0.78 | ||||
| 2025-08-14 | 13F | UBS Group AG | 1,522,861 | 3.41 | 22,675 | -1.10 | ||||
| 2025-05-05 | 13F | Transce3nd, LLC | 0 | -100.00 | 0 | |||||
| 2025-05-16 | 13F | Coppell Advisory Solutions LLC | 0 | -100.00 | 0 | |||||
| 2025-08-15 | 13F | Equitable Holdings, Inc. | 48,243 | 11.86 | 718 | 7.00 | ||||
| 2025-07-10 | 13F | Oliver Lagore Vanvalin Investment Group | 2,110 | 0.00 | 33 | 0.00 | ||||
| 2025-04-16 | 13F | Fortitude Family Office, LLC | 0 | -100.00 | 0 | |||||
| 2025-04-22 | 13F | TrueMark Investments, LLC | 0 | -100.00 | 0 | |||||
| 2025-08-14 | 13F | Smartleaf Asset Management LLC | 6 | 0.00 | 0 | |||||
| 2025-08-14 | 13F | Tennessee Valley Asset Management Partners | 0 | -100.00 | 0 | |||||
| 2025-08-05 | 13F | Bank of New York Mellon Corp | 201,781 | 540.45 | 3,005 | 513.06 | ||||
| 2025-08-12 | 13F | Global Retirement Partners, LLC | 14,510 | 240.21 | 216 | 232.31 | ||||
| 2025-08-14 | 13F | Warren Averett Asset Management, LLC | 19,855 | 0.00 | 296 | -4.53 | ||||
| 2025-08-12 | 13F | Jacobi Capital Management LLC | 30,538 | 22.94 | 455 | 17.62 | ||||
| 2025-08-14 | 13F | Ausdal Financial Partners, Inc. | 78,518 | -0.03 | 1,169 | -4.34 | ||||
| 2025-08-12 | 13F | PSI Advisors, LLC | 0 | -100.00 | 0 | |||||
| 2025-08-06 | 13F | AE Wealth Management LLC | 24,079 | 3.61 | 359 | -0.83 | ||||
| 2025-07-17 | 13F | Beacon Capital Management, LLC | 1,983 | 0.00 | 30 | -3.33 | ||||
| 2025-07-08 | 13F | Parisi Gray Wealth Management | 50,975 | 0.00 | 759 | -4.29 | ||||
| 2025-07-31 | 13F | Cambridge Investment Research Advisors, Inc. | 236,170 | -63.37 | 4 | -70.00 | ||||
| 2025-08-12 | 13F | LPL Financial LLC | 2,051,627 | 5.57 | 30,549 | 0.96 | ||||
| 2025-08-05 | 13F | Prosperity Wealth Management, Inc. | 21,700 | 14.20 | 323 | 9.49 | ||||
| 2025-07-14 | 13F | Gridiron Partners, LLC | 10,000 | 0.00 | 149 | -4.52 | ||||
| 2025-08-14 | 13F | Ameriprise Financial Inc | 68,229 | -5.26 | 1,016 | -9.46 | ||||
| 2025-08-14 | 13F | Gen-Wealth Partners Inc | 659 | 0.00 | 10 | -10.00 | ||||
| 2025-07-09 | 13F | Fiduciary Alliance LLC | 43,312 | -3.48 | 645 | -7.74 | ||||
| 2025-08-08 | 13F | Foundations Investment Advisors, LLC | 12,904 | 19.93 | 192 | 14.97 | ||||
| 2025-08-29 | 13F | Total Investment Management Inc | 79 | 1 | ||||||
| 2025-05-09 | 13F | Gill Capital Partners, Llc | 0 | -100.00 | 0 | |||||
| 2025-07-10 | 13F | Focus Financial Network, Inc. | 55,205 | 22.41 | 822 | 16.95 | ||||
| 2025-03-11 | 13F/A | Elequin Capital Lp | 0 | -100.00 | 0 | |||||
| 2025-08-08 | 13F | Cetera Investment Advisers | 679,066 | 11.96 | 10,111 | 7.07 | ||||
| 2025-08-08 | 13F | Capital Investment Advisory Services, LLC | 83,750 | 92.31 | 1,247 | 83.92 | ||||
| 2025-08-12 | 13F | Proequities, Inc. | 0 | 0 | ||||||
| 2025-08-18 | 13F | Geneos Wealth Management Inc. | 59,038 | 100.72 | 879 | 92.34 | ||||
| 2025-08-05 | 13F | Milestone Asset Management, Llc | 13,835 | -88.26 | 206 | -88.77 | ||||
| 2025-08-07 | 13F | New England Private Wealth Advisors LLC | 43,327 | -2.26 | 643 | -6.96 | ||||
| 2025-05-02 | 13F | Transcendent Capital Group LLC | 0 | -100.00 | 0 | |||||
| 2025-08-11 | 13F | Mosaic Family Wealth Partners, Llc | 227,244 | 4.14 | 3,384 | -0.41 | ||||
| 2025-08-07 | 13F | Vista Investment Partners Ii, Llc | 14,592 | -2.34 | 217 | -6.47 | ||||
| 2025-08-13 | 13F | Jones Financial Companies Lllp | 0 | -100.00 | 0 | |||||
| 2025-08-13 | 13F | Rsm Us Wealth Management Llc | 69,301 | 0.00 | 1,032 | -4.45 | ||||
| 2025-08-28 | NP | Cohen & Steers Closed-end Opportunity Fund, Inc. | 346,789 | -10.34 | 5,164 | -14.26 | ||||
| 2025-08-07 | 13F | Illumine Investment Management, LLC | 216,834 | 1.36 | 3,229 | -3.06 | ||||
| 2025-08-12 | 13F | Insigneo Advisory Services, Llc | 33,166 | 0.00 | 494 | -4.46 | ||||
| 2025-08-13 | 13F | Fisher Asset Management, LLC | 13,964 | 208 | ||||||
| 2025-08-06 | 13F | Wedbush Securities Inc | 176,925 | -2.36 | 3 | 0.00 | ||||
| 2025-07-15 | 13F | LVZ Advisors, Inc. | 12,682 | -10.75 | 189 | -14.93 | ||||
| 2025-07-10 | 13F | Secure Asset Management, LLC | 433,655 | -2.26 | 6,457 | -6.52 | ||||
| 2025-08-11 | 13F | Western Wealth Management, LLC | 36,808 | 3.07 | 548 | -1.44 | ||||
| 2025-08-07 | 13F | Encompass More Asset Management | 24,430 | 13.02 | 364 | 8.04 | ||||
| 2025-05-08 | 13F | Main Street Financial Solutions, LLC | 0 | -100.00 | 0 | |||||
| 2025-07-15 | 13F | Mather Group, Llc. | 0 | -100.00 | 0 | |||||
| 2025-07-23 | 13F | Elm3 Financial Group, LLC | 13,667 | -0.07 | 204 | -4.25 | ||||
| 2025-07-30 | 13F | Retirement Planning Group | 115,420 | 30.97 | 1,719 | 25.22 | ||||
| 2025-07-25 | 13F | Almanack Investment Partners, LLC. | 230,090 | 0.19 | 3,426 | -4.17 | ||||
| 2025-07-24 | 13F | Us Bancorp \de\ | 186 | 0.00 | 3 | 0.00 | ||||
| 2025-07-24 | 13F | IFP Advisors, Inc | 97 | -99.43 | 1 | -99.62 | ||||
| 2025-08-04 | 13F | Bay Colony Advisory Group, Inc d/b/a Bay Colony Advisors | 222,731 | -13.87 | 3,316 | -17.47 | ||||
| 2025-07-21 | 13F | Patriot Financial Group Insurance Agency, LLC | 20,059 | 2.71 | 299 | -1.97 | ||||
| 2025-04-30 | 13F | Allworth Financial LP | 0 | -100.00 | 0 | |||||
| 2025-07-28 | 13F | Harbour Investments, Inc. | 12,764 | -6.44 | 190 | -10.38 | ||||
| 2025-08-11 | 13F | FSA Wealth Management LLC | 4,676 | 0.00 | 70 | -4.17 | ||||
| 2025-08-12 | 13F | MAI Capital Management | 3,417 | 3.95 | 51 | -1.96 | ||||
| 2025-07-11 | 13F | Farther Finance Advisors, LLC | 26 | -99.40 | 0 | -100.00 | ||||
| 2025-08-14 | 13F | Mml Investors Services, Llc | 801,302 | 0.61 | 12 | -8.33 | ||||
| 2025-08-05 | 13F | Huntington National Bank | 0 | |||||||
| 2025-07-11 | 13F | Mallini Complete Financial Planning LLC | 38,562 | 9.98 | 574 | 5.32 | ||||
| 2025-07-21 | 13F | Future Financial Wealth Managment LLC | 4,000 | 0.00 | 60 | -4.84 | ||||
| 2025-08-11 | 13F | HighTower Advisors, LLC | 28,930 | -5.09 | 431 | -9.28 | ||||
| 2025-08-14 | 13F | Cohen & Steers, Inc. | 346,789 | -10.34 | 5 | -16.67 | ||||
| 2025-07-30 | 13F | Brookstone Capital Management | 56,269 | -13.34 | 838 | -17.13 | ||||
| 2025-04-14 | 13F | Strategic Wealth Designers | 0 | -100.00 | 0 | -100.00 | ||||
| 2025-07-17 | 13F | Presper Financial Architects, LLC | 50,550 | 1 | ||||||
| 2025-07-14 | 13F | Buska Wealth Management, LLC | 32,589 | 4.80 | 485 | 0.21 | ||||
| 2025-08-08 | 13F | Creative Planning | 10,064 | -54.70 | 150 | -56.81 | ||||
| 2025-08-19 | 13F | Advisory Services Network, LLC | 0 | -100.00 | 0 | |||||
| 2025-08-14 | 13F | Comerica Bank | 30,596 | 75.97 | 456 | 68.52 | ||||
| 2025-08-14 | 13F | Wells Fargo & Company/mn | 9,196 | 63.28 | 137 | 56.32 | ||||
| 2025-08-01 | 13F | Motco | 0 | -100.00 | 0 | |||||
| 2025-07-11 | 13F | Kapstone Financial Advisors LLC | 11,070 | 165 | ||||||
| 2025-08-13 | 13F | EverSource Wealth Advisors, LLC | 2,461 | 0.00 | 37 | -5.26 | ||||
| 2025-07-02 | 13F | Capital Market Strategies LLC | 31,000 | -12.11 | 462 | -16.03 | ||||
| 2025-08-05 | 13F | Sigma Planning Corp | 76,789 | 0.32 | 1,143 | -4.03 | ||||
| 2025-07-31 | 13F | Oppenheimer & Co Inc | 50,711 | 1.49 | 755 | -2.83 | ||||
| 2025-08-14 | 13F | Mercer Global Advisors Inc /adv | 71,424 | -4.19 | 1,064 | -8.36 | ||||
| 2025-08-05 | 13F | Uniting Wealth Partners, LLC | 10,000 | 0.00 | 149 | -4.52 | ||||
| 2025-08-14 | 13F | Stifel Financial Corp | 47,339 | 6.61 | 705 | 1.88 | ||||
| 2025-07-22 | 13F | Iron Horse Wealth Management, LLC | 2,006 | 30 | ||||||
| 2025-07-25 | 13F | Hazlett, Burt & Watson, Inc. | 1,355 | 6.27 | 0 | |||||
| 2025-07-17 | 13F | Janney Montgomery Scott LLC | 283,722 | 7.70 | 4 | 0.00 | ||||
| 2025-07-17 | 13F | Wagner Wealth Management, Llc | 19,403 | 0.00 | 289 | -4.64 | ||||
| 2025-08-06 | 13F | Vantage Financial Partners, LLC | 13,445 | -16.09 | 200 | -19.68 | ||||
| 2025-08-11 | 13F | Advisor Resource Council | 0 | -100.00 | 0 | |||||
| 2025-07-25 | 13F | Concord Wealth Partners | 271 | 0.00 | 4 | 0.00 | ||||
| 2025-08-19 | 13F | National Asset Management, Inc. | 30,379 | -33.05 | 452 | -34.68 | ||||
| 2025-08-12 | 13F | Country Trust Bank | 4,000 | 60 | ||||||
| 2025-07-28 | 13F | Mutual Advisors, LLC | 92,537 | -4.88 | 1,392 | -0.78 | ||||
| 2025-08-08 | 13F | Kingsview Wealth Management, LLC | 11,030 | 164 | ||||||
| 2025-08-14 | 13F | Banque Transatlantique SA | 0 | -100.00 | 0 | |||||
| 2025-07-29 | 13F | Stratos Wealth Partners, LTD. | 42,331 | 2.89 | 630 | -1.56 | ||||
| 2025-07-07 | 13F | Nova Wealth Management, Inc. | 2,940 | 0.00 | 44 | -4.44 | ||||
| 2025-08-13 | 13F | Northwestern Mutual Wealth Management Co | 3,144 | -70.57 | 47 | -72.29 | ||||
| 2025-08-14 | 13F | Mpwm Advisory Solutions, Llc | 7,000 | 0.00 | 104 | -3.70 | ||||
| 2025-08-14 | 13F | Great Valley Advisor Group, Inc. | 149,327 | 14.19 | 2,223 | 9.18 | ||||
| 2025-09-04 | 13F/A | Advisor Group Holdings, Inc. | 770,890 | 3.07 | 11,479 | -1.43 | ||||
| 2025-07-22 | 13F | Coastal Investment Advisors, Inc. | 20,383 | 5.16 | 304 | 0.66 | ||||
| 2025-07-29 | 13F | International Assets Investment Management, Llc | 15,941 | 3.43 | 237 | -0.84 | ||||
| 2025-08-14 | 13F | CoreCap Advisors, LLC | 47,641 | 1.85 | 709 | -2.61 | ||||
| 2025-07-23 | 13F | Prime Capital Investment Advisors, LLC | 424,839 | -41.59 | 6,326 | -44.14 | ||||
| 2025-08-07 | 13F | Kestra Private Wealth Services, Llc | 17,597 | 262 | ||||||
| 2025-07-21 | 13F | Ameritas Advisory Services, LLC | 10,546 | 0.00 | 157 | -1.87 | ||||
| 2025-07-30 | 13F | Financial Perspectives, Inc | 35 | 0.00 | 1 | |||||
| 2025-08-05 | 13F | GPS Wealth Strategies Group, LLC | 31,504 | 0.00 | 469 | -4.29 | ||||
| 2025-08-14 | 13F/A | Rockefeller Capital Management L.P. | 30,008 | 1.19 | 447 | -3.25 | ||||
| 2025-08-14 | 13F | Harwood Advisory Group, LLC | 750 | 0.00 | 11 | 0.00 | ||||
| 2025-08-11 | 13F | Core Wealth Partners LLC | 10,979 | 0.00 | 163 | -4.12 | ||||
| 2025-08-19 | 13F | Newbridge Financial Services Group, Inc. | 325 | 5 | ||||||
| 2025-08-11 | 13F | Principal Securities, Inc. | 145,460 | 9.56 | 2,166 | 6.91 | ||||
| 2025-05-15 | 13F | Citadel Advisors Llc | 0 | -100.00 | 0 | |||||
| 2025-07-30 | NP | HYIN - WisdomTree Alternative Income Fund N/A | 113,087 | 7.51 | 1,666 | 0.73 | ||||
| 2025-07-22 | 13F | DAVENPORT & Co LLC | 34,008 | 22.98 | 506 | 17.67 | ||||
| 2025-07-11 | 13F/A | Umb Bank N A/mo | 70,038 | 1.33 | 1,043 | -3.16 | ||||
| 2025-08-11 | 13F | Citigroup Inc | 1 | 0.00 | 0 | |||||
| 2025-08-15 | 13F | Captrust Financial Advisors | 49,945 | -45.75 | 744 | -48.15 | ||||
| 2025-07-24 | 13F | Eastern Bank | 4,073 | 0.00 | 61 | -4.76 | ||||
| 2025-08-14 | 13F | Garden State Investment Advisory Services LLC | 56,531 | -1.78 | 842 | -6.14 | ||||
| 2025-07-23 | 13F | Kingswood Wealth Advisors, Llc | 0 | -100.00 | 0 | |||||
| 2025-05-12 | 13F | Fmr Llc | 0 | -100.00 | 0 | |||||
| 2025-05-15 | 13F | Tower Research Capital LLC (TRC) | 0 | -100.00 | 0 | |||||
| 2025-08-05 | 13F | Strategic Financial Concepts, LLC | 52,357 | -6.78 | 780 | -10.87 | ||||
| 2025-08-14 | 13F | Atomi Financial Group, Inc. | 27,591 | 0.00 | 411 | -4.43 | ||||
| 2025-08-08 | 13F | Richmond Brothers, Inc. | 238,400 | 3.56 | 3,550 | -0.98 | ||||
| 2025-08-11 | 13F | Anfield Capital Management, LLC | 3,654 | 0.00 | 54 | -3.57 | ||||
| 2025-05-15 | 13F/A | Orion Portfolio Solutions, LLC | 13,101 | 204 | ||||||
| 2025-08-05 | 13F | Flynn Zito Capital Management, Llc | 92,647 | 108.18 | 1,380 | 99.28 | ||||
| 2025-07-11 | 13F | Kingstone Capital Partners Texas, LLC | 17,953,239 | 288 | ||||||
| 2025-05-14 | 13F | Oarsman Capital, Inc. | 0 | -100.00 | 0 | |||||
| 2025-08-14 | 13F | Bank Of America Corp /de/ | 551,009 | 4.03 | 8,205 | -0.51 | ||||
| 2025-07-29 | 13F | Altus Wealth Group LLC | 10,092 | -2.63 | 150 | -6.83 | ||||
| 2025-08-11 | 13F | NewEdge Wealth, LLC | 0 | -100.00 | 0 | |||||
| 2025-07-14 | 13F | U.S. Capital Wealth Advisors, LLC | 19,323 | 7.99 | 288 | 3.24 | ||||
| 2025-07-22 | 13F | Merit Financial Group, LLC | 26,125 | 1.86 | 389 | -2.51 | ||||
| 2025-08-14 | 13F | Wiley Bros.-aintree Capital, Llc | 10,979 | 0.00 | 163 | -4.12 | ||||
| 2025-08-04 | 13F | Spire Wealth Management | 9,708 | 0.00 | 145 | -4.64 | ||||
| 2025-05-15 | 13F | Gwn Securities Inc. | 0 | -100.00 | 0 | |||||
| 2025-08-04 | 13F | IFG Advisory, LLC | 89,696 | 327.63 | 1,336 | 309.51 | ||||
| 2025-07-11 | 13F | Quad-Cities Investment Group, LLC | 16,982 | 8.48 | 253 | 3.70 | ||||
| 2025-08-08 | 13F | Pnc Financial Services Group, Inc. | 141,449 | 7.19 | 2,106 | 2.53 | ||||
| 2025-07-31 | 13F | Moloney Securities Asset Management, LLC | 17,825 | 24.95 | 265 | 19.37 | ||||
| 2025-08-14 | 13F | GWM Advisors LLC | 107,752 | 2.43 | 1,604 | -2.02 | ||||
| 2025-05-15 | 13F | Hrt Financial Lp | 0 | -100.00 | 0 | |||||
| 2025-07-22 | 13F | Marks Group Wealth Management, Inc | 196,262 | 0.00 | 2,922 | -4.35 | ||||
| 2025-07-25 | 13F | Atria Wealth Solutions, Inc. | 60,747 | -76.42 | 905 | -77.47 | ||||
| 2025-08-14 | 13F | Raymond James Financial Inc | 958,371 | -17.71 | 14,270 | -21.30 | ||||
| 2025-07-29 | 13F | Disciplined Investments, LLC | 24,641 | -21.77 | 367 | -25.31 | ||||
| 2025-07-22 | 13F | Beacon Financial Advisory LLC | 10,296 | 153 | ||||||
| 2025-08-12 | 13F | Marshall & Sterling Wealth Advisors Inc. | 26 | 0.00 | 0 | |||||
| 2025-08-14 | 13F | Sunbelt Securities, Inc. | 7,851 | 3.99 | 120 | 1.71 | ||||
| 2025-08-12 | 13F | CIBC Private Wealth Group, LLC | 3,826 | -20.70 | 57 | -16.42 | ||||
| 2025-07-25 | 13F | Apollon Wealth Management, LLC | 23,214 | 56.32 | 346 | 49.35 | ||||
| 2025-08-12 | 13F | Steward Partners Investment Advisory, Llc | 129,941 | 6.94 | 1,935 | 2.27 | ||||
| 2025-08-01 | 13F | Petra Financial Advisors Inc | 445,056 | 108.65 | 6,627 | 99.52 | ||||
| 2025-08-12 | 13F | BlackRock, Inc. | 43,314 | 58.51 | 645 | 51.53 | ||||
| 2025-08-14 | 13F | Royal Bank Of Canada | 659,129 | 6.58 | 9,814 | 1.92 | ||||
| 2025-08-15 | 13F | Morgan Stanley | 7,297,290 | 6.33 | 108,657 | 1.69 | ||||
| 2025-08-13 | 13F | Capital Analysts, Inc. | 20,710 | 2.55 | 0 | |||||
| 2025-08-12 | 13F | Change Path, LLC | 740,653 | 8.49 | 11,028 | 3.75 | ||||
| 2025-07-24 | 13F | JB Capital LLC | 24,819 | 0.47 | 370 | -3.91 | ||||
| 2025-07-09 | 13F | David J Yvars Group | 22,463 | 0.90 | 334 | -3.47 | ||||
| 2025-08-06 | 13F | Moors & Cabot, Inc. | 12,055 | 0.00 | 179 | -4.28 | ||||
| 2025-08-11 | 13F | Aptus Capital Advisors, LLC | 11,374 | 0.31 | 169 | -3.98 | ||||
| 2025-08-06 | 13F | Commonwealth Equity Services, Llc | 300,610 | -55.21 | 4 | -60.00 |