Basic Stats
| Institutional Owners | 125 total, 125 long only, 0 short only, 0 long/short - change of -4.58% MRQ |
| Average Portfolio Allocation | 0.0399 % - change of -92.46% MRQ |
| Institutional Shares (Long) | 3,181,404 (ex 13D/G) - change of -5.13MM shares -61.74% MRQ |
| Institutional Value (Long) | $ 181,805 USD ($1000) |
Institutional Ownership and Shareholders
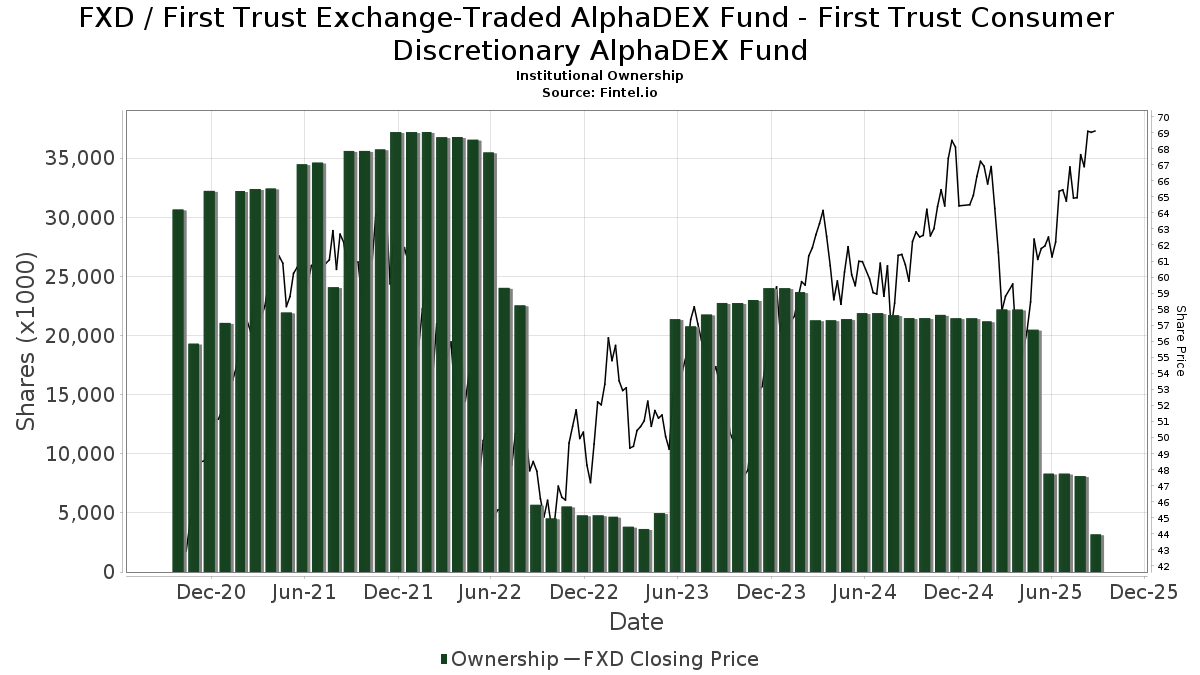
First Trust Exchange-Traded AlphaDEX Fund - First Trust Consumer Discretionary AlphaDEX Fund (US:FXD) has 125 institutional owners and shareholders that have filed 13D/G or 13F forms with the Securities Exchange Commission (SEC). These institutions hold a total of 3,181,404 shares. Largest shareholders include Wells Fargo & Company/mn, Morgan Stanley, LPL Financial LLC, Raymond James Financial Inc, Cambridge Investment Research Advisors, Inc., Bank Of America Corp /de/, Janney Montgomery Scott LLC, Stifel Financial Corp, Goldman Sachs Group Inc, and UBS Group AG .
First Trust Exchange-Traded AlphaDEX Fund - First Trust Consumer Discretionary AlphaDEX Fund (ARCA:FXD) institutional ownership structure shows current positions in the company by institutions and funds, as well as latest changes in position size. Major shareholders can include individual investors, mutual funds, hedge funds, or institutions. The Schedule 13D indicates that the investor holds (or held) more than 5% of the company and intends (or intended) to actively pursue a change in business strategy. Schedule 13G indicates a passive investment of over 5%.
The share price as of September 5, 2025 is 70.01 / share. Previously, on September 6, 2024, the share price was 59.57 / share. This represents an increase of 17.53% over that period.
Fund Sentiment Score
The Fund Sentiment Score (fka Ownership Accumulation Score) finds the stocks that are being most bought by funds. It is the result of a sophisticated, multi-factor quantitative model that identifies companies with the highest levels of institutional accumulation. The scoring model uses a combination of the total increase in disclosed owners, the changes in portfolio allocations in those owners and other metrics. The number ranges from 0 to 100, with higher numbers indicating a higher level of accumulation to its peers, and 50 being the average.
Update Frequency: Daily
See Ownership Explorer, which provides a list of highest-ranking companies.
Institutional Put/Call Ratio
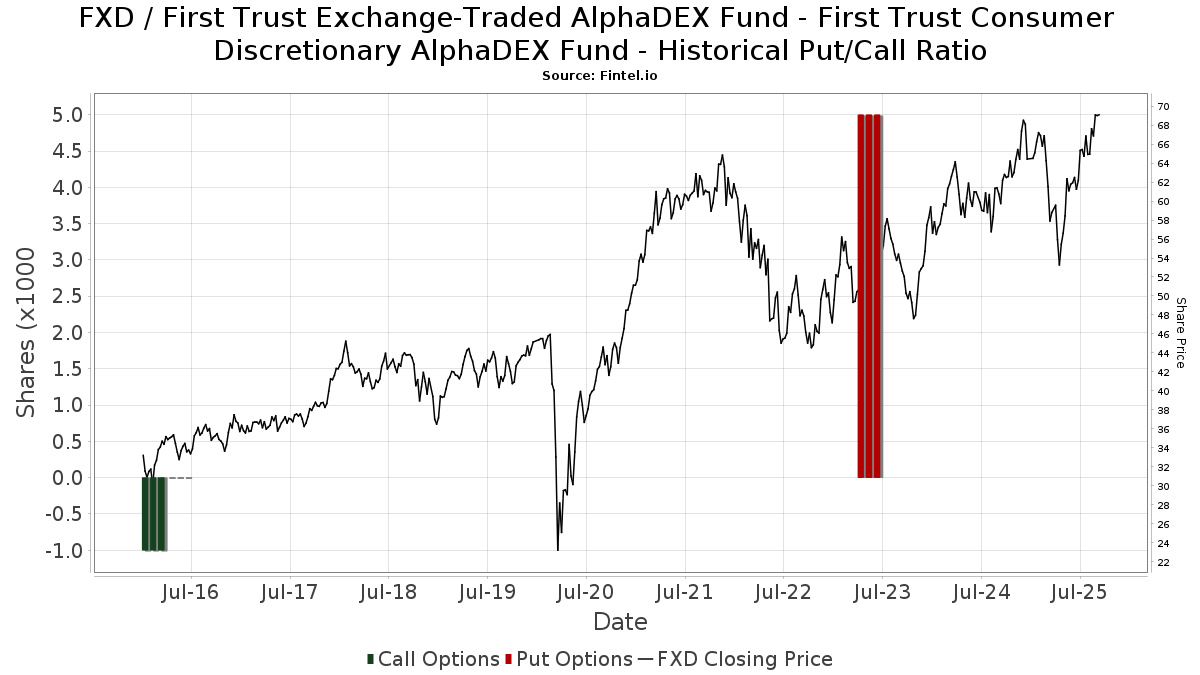
In addition to reporting standard equity and debt issues, institutions with more than 100MM assets under management must also disclose their put and call option holdings. Since put options generally indicate negative sentiment, and call options indicate positive sentiment, we can get a sense of the overall institutional sentiment by plotting the ratio of puts to calls. The chart to the right plots the historical put/call ratio for this instrument.
Using Put/Call Ratio as an indicator of investor sentiment overcomes one of the key deficiencies of using total institutional ownership, which is that a significant amount of assets under management are invested passively to track indices. Passively-managed funds do not typically buy options, so the put/call ratio indicator more closely tracks the sentiment of actively-managed funds.
13D/G Filings
We present 13D/G filings separately from the 13F filings because of the different treatement by the SEC. 13D/G filings can be filed by groups of investors (with one leading), whereas 13F filings cannot. This results in situations where an investor may file a 13D/G reporting one value for the total shares (representing all the shares owned by the investor group), but then file a 13F reporting a different value for the total shares (representing strictly their own ownership). This means that share ownership of 13D/G filings and 13F filings are oftentimes not directly comparable, so we present them separately.
Note: As of May 16, 2021, we no longer show owners that have not filed a 13D/G within the last year. Previously, we were showing the full history of 13D/G filings. In general, entities that are required to file 13D/G filings must file at least annually before submitting a closing filing. However, funds sometimes exit positions without submitting a closing filing (ie, they wind down), so displaying the full history sometimes resulted in confusion about the current ownership. To prevent confusion, we now only show ’current’ owners - that is - owners that have filed within the last year.
Upgrade to unlock premium data.
| File Date | Form | Investor | Prev Shares |
Latest Shares |
Δ Shares (Percent) |
Ownership (Percent) |
Δ Ownership (Percent) |
|
|---|---|---|---|---|---|---|---|---|
| 2025-04-07 | FIRST TRUST PORTFOLIOS LP | 12,506,030 | 882 | -99.99 | 0.01 | -99.98 |
13F and NPORT Filings
Detail on 13F filings are free. Detail on NP filings require a premium membership. Green rows indicate new positions. Red rows indicate closed positions. Click the link icon to see the full transaction history.
Upgrade
to unlock premium data and export to Excel ![]() .
.
| File Date | Source | Investor | Type | Avg Price (Est) |
Shares | Δ Shares (%) |
Reported Value ($1000) |
Δ Value (%) |
Port Alloc (%) |
|
|---|---|---|---|---|---|---|---|---|---|---|
| 2025-05-01 | 13F | Quest 10 Wealth Builders, Inc. | 64 | 0.00 | 4 | -25.00 | ||||
| 2025-07-14 | 13F | AdvisorNet Financial, Inc | 15 | 1 | ||||||
| 2025-05-14 | 13F | First Trust Advisors Lp | 0 | -100.00 | 0 | |||||
| 2025-08-14 | 13F | Paragon Private Wealth Management, LLC | 40,024 | -22.87 | 2,539 | -15.45 | ||||
| 2025-04-21 | 13F | Ronald Blue Trust, Inc. | 0 | -100.00 | 0 | -100.00 | ||||
| 2025-08-07 | 13F | Kestra Private Wealth Services, Llc | 7,030 | -13.49 | 446 | -5.32 | ||||
| 2025-07-07 | 13F | TruWealth Advisors, LLC | 3,265 | 207 | ||||||
| 2025-07-24 | 13F | Blair William & Co/il | 207 | 0.49 | 13 | 18.18 | ||||
| 2025-04-10 | 13F | Secure Asset Management, LLC | 0 | -100.00 | 0 | -100.00 | ||||
| 2025-04-16 | 13F | Tudor Financial Inc. | 0 | -100.00 | 0 | |||||
| 2025-07-08 | 13F | Nbc Securities, Inc. | 368 | -37.41 | 0 | |||||
| 2025-08-05 | 13F | NewSquare Capital LLC | 380 | 0.00 | 24 | 14.29 | ||||
| 2025-08-07 | 13F | Hughes Financial Services, LLC | 161 | 10 | ||||||
| 2025-08-11 | 13F | Aptus Capital Advisors, LLC | 283 | -12.38 | 18 | -5.56 | ||||
| 2025-05-15 | 13F | Prospera Financial Services Inc | 0 | -100.00 | 0 | |||||
| 2025-07-28 | 13F | Harbour Investments, Inc. | 766 | 0.00 | 49 | 9.09 | ||||
| 2025-08-14 | 13F | Wiley Bros.-aintree Capital, Llc | 3,780 | -23.50 | 240 | -15.55 | ||||
| 2025-04-21 | 13F | HFG Advisors, Inc. | 0 | -100.00 | 0 | |||||
| 2025-05-08 | 13F | Armis Advisers, LLC | 0 | -100.00 | 0 | |||||
| 2025-08-08 | 13F | Creative Planning | 4,717 | 299 | ||||||
| 2025-08-12 | 13F | LPL Financial LLC | 227,834 | -19.29 | 14,454 | -11.55 | ||||
| 2025-08-14 | 13F | D. E. Shaw & Co., Inc. | 9,110 | -5.78 | 578 | 3.22 | ||||
| 2025-07-31 | 13F | Topsail Wealth Management, LLC | 2,308 | -38.80 | 146 | -33.03 | ||||
| 2025-08-14 | 13F | Bank Of America Corp /de/ | 138,046 | -39.72 | 8,758 | -33.95 | ||||
| 2025-08-14 | 13F | Guardian Wealth Advisors, Llc / Nc | 283 | 0.00 | 18 | 6.25 | ||||
| 2025-08-13 | 13F | Level Four Advisory Services, Llc | 5,944 | -5.55 | 377 | 3.57 | ||||
| 2025-05-06 | 13F | Kovack Advisors, Inc. | 0 | -100.00 | 0 | |||||
| 2025-07-24 | 13F | IFP Advisors, Inc | 2,717 | 21.46 | 172 | 33.33 | ||||
| 2025-04-28 | 13F | D.a. Davidson & Co. | 0 | -100.00 | 0 | |||||
| 2025-08-04 | 13F | Pensionmark Financial Group, Llc | 0 | -100.00 | 0 | |||||
| 2025-05-12 | 13F | Independent Advisor Alliance | 0 | -100.00 | 0 | |||||
| 2025-05-12 | 13F | Claro Advisors LLC | 0 | -100.00 | 0 | |||||
| 2025-08-11 | 13F | Citigroup Inc | 200 | -99.88 | 13 | -99.88 | ||||
| 2025-09-04 | 13F/A | Advisor Group Holdings, Inc. | 42,749 | 11.30 | 2,712 | 22.00 | ||||
| 2025-07-23 | 13F | Morey & Quinn Wealth Partners, LLC | 5,028 | 0.00 | 319 | 9.28 | ||||
| 2025-08-06 | 13F | Commonwealth Equity Services, Llc | 27,892 | -62.29 | 2 | -75.00 | ||||
| 2025-08-13 | 13F | Green Harvest Asset Management LLC | 15,111 | -94.10 | 959 | -93.53 | ||||
| 2025-07-10 | 13F | Piscataqua Savings Bank | 465 | 0.00 | 29 | 11.54 | ||||
| 2025-07-22 | 13F | Coastal Investment Advisors, Inc. | 1 | 0.00 | 0 | |||||
| 2025-07-24 | 13F | Acima Private Wealth, Llc | 75 | 0.00 | 5 | 0.00 | ||||
| 2025-07-09 | 13F | Bank of New Hampshire | 0 | -100.00 | 0 | |||||
| 2025-08-11 | 13F | Principal Securities, Inc. | 565 | 0.00 | 36 | -2.78 | ||||
| 2025-08-14 | 13F | Synovus Financial Corp | 3,925 | 0.00 | 249 | 9.69 | ||||
| 2025-07-21 | 13F | Ameritas Advisory Services, LLC | 924 | 59 | ||||||
| 2025-08-12 | 13F | BlackRock, Inc. | 1,200 | 0.00 | 76 | 10.14 | ||||
| 2025-08-14 | 13F | Wells Fargo & Company/mn | 656,691 | -38.90 | 41,661 | -33.04 | ||||
| 2025-08-15 | 13F | Tower Research Capital LLC (TRC) | 35,899 | 155.13 | 2,277 | 179.73 | ||||
| 2025-08-14 | 13F | Hrt Financial Lp | 0 | -100.00 | 0 | |||||
| 2025-08-13 | 13F | Northwestern Mutual Wealth Management Co | 262 | -66.37 | 17 | -64.44 | ||||
| 2025-08-14 | 13F | Financial Advisory Service, Inc. | 578 | 0.35 | 37 | 9.09 | ||||
| 2025-07-16 | 13F | Brown, Lisle/cummings, Inc. | 35 | 0.00 | 2 | 0.00 | ||||
| 2025-05-13 | 13F | TriaGen Wealth Management LLC | 0 | -100.00 | 0 | |||||
| 2025-08-13 | 13F | StoneX Group Inc. | 3,415 | 217 | ||||||
| 2025-08-07 | 13F | Apeiron RIA LLC | 0 | -100.00 | 0 | |||||
| 2025-08-14 | 13F | Comerica Bank | 2,394 | -17.02 | 152 | -9.58 | ||||
| 2025-07-17 | 13F | Janney Montgomery Scott LLC | 96,681 | -16.61 | 6 | 0.00 | ||||
| 2025-08-01 | 13F | Envestnet Asset Management Inc | 20,359 | -77.97 | 1,292 | -75.86 | ||||
| 2025-08-14 | 13F | Raymond James Financial Inc | 226,113 | -52.00 | 14,345 | -47.40 | ||||
| 2025-07-18 | 13F | Truist Financial Corp | 45,671 | -73.82 | 2,897 | -71.31 | ||||
| 2025-08-13 | 13F | RPg Family Wealth Advisory, LLC | 10,615 | -1.39 | 673 | 8.03 | ||||
| 2025-07-31 | 13F | City State Bank | 425 | 0.00 | 27 | 8.33 | ||||
| 2025-08-13 | 13F | Jones Financial Companies Lllp | 3,411 | 39.68 | 216 | 54.29 | ||||
| 2025-07-30 | 13F | Capital Wealth Alliance, LLC | 6,192 | -4.84 | 393 | 4.26 | ||||
| 2025-08-15 | 13F | Captrust Financial Advisors | 0 | -100.00 | 0 | |||||
| 2025-08-13 | 13F | Capital Analysts, Inc. | 12 | 0 | ||||||
| 2025-08-13 | 13F | Natixis | 3,935 | -7.50 | 249 | 1.64 | ||||
| 2025-07-11 | 13F | Farther Finance Advisors, LLC | 11,034 | -0.03 | 700 | 8.71 | ||||
| 2025-07-28 | 13F | BRYN MAWR TRUST Co | 260 | 0.00 | 16 | 6.67 | ||||
| 2025-08-14 | 13F | Millennium Management Llc | 0 | -100.00 | 0 | |||||
| 2025-08-14 | 13F | IHT Wealth Management, LLC | 7,537 | -0.46 | 478 | 9.13 | ||||
| 2025-08-14 | 13F | Old Mission Capital Llc | 0 | -100.00 | 0 | |||||
| 2025-07-29 | 13F | Private Trust Co Na | 180 | -53.49 | 11 | -50.00 | ||||
| 2025-08-01 | 13F | Bessemer Group Inc | 0 | -100.00 | 0 | |||||
| 2025-07-14 | 13F | GAMMA Investing LLC | 269 | 17 | ||||||
| 2025-05-06 | 13F | Ignite Planners, LLC | 0 | -100.00 | 0 | -100.00 | ||||
| 2025-07-31 | 13F | Nilsine Partners, LLC | 27,357 | 0.48 | 1,736 | 10.09 | ||||
| 2025-08-14 | 13F | Citadel Advisors Llc | 37,513 | -34.78 | 2,380 | -28.54 | ||||
| 2025-08-08 | 13F | POM Investment Strategies, LLC | 17 | 0.00 | 1 | |||||
| 2025-07-16 | 13F/A | CX Institutional | 3,079 | -89.85 | 0 | -100.00 | ||||
| 2025-08-14 | 13F | Goldman Sachs Group Inc | 80,054 | -9.62 | 5,079 | -0.96 | ||||
| 2025-08-13 | 13F | Transce3nd, LLC | 104 | 0.00 | 7 | 0.00 | ||||
| 2025-08-14 | 13F | Royal Bank Of Canada | 41,008 | -71.09 | 2,602 | -68.32 | ||||
| 2025-08-18 | 13F | Geneos Wealth Management Inc. | 211 | 0.00 | 13 | 8.33 | ||||
| 2025-08-12 | 13F | Global Retirement Partners, LLC | 132 | -28.65 | 8 | -27.27 | ||||
| 2025-07-07 | 13F | Nova Wealth Management, Inc. | 85 | 0.00 | 5 | 25.00 | ||||
| 2025-08-18 | 13F/A | National Bank Of Canada /fi/ | 550 | 0.00 | 35 | 9.68 | ||||
| 2025-07-31 | 13F | Leelyn Smith, LLC | 0 | -100.00 | 0 | |||||
| 2025-08-12 | 13F | Proequities, Inc. | 0 | 0 | ||||||
| 2025-05-01 | 13F | Harmony Asset Management Llc | 0 | -100.00 | 0 | |||||
| 2025-07-24 | 13F | Us Bancorp \de\ | 219 | -11.34 | 14 | -7.14 | ||||
| 2025-08-13 | 13F | Keystone Financial Group | 0 | -100.00 | 0 | |||||
| 2025-08-13 | 13F | Russell Investments Group, Ltd. | 175 | 0.00 | 11 | 10.00 | ||||
| 2025-07-07 | 13F | Thurston, Springer, Miller, Herd & Titak, Inc. | 48 | 3 | ||||||
| 2025-08-07 | 13F | Allworth Financial LP | 808 | -1.70 | 51 | 10.87 | ||||
| 2025-08-14 | 13F | Mpwm Advisory Solutions, Llc | 20 | 1 | ||||||
| 2025-04-22 | 13F | Minichmacgregor Wealth Management, Llc | 0 | -100.00 | 0 | |||||
| 2025-04-23 | 13F | Proactive Wealth Strategies LLC | 0 | -100.00 | 0 | |||||
| 2025-08-11 | 13F | HighTower Advisors, LLC | 14,890 | -44.06 | 945 | -38.70 | ||||
| 2025-08-13 | 13F | WCG Wealth Advisors LLC | 0 | -100.00 | 0 | |||||
| 2025-08-14 | 13F | Transamerica Financial Advisors, Inc. | 142 | 0.00 | 9 | |||||
| 2025-08-14 | 13F | Fmr Llc | 1,021 | 6.13 | 65 | 16.36 | ||||
| 2025-08-13 | 13F | Baird Financial Group, Inc. | 18,755 | -35.73 | 1,190 | -29.60 | ||||
| 2025-04-21 | 13F | O'Dell Group, LLC | 0 | -100.00 | 0 | |||||
| 2025-07-08 | 13F | Atwood & Palmer Inc | 545 | 0.00 | 35 | 9.68 | ||||
| 2025-08-14 | 13F | Two Sigma Securities, Llc | 4,179 | -64.55 | 265 | -61.14 | ||||
| 2025-05-14 | 13F | Rockefeller Capital Management L.P. | 0 | -100.00 | 0 | |||||
| 2025-08-07 | 13F | PFG Advisors | 0 | -100.00 | 0 | |||||
| 2025-08-14 | 13F | CoreCap Advisors, LLC | 3,094 | -4.89 | 196 | 4.26 | ||||
| 2025-08-12 | 13F | Jpmorgan Chase & Co | 58,988 | 171.82 | 3,742 | 197.93 | ||||
| 2025-04-15 | 13F | Davis Investment Partners, LLC | 0 | -100.00 | 0 | |||||
| 2025-08-12 | 13F | MAI Capital Management | 5,857 | -15.30 | 372 | -7.25 | ||||
| 2025-08-19 | 13F | Newbridge Financial Services Group, Inc. | 315 | 0.00 | 20 | 5.56 | ||||
| 2025-07-21 | 13F | DHJJ Financial Advisors, Ltd. | 5 | 0.00 | 0 | |||||
| 2025-07-31 | 13F | Oppenheimer & Co Inc | 4,322 | -0.94 | 274 | 8.73 | ||||
| 2025-05-06 | 13F | Atria Investments Llc | 0 | -100.00 | 0 | |||||
| 2025-08-06 | 13F | AE Wealth Management LLC | 403 | 0.00 | 26 | 8.70 | ||||
| 2025-08-14 | 13F | GWM Advisors LLC | 12,564 | -49.94 | 797 | -45.11 | ||||
| 2025-08-14 | 13F | Ameriprise Financial Inc | 39,495 | -40.73 | 2,506 | -35.82 | ||||
| 2025-07-23 | 13F | REAP Financial Group, LLC | 1,597 | -38.00 | 101 | -32.21 | ||||
| 2025-08-14 | 13F | Susquehanna International Group, Llp | 45,094 | -97.95 | 2,861 | -97.76 | ||||
| 2025-08-14 | 13F | UBS Group AG | 59,671 | -44.47 | 3,786 | -39.15 | ||||
| 2025-04-30 | 13F | TradeWell Securities, LLC. | 21,279 | 7.84 | 1,232 | -3.45 | ||||
| 2025-08-08 | 13F | MTM Investment Management, LLC | 8,683 | -6.85 | 551 | 1.29 | ||||
| 2025-07-21 | 13F | Creative Capital Management Investments LLC | 400 | 25 | ||||||
| 2025-07-08 | 13F | Ballew Advisors, Inc | 3,632 | 238 | ||||||
| 2025-08-11 | 13F | Private Advisor Group, LLC | 11,761 | -7.38 | 746 | 1.50 | ||||
| 2025-07-29 | 13F | Stephens Inc /ar/ | 13,667 | 0.00 | 867 | 9.61 | ||||
| 2025-07-17 | 13F | Elser Financial Planning, Inc | 8,000 | 516 | ||||||
| 2025-08-12 | 13F | Park Square Financial Group, LLC | 134 | 0.00 | 9 | 14.29 | ||||
| 2025-08-08 | 13F | Pnc Financial Services Group, Inc. | 6,615 | -15.66 | 420 | -7.71 | ||||
| 2025-08-12 | 13F | Steward Partners Investment Advisory, Llc | 6,740 | -19.31 | 428 | -11.59 | ||||
| 2025-05-01 | 13F | Gateway Wealth Partners, LLC | 0 | -100.00 | 0 | |||||
| 2025-07-30 | 13F | Retirement Planning Group | 10,237 | 164.86 | 649 | 191.03 | ||||
| 2025-07-29 | 13F | Cottonwood Capital Advisors, Llc | 21,966 | -0.31 | 1,394 | 9.25 | ||||
| 2025-08-15 | 13F | Morgan Stanley | 497,522 | -51.29 | 31,563 | -46.63 | ||||
| 2025-07-16 | 13F | Signaturefd, Llc | 400 | 0.00 | 25 | 8.70 | ||||
| 2025-05-14 | 13F | Jane Street Group, Llc | 0 | -100.00 | 0 | |||||
| 2025-07-31 | 13F | Cambridge Investment Research Advisors, Inc. | 155,176 | 474.26 | 10 | 800.00 | ||||
| 2025-08-20 | 13F/A | Coppell Advisory Solutions LLC | 12,029 | 0.00 | 762 | 11.58 | ||||
| 2025-08-04 | 13F | Spire Wealth Management | 9 | -99.93 | 1 | -100.00 | ||||
| 2025-08-13 | 13F | Quadrature Capital Ltd | 3,869 | 245 | ||||||
| 2025-08-14 | 13F | Snowden Capital Advisors LLC | 4,123 | -17.54 | 262 | -9.69 | ||||
| 2025-08-15 | 13F | Kestra Advisory Services, LLC | 13,809 | 63.48 | 876 | 79.51 | ||||
| 2025-08-12 | 13F | Founders Financial Alliance, LLC | 2,291 | -24.89 | 145 | -17.61 | ||||
| 2025-07-29 | 13F | International Assets Investment Management, Llc | 3,313 | 210 | ||||||
| 2025-07-25 | 13F | Sequoia Financial Advisors, LLC | 8,073 | 0.00 | 512 | 9.64 | ||||
| 2025-08-12 | 13F | SRS Capital Advisors, Inc. | 73 | 5 | ||||||
| 2025-08-14 | 13F | Smartleaf Asset Management LLC | 216 | 0.00 | 14 | 8.33 | ||||
| 2025-07-28 | 13F | Kiker Wealth Management, LLC | 15 | -77.27 | 1 | -100.00 | ||||
| 2025-08-08 | 13F | Cetera Investment Advisers | 21,063 | -30.81 | 1,336 | -24.18 | ||||
| 2025-07-24 | 13F | Cyndeo Wealth Partners, LLC | 0 | -100.00 | 0 | |||||
| 2025-08-14 | 13F | Verition Fund Management LLC | 0 | -100.00 | 0 | |||||
| 2025-08-19 | 13F | Advisory Services Network, LLC | 0 | -100.00 | 0 | |||||
| 2025-08-14 | 13F | Mml Investors Services, Llc | 13,328 | -42.57 | 1 | -100.00 | ||||
| 2025-08-08 | 13F | Gts Securities Llc | 0 | -100.00 | 0 | |||||
| 2025-08-14 | 13F | Qube Research & Technologies Ltd | 24,355 | -12.84 | 1,545 | -4.45 | ||||
| 2025-07-22 | 13F | Mascoma Wealth Management LLC | 177 | 0.00 | 11 | 10.00 | ||||
| 2025-08-06 | 13F | Vestmark Advisory Solutions, Inc. | 0 | -100.00 | 0 | |||||
| 2025-08-14 | 13F | Bnp Paribas Arbitrage, Sa | 50,000 | 3,172 | ||||||
| 2025-08-14 | 13F | Stifel Financial Corp | 83,278 | -27.56 | 5,283 | -20.62 | ||||
| 2025-08-13 | 13F | Flow Traders U.s. Llc | 15,760 | -51.61 | 1 | 0.00 | ||||
| 2025-07-29 | 13F | Stratos Wealth Partners, LTD. | 4,085 | 0.07 | 259 | 9.75 | ||||
| 2025-04-17 | 13F | Kennicott Capital Management Llc | 0 | -100.00 | 0 | |||||
| 2025-04-15 | 13F | Trust Co Of Oklahoma | 0 | -100.00 | 0 | |||||
| 2025-07-23 | 13F | Schrum Private Wealth Management LLC | 14,506 | 0.00 | 920 | 9.65 | ||||
| 2025-05-08 | 13F | We Are One Seven, LLC | 0 | -100.00 | 0 | |||||
| 2025-05-06 | 13F | Navellier & Associates Inc | 0 | -100.00 | 0 | |||||
| 2025-07-25 | 13F | Cwm, Llc | 1,098 | -98.12 | 0 | -100.00 | ||||
| 2025-08-14 | 13F | Benjamin Edwards Inc | 0 | -100.00 | 0 |
Other Listings
| MX:FXD |