Basic Stats
| Institutional Owners | 61 total, 61 long only, 0 short only, 0 long/short - change of -10.29% MRQ |
| Average Portfolio Allocation | 0.0427 % - change of -2.17% MRQ |
| Institutional Shares (Long) | 4,002,825 (ex 13D/G) - change of -0.41MM shares -9.23% MRQ |
| Institutional Value (Long) | $ 47,676 USD ($1000) |
Institutional Ownership and Shareholders
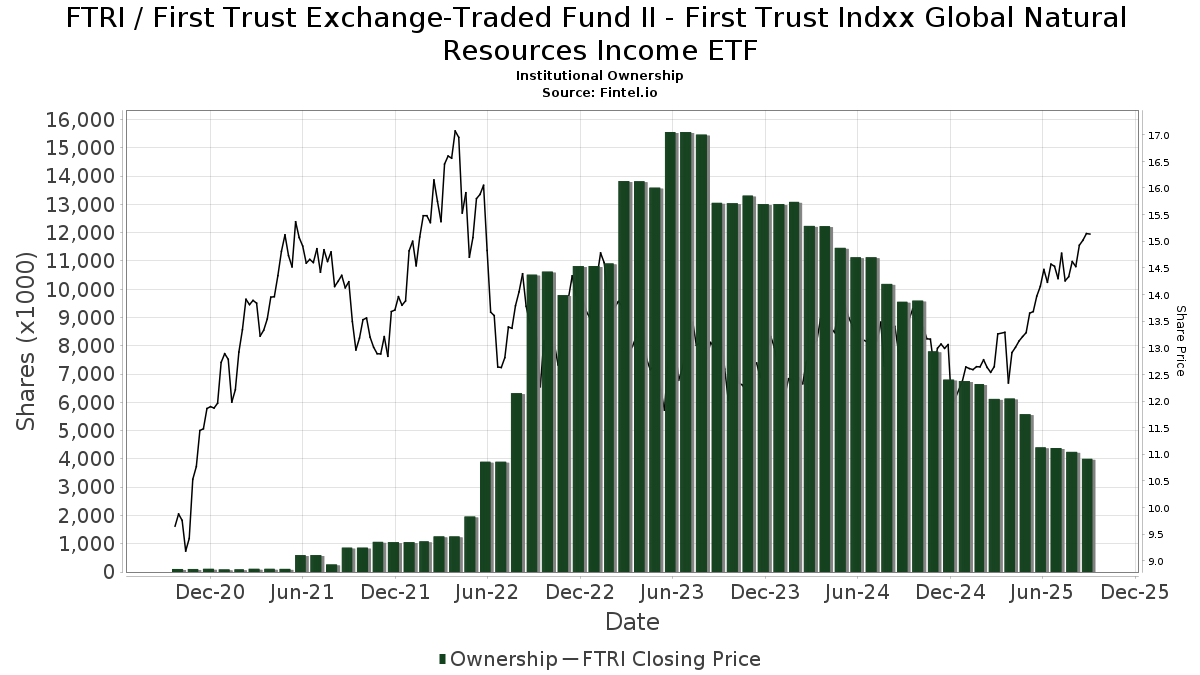
First Trust Exchange-Traded Fund II - First Trust Indxx Global Natural Resources Income ETF (US:FTRI) has 61 institutional owners and shareholders that have filed 13D/G or 13F forms with the Securities Exchange Commission (SEC). These institutions hold a total of 4,002,825 shares. Largest shareholders include LPL Financial LLC, Royal Bank Of Canada, Cambridge Investment Research Advisors, Inc., Park National Corp /oh/, Morgan Stanley, Commonwealth Equity Services, Llc, Cetera Investment Advisers, Bank Of America Corp /de/, Envestnet Asset Management Inc, and Flow Traders U.s. Llc .
First Trust Exchange-Traded Fund II - First Trust Indxx Global Natural Resources Income ETF (NasdaqGM:FTRI) institutional ownership structure shows current positions in the company by institutions and funds, as well as latest changes in position size. Major shareholders can include individual investors, mutual funds, hedge funds, or institutions. The Schedule 13D indicates that the investor holds (or held) more than 5% of the company and intends (or intended) to actively pursue a change in business strategy. Schedule 13G indicates a passive investment of over 5%.
The share price as of September 5, 2025 is 15.18 / share. Previously, on September 6, 2024, the share price was 12.66 / share. This represents an increase of 19.90% over that period.
Fund Sentiment Score
The Fund Sentiment Score (fka Ownership Accumulation Score) finds the stocks that are being most bought by funds. It is the result of a sophisticated, multi-factor quantitative model that identifies companies with the highest levels of institutional accumulation. The scoring model uses a combination of the total increase in disclosed owners, the changes in portfolio allocations in those owners and other metrics. The number ranges from 0 to 100, with higher numbers indicating a higher level of accumulation to its peers, and 50 being the average.
Update Frequency: Daily
See Ownership Explorer, which provides a list of highest-ranking companies.
Institutional Put/Call Ratio
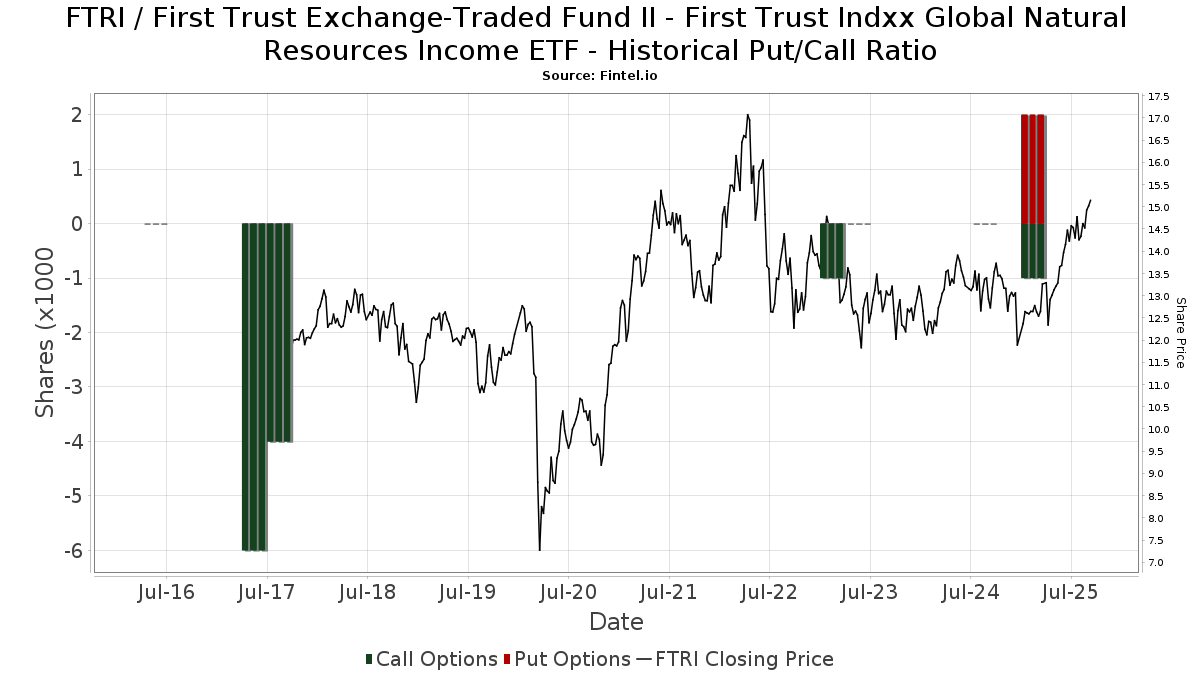
In addition to reporting standard equity and debt issues, institutions with more than 100MM assets under management must also disclose their put and call option holdings. Since put options generally indicate negative sentiment, and call options indicate positive sentiment, we can get a sense of the overall institutional sentiment by plotting the ratio of puts to calls. The chart to the right plots the historical put/call ratio for this instrument.
Using Put/Call Ratio as an indicator of investor sentiment overcomes one of the key deficiencies of using total institutional ownership, which is that a significant amount of assets under management are invested passively to track indices. Passively-managed funds do not typically buy options, so the put/call ratio indicator more closely tracks the sentiment of actively-managed funds.
13F and NPORT Filings
Detail on 13F filings are free. Detail on NP filings require a premium membership. Green rows indicate new positions. Red rows indicate closed positions. Click the link icon to see the full transaction history.
Upgrade
to unlock premium data and export to Excel ![]() .
.
| File Date | Source | Investor | Type | Avg Price (Est) |
Shares | Δ Shares (%) |
Reported Value ($1000) |
Δ Value (%) |
Port Alloc (%) |
|
|---|---|---|---|---|---|---|---|---|---|---|
| 2025-07-24 | 13F | Us Bancorp \de\ | 540 | 0.00 | 8 | 0.00 | ||||
| 2025-08-14 | 13F | Jane Street Group, Llc | 42,626 | 80.27 | 607 | 93.61 | ||||
| 2025-07-21 | 13F | DHJJ Financial Advisors, Ltd. | 16 | 0.00 | 0 | |||||
| 2025-07-01 | 13F | Park National Corp /oh/ | 299,010 | -7.62 | 4,255 | -0.72 | ||||
| 2025-08-14 | 13F | Comerica Bank | 0 | -100.00 | 0 | |||||
| 2025-07-22 | 13F | Global Assets Advisory, LLC | 0 | -100.00 | 0 | |||||
| 2025-07-14 | 13F | AdvisorNet Financial, Inc | 0 | -100.00 | 0 | |||||
| 2025-08-14 | 13F | Treasure Coast Financial Planning | 26,425 | -0.17 | 376 | 7.43 | ||||
| 2025-08-06 | 13F | Walkner Condon Financial Advisors LLC | 19,180 | 9.29 | 273 | 17.24 | ||||
| 2025-08-07 | 13F | PCG Wealth Advisors, LLC | 80,182 | -7.83 | 1,141 | -0.96 | ||||
| 2025-07-11 | 13F | Quad-Cities Investment Group, LLC | 18,365 | -33.02 | 261 | -28.10 | ||||
| 2025-08-15 | 13F | Fsb Premier Wealth Management, Inc. | 12,153 | 0.00 | 173 | 7.50 | ||||
| 2025-08-12 | 13F | MAI Capital Management | 721 | 0.00 | 10 | 11.11 | ||||
| 2025-08-15 | 13F | Morgan Stanley | 169,333 | -66.46 | 2,410 | -63.95 | ||||
| 2025-07-21 | 13F | Ameriflex Group, Inc. | 0 | -100.00 | 0 | |||||
| 2025-08-12 | 13F | LPL Financial LLC | 812,004 | 1.61 | 11,555 | 9.20 | ||||
| 2025-08-13 | 13F | Flow Traders U.s. Llc | 86,297 | 37.52 | 1 | |||||
| 2025-05-13 | 13F | Steward Partners Investment Advisory, Llc | 0 | -100.00 | 0 | |||||
| 2025-07-23 | 13F | REAP Financial Group, LLC | 23,919 | 0.37 | 340 | 7.94 | ||||
| 2025-08-14 | 13F | Citadel Advisors Llc | 0 | -100.00 | 0 | |||||
| 2025-05-05 | 13F | Peterson Wealth Services | 0 | -100.00 | 0 | |||||
| 2025-07-28 | 13F | RFG Advisory, LLC | 10,946 | 0.45 | 156 | 7.64 | ||||
| 2025-05-02 | 13F | Sigma Planning Corp | 0 | -100.00 | 0 | |||||
| 2025-08-14 | 13F | Bank Of America Corp /de/ | 105,736 | 2.50 | 1,505 | 10.18 | ||||
| 2025-07-11 | 13F | Pinnacle Bancorp, Inc. | 0 | -100.00 | 0 | |||||
| 2025-08-13 | 13F | Holos Integrated Wealth LLC | 18,672 | -33.69 | 269 | -27.69 | ||||
| 2025-08-14 | 13F | Royal Bank Of Canada | 600,872 | 85.27 | 8,550 | 99.12 | ||||
| 2025-08-11 | 13F | Principal Securities, Inc. | 17,843 | 2.29 | 254 | 21.05 | ||||
| 2025-08-06 | 13F | Golden State Wealth Management, LLC | 1,091 | 0.00 | 16 | 7.14 | ||||
| 2025-08-06 | 13F | Commonwealth Equity Services, Llc | 136,390 | -12.07 | 2 | -50.00 | ||||
| 2025-07-07 | 13F | Investors Research Corp | 0 | -100.00 | 0 | -100.00 | ||||
| 2025-07-02 | 13F | Crumly & Associates Inc. | 17,466 | 249 | ||||||
| 2025-08-13 | 13F | Virtue Capital Management, LLC | 0 | -100.00 | 0 | |||||
| 2025-04-01 | 13F | Massmutual Trust Co Fsb/adv | 0 | -100.00 | 0 | |||||
| 2025-04-17 | 13F | Janney Montgomery Scott LLC | 0 | -100.00 | 0 | |||||
| 2025-07-24 | 13F | Columbia Advisory Partners Llc | 25,341 | -4.88 | 361 | 2.27 | ||||
| 2025-07-29 | 13F | Koshinski Asset Management, Inc. | 25,128 | -3.33 | 358 | 3.78 | ||||
| 2025-08-13 | 13F | Lauer Wealth, LLC | 32,200 | 463 | ||||||
| 2025-08-14 | 13F | Ancora Advisors, LLC | 313 | 0.00 | 4 | 0.00 | ||||
| 2025-08-14 | 13F/A | Rockefeller Capital Management L.P. | 26,449 | 43.38 | 376 | 54.10 | ||||
| 2025-09-04 | 13F/A | Advisor Group Holdings, Inc. | 33,485 | -15.98 | 477 | -9.68 | ||||
| 2025-07-10 | 13F | Piscataqua Savings Bank | 230 | 0.00 | 3 | 0.00 | ||||
| 2025-07-16 | 13F | Independent Wealth Network Inc. | 14,646 | -3.70 | 208 | 3.48 | ||||
| 2025-07-31 | 13F | Cambridge Investment Research Advisors, Inc. | 409,402 | -8.24 | 6 | 0.00 | ||||
| 2025-08-14 | 13F | UBS Group AG | 67,136 | 21.86 | 955 | 31.00 | ||||
| 2025-08-14 | 13F | Susquehanna International Group, Llp | 85,384 | 397.87 | 1,215 | 435.24 | ||||
| 2025-08-12 | 13F | SRS Capital Advisors, Inc. | 3,250 | -11.06 | 46 | -4.17 | ||||
| 2025-05-14 | 13F | Van Hulzen Asset Management, LLC | 0 | -100.00 | 0 | |||||
| 2025-08-13 | 13F | Twin Peaks Wealth Advisors, LLC | 1,000 | 14 | ||||||
| 2025-08-08 | 13F | Cetera Investment Advisers | 122,691 | -1.11 | 1,746 | 6.27 | ||||
| 2025-08-06 | 13F | AE Wealth Management LLC | 10,077 | -2.00 | 143 | 5.15 | ||||
| 2025-08-13 | 13F | Northwestern Mutual Wealth Management Co | 1,789 | 25 | ||||||
| 2025-07-21 | 13F | Ameritas Advisory Services, LLC | 9,481 | -16.14 | 135 | -3.60 | ||||
| 2025-08-14 | 13F | Citadel Advisors Llc | Call | 0 | -100.00 | 0 | ||||
| 2025-08-14 | 13F | Citadel Advisors Llc | Put | 0 | -100.00 | 0 | ||||
| 2025-07-10 | 13F | Wealth Enhancement Advisory Services, Llc | 15,169 | 0.00 | 221 | 10.00 | ||||
| 2025-07-15 | 13F | Armis Advisers, LLC | 23,919 | 0.37 | 340 | 7.94 | ||||
| 2025-08-14 | 13F | Mml Investors Services, Llc | 16,640 | -1.26 | 0 | |||||
| 2025-05-12 | 13F | Aveo Capital Partners, LLC | 0 | -100.00 | 0 | |||||
| 2025-08-14 | 13F | Old Mission Capital Llc | 78,720 | -26.82 | 1,120 | -21.35 | ||||
| 2025-07-10 | 13F | Security National Bank | 396 | 0.00 | 6 | 0.00 | ||||
| 2025-08-14 | 13F | Financial Advisory Service, Inc. | 34 | 0 | ||||||
| 2025-07-30 | 13F | D.a. Davidson & Co. | 69,330 | 8.00 | 987 | 16.14 | ||||
| 2025-04-10 | 13F | Accel Wealth Management | 0 | -100.00 | 0 | -100.00 | ||||
| 2025-08-01 | 13F | Envestnet Asset Management Inc | 92,268 | -32.04 | 1,313 | -26.99 | ||||
| 2025-07-10 | 13F | Focus Financial Network, Inc. | 18,255 | -10.18 | 260 | -3.72 | ||||
| 2025-08-04 | 13F | Waterfront Wealth Inc. | 12,800 | -0.31 | 182 | 7.06 | ||||
| 2025-07-24 | 13F | Monument Capital Management | 40,242 | -15.53 | 573 | -9.21 | ||||
| 2025-07-25 | 13F | Cwm, Llc | 2,722 | 0.00 | 0 | |||||
| 2025-08-12 | 13F | Proequities, Inc. | 0 | 0 | ||||||
| 2025-08-13 | 13F | Capital Analysts, Inc. | 400 | 0.00 | 0 | |||||
| 2025-08-14 | 13F | Aft, Forsyth & Sober, LLC | 0 | -100.00 | 0 | |||||
| 2025-08-14 | 13F | Wells Fargo & Company/mn | 1 | 0 | ||||||
| 2025-08-14 | 13F | Stifel Financial Corp | 30,147 | -8.63 | 429 | -1.83 | ||||
| 2025-08-14 | 13F | Raymond James Financial Inc | 61,973 | -12.24 | 882 | -5.67 | ||||
| 2025-08-12 | 13F | Change Path, LLC | 12,404 | -72.60 | 177 | -70.62 | ||||
| 2025-05-16 | 13F/A | Kestra Investment Management, LLC | 0 | -100.00 | 0 | |||||
| 2025-08-13 | 13F/A | StoneX Group Inc. | 0 | -100.00 | 0 | -100.00 | ||||
| 2025-08-14 | 13F | Marshall Investment Management, Llc | 0 | -100.00 | 0 | |||||
| 2025-07-28 | 13F | Harbour Investments, Inc. | 17,248 | -11.43 | 245 | -4.67 | ||||
| 2025-08-14 | 13F | Modern Wealth Management, LLC | 47,423 | 7.24 | 675 | 15.21 | ||||
| 2025-08-19 | 13F | National Asset Management, Inc. | 0 | -100.00 | 0 | |||||
| 2025-05-14 | 13F | Stonehage Fleming Financial Services Holdings Ltd | 0 | -100.00 | 0 | |||||
| 2025-07-16 | 13F | Cambridge Advisors Inc. | 18,555 | 0.26 | 264 | 7.76 | ||||
| 2025-07-25 | 13F | Atria Wealth Solutions, Inc. | 25,873 | 23.82 | 368 | 33.33 | ||||
| 2025-08-12 | 13F | Global Retirement Partners, LLC | 0 | -100.00 | 0 | |||||
| 2025-08-15 | 13F | Kestra Advisory Services, LLC | 50,517 | 1.81 | 719 | 9.45 | ||||
| 2025-04-10 | 13F | Clarus Wealth Advisors | 0 | -100.00 | 0 |