Basic Stats
| Institutional Owners | 160 total, 160 long only, 0 short only, 0 long/short - change of 13.48% MRQ |
| Average Portfolio Allocation | 0.5886 % - change of 15.12% MRQ |
| Institutional Shares (Long) | 20,596,679 (ex 13D/G) - change of 4.32MM shares 26.51% MRQ |
| Institutional Value (Long) | $ 793,188 USD ($1000) |
Institutional Ownership and Shareholders
EA Series Trust - Freedom 100 Emerging Markets ETF (US:FRDM) has 160 institutional owners and shareholders that have filed 13D/G or 13F forms with the Securities Exchange Commission (SEC). These institutions hold a total of 20,596,679 shares. Largest shareholders include Retirement Planning Group, Northwestern Mutual Wealth Management Co, Wells Fargo & Company/mn, Ellevest, Inc., Tanglewood Wealth Management, Inc., Willis Johnson & Associates, Inc., Aptus Capital Advisors, LLC, Guardian Wealth Advisors, Llc / Nc, Coyle Financial Counsel LLC, and Kathmere Capital Management, LLC .
EA Series Trust - Freedom 100 Emerging Markets ETF (BATS:FRDM) institutional ownership structure shows current positions in the company by institutions and funds, as well as latest changes in position size. Major shareholders can include individual investors, mutual funds, hedge funds, or institutions. The Schedule 13D indicates that the investor holds (or held) more than 5% of the company and intends (or intended) to actively pursue a change in business strategy. Schedule 13G indicates a passive investment of over 5%.
The share price as of September 5, 2025 is 42.58 / share. Previously, on September 9, 2024, the share price was 34.22 / share. This represents an increase of 24.43% over that period.

Fund Sentiment Score
The Fund Sentiment Score (fka Ownership Accumulation Score) finds the stocks that are being most bought by funds. It is the result of a sophisticated, multi-factor quantitative model that identifies companies with the highest levels of institutional accumulation. The scoring model uses a combination of the total increase in disclosed owners, the changes in portfolio allocations in those owners and other metrics. The number ranges from 0 to 100, with higher numbers indicating a higher level of accumulation to its peers, and 50 being the average.
Update Frequency: Daily
See Ownership Explorer, which provides a list of highest-ranking companies.
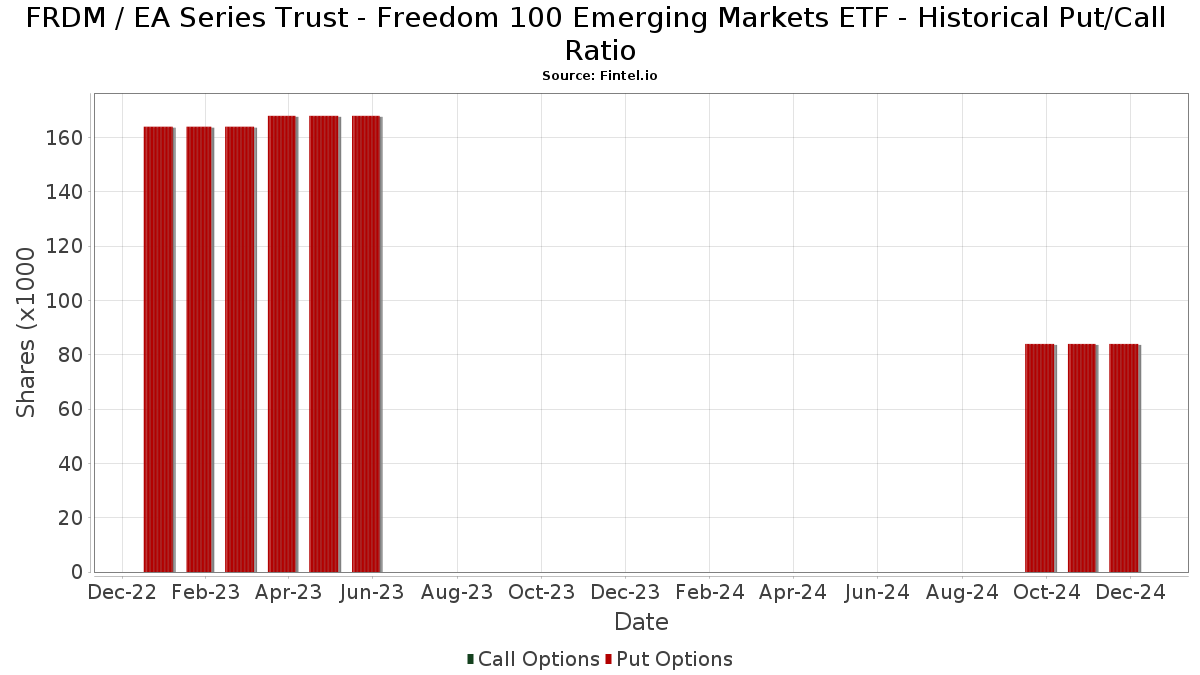
Institutional Put/Call Ratio
In addition to reporting standard equity and debt issues, institutions with more than 100MM assets under management must also disclose their put and call option holdings. Since put options generally indicate negative sentiment, and call options indicate positive sentiment, we can get a sense of the overall institutional sentiment by plotting the ratio of puts to calls. The chart to the right plots the historical put/call ratio for this instrument.
Using Put/Call Ratio as an indicator of investor sentiment overcomes one of the key deficiencies of using total institutional ownership, which is that a significant amount of assets under management are invested passively to track indices. Passively-managed funds do not typically buy options, so the put/call ratio indicator more closely tracks the sentiment of actively-managed funds.
13F and NPORT Filings
Detail on 13F filings are free. Detail on NP filings require a premium membership. Green rows indicate new positions. Red rows indicate closed positions. Click the link icon to see the full transaction history.
Upgrade
to unlock premium data and export to Excel ![]() .
.
| File Date | Source | Investor | Type | Avg Price (Est) |
Shares | Δ Shares (%) |
Reported Value ($1000) |
Δ Value (%) |
Port Alloc (%) |
|
|---|---|---|---|---|---|---|---|---|---|---|
| 2025-07-23 | 13F | Lansing Street Advisors | 37,230 | 25.76 | 1,504 | 45.03 | ||||
| 2025-08-06 | 13F | Ethos Financial Group, LLC | 51,537 | 74.11 | 2,082 | 115.31 | ||||
| 2025-08-13 | 13F | Millstone Evans Group, LLC | 634 | 0.32 | 26 | 13.64 | ||||
| 2025-08-13 | 13F | WCG Wealth Advisors LLC | 174,390 | -21.80 | 7,045 | -9.88 | ||||
| 2025-08-14 | 13F | Susquehanna International Group, Llp | 30,620 | 1,237 | ||||||
| 2025-08-07 | 13F | Mayport, Llc | 265,391 | 6.57 | 10,722 | 22.83 | ||||
| 2025-08-08 | 13F | Smithfield Trust Co | 1,328 | 0.00 | 0 | |||||
| 2025-07-25 | 13F | Commonwealth Financial Services, LLC | 259,753 | 0.84 | 10,494 | 16.24 | ||||
| 2025-07-30 | 13F | Brookstone Capital Management | 5,164 | -46.29 | 209 | -38.28 | ||||
| 2025-08-14 | 13F | Financial Network Wealth Advisors LLC | 2,119 | -32.06 | 86 | -22.02 | ||||
| 2025-07-24 | 13F | Us Bancorp \de\ | 3,858 | 21.59 | 156 | 39.64 | ||||
| 2025-08-14 | 13F | Raymond James Financial Inc | 454,117 | 16.51 | 18,346 | 34.29 | ||||
| 2025-08-07 | 13F | Sierra Ocean, Llc | 1,600 | 65 | ||||||
| 2025-07-17 | 13F | XY Planning Network, Inc. | 8,801 | 356 | ||||||
| 2025-08-13 | 13F | Jones Financial Companies Lllp | 25,396 | 157.30 | 1,019 | 194.51 | ||||
| 2025-04-25 | 13F | Smallwood Wealth Investment Management, LLC | 113,884 | 3.65 | 3,992 | 11.17 | ||||
| 2025-07-11 | 13F | Farther Finance Advisors, LLC | 236 | 293.33 | 10 | 350.00 | ||||
| 2025-08-14 | 13F | Guardian Wealth Advisors, Llc / Nc | 622,371 | 83.09 | 25,144 | 110.63 | ||||
| 2025-07-16 | 13F | Beaumont Financial Advisors, LLC | 220,075 | 14.20 | 8,891 | 31.64 | ||||
| 2025-08-14 | 13F | Mercer Global Advisors Inc /adv | 12,109 | -41.94 | 489 | -33.11 | ||||
| 2025-07-10 | 13F | Signal Advisors Wealth, LLC | 85,799 | 57.61 | 3,466 | 81.66 | ||||
| 2025-07-08 | 13F | Parallel Advisors, LLC | 5,317 | 0.00 | 215 | 15.05 | ||||
| 2025-08-12 | 13F | O'shaughnessy Asset Management, Llc | 935 | 3.89 | 38 | 19.35 | ||||
| 2025-03-12 | 13F/A | Private Capital Management Llc | 12,295 | 434 | ||||||
| 2025-08-11 | 13F | Citigroup Inc | 7,971 | 322 | ||||||
| 2025-07-10 | 13F | Redhawk Wealth Advisors, Inc. | 8,046 | 4.47 | 325 | 20.82 | ||||
| 2025-08-08 | 13F | Foundations Investment Advisors, LLC | 87,706 | 11.90 | 3,543 | 28.98 | ||||
| 2025-05-15 | 13F | Gts Securities Llc | 0 | -100.00 | 0 | |||||
| 2025-07-28 | 13F | Harbour Investments, Inc. | 1,920 | 1.64 | 78 | 16.67 | ||||
| 2025-08-14 | 13F | Fmr Llc | 1,304 | -22.79 | 53 | -11.86 | ||||
| 2025-07-29 | 13F | Angeles Wealth Management, Llc | 30,072 | 1,215 | ||||||
| 2025-08-07 | 13F | 1620 Investment Advisors, Inc. | 62,574 | 4.01 | 2,528 | 19.88 | ||||
| 2025-08-14 | 13F | UBS Group AG | 813 | 33 | ||||||
| 2025-08-08 | 13F | Larson Financial Group LLC | 86 | -86.11 | 3 | -85.71 | ||||
| 2025-07-17 | 13F | Sound Income Strategies, LLC | 1 | 0 | ||||||
| 2025-07-21 | 13F | Tanglewood Wealth Management, Inc. | 1,107,772 | 48.58 | 44,754 | 71.24 | ||||
| 2025-07-30 | 13F | Strategic Blueprint, LLC | 0 | -100.00 | 0 | |||||
| 2025-07-23 | 13F | Quarry Hill Advisors, Llc | 134,479 | -1.85 | 5,433 | 13.12 | ||||
| 2025-08-06 | 13F | Prospera Financial Services Inc | 24,986 | 1,009 | ||||||
| 2025-08-07 | 13F | Resources Investment Advisors, LLC. | 160,176 | -0.73 | 6,471 | 14.43 | ||||
| 2025-08-14 | 13F | Bank Of America Corp /de/ | 12,431 | -6.56 | 502 | 7.73 | ||||
| 2025-08-13 | 13F | Willis Johnson & Associates, Inc. | 982,672 | 4.38 | 39,700 | 20.31 | ||||
| 2025-08-14 | 13F | Great Valley Advisor Group, Inc. | 178,208 | -1.74 | 7,200 | 13.25 | ||||
| 2025-08-12 | 13F | Frontier Asset Management, LLC | 7,294 | -90.97 | 295 | -89.61 | ||||
| 2025-08-13 | 13F | Baird Financial Group, Inc. | 7,940 | 321 | ||||||
| 2025-08-15 | 13F | Koesten, Hirschmann & Crabtree, INC. | 19 | 0.00 | 1 | |||||
| 2025-07-23 | 13F | Heck Capital Advisors, LLC | 249,563 | 0.22 | 10,082 | 15.51 | ||||
| 2025-08-12 | 13F | Jpmorgan Chase & Co | 184 | 0.00 | 7 | 16.67 | ||||
| 2025-08-06 | 13F | SOUTH STATE Corp | 25,440 | -15.02 | 1,028 | -2.10 | ||||
| 2025-07-11 | 13F | William Howard & Co Financial Advisors Inc | 16,137 | 0.70 | 652 | 16.04 | ||||
| 2025-08-14 | 13F | Jane Street Group, Llc | 46,326 | 1,872 | ||||||
| 2025-07-24 | 13F | IFP Advisors, Inc | 24,877 | 827.55 | 1,005 | 969.15 | ||||
| 2025-08-14 | 13F | Integrated Wealth Concepts LLC | 250,227 | 461.77 | 10,109 | 547.60 | ||||
| 2025-07-22 | 13F | Yardley Wealth Management LLC | 360,025 | -1.64 | 15 | 16.67 | ||||
| 2025-08-13 | 13F | EverSource Wealth Advisors, LLC | 30 | 0.00 | 1 | 0.00 | ||||
| 2025-07-08 | 13F | Prism Advisors, Inc. | 28,337 | -39.00 | 1,145 | -29.73 | ||||
| 2025-04-23 | 13F | Mascagni Wealth Management, Inc. | 0 | -100.00 | 0 | -100.00 | ||||
| 2025-07-18 | 13F/A | MJT & Associates Financial Advisory Group, Inc. | 685 | 28 | ||||||
| 2025-08-12 | 13F | Tableaux Llc | 15,000 | -86.72 | 15 | -99.62 | ||||
| 2025-08-13 | 13F | Northwestern Mutual Wealth Management Co | 1,438,388 | 12.01 | 58,111 | 29.10 | ||||
| 2025-08-19 | 13F | Advisory Services Network, LLC | 47,054 | 21.55 | 1,896 | 39.75 | ||||
| 2025-08-05 | 13F | Lord & Richards Wealth Management, LLC | 21,950 | 146.68 | 887 | 184.89 | ||||
| 2025-08-15 | 13F | Kestra Advisory Services, LLC | 362,962 | -0.75 | 14,664 | 14.39 | ||||
| 2025-08-15 | 13F | Morgan Stanley | 139,220 | -29.31 | 5,624 | -18.53 | ||||
| 2025-07-25 | 13F | Cwm, Llc | 31,665 | -27.02 | 1 | 0.00 | ||||
| 2025-07-23 | 13F | High Note Wealth, LLC | 178,666 | 186.57 | 7,218 | 230.34 | ||||
| 2025-07-11 | 13F/A | Umb Bank N A/mo | 200 | 0.00 | 8 | 14.29 | ||||
| 2025-05-15 | 13F | Bank Of America Corp /de/ | Put | 0 | -100.00 | 0 | -100.00 | |||
| 2025-08-11 | 13F | TD Waterhouse Canada Inc. | 1,632 | 0.00 | 66 | 14.04 | ||||
| 2025-07-21 | 13F | Investment Planning Advisors, Inc. | 416,007 | 107.51 | 16,807 | 139.16 | ||||
| 2025-05-13 | 13F/A | Magnolia Capital Advisors Llc | 26,757 | 3.61 | 874 | -4.17 | ||||
| 2025-08-12 | 13F | CIBC Private Wealth Group, LLC | 193 | 0.00 | 8 | 40.00 | ||||
| 2025-07-16 | 13F | Magnus Financial Group LLC | 32,105 | -0.12 | 1,297 | 15.19 | ||||
| 2025-07-28 | 13F | Mutual Advisors, LLC | 25,267 | 4.53 | 1,031 | 18.53 | ||||
| 2025-07-03 | 13F | TrueWealth Advisors, LLC | 128,729 | -4.52 | 5,201 | 10.03 | ||||
| 2025-08-14 | 13F | Mariner, LLC | 163,305 | -10.48 | 6,598 | 3.17 | ||||
| 2025-08-14 | 13F | Wells Fargo & Company/mn | 1,264,419 | 228.60 | 51,083 | 278.75 | ||||
| 2025-07-31 | 13F | Trademark Financial Management, LLC | 72,304 | 270.13 | 2,921 | 327.05 | ||||
| 2025-08-08 | 13F | Islay Capital Management, Llc | 71,613 | 4.53 | 2,893 | 20.49 | ||||
| 2025-08-13 | 13F | Colonial Trust Co / SC | 3,000 | 0.00 | 121 | 15.24 | ||||
| 2025-08-13 | 13F | Level Four Advisory Services, Llc | 23,568 | 0.58 | 952 | 15.96 | ||||
| 2025-08-14 | 13F | Comerica Bank | 2,401 | 0.00 | 97 | 15.48 | ||||
| 2025-07-21 | 13F | Ameritas Advisory Services, LLC | 2,133 | 86 | ||||||
| 2025-08-11 | 13F | HighTower Advisors, LLC | 396,795 | 8.89 | 16,030 | 25.50 | ||||
| 2025-07-15 | 13F | Mather Group, Llc. | 21,469 | 0.00 | 867 | 15.29 | ||||
| 2025-07-28 | 13F | Lunt Capital Management, Inc. | 62,234 | 0.81 | 2,514 | 16.23 | ||||
| 2025-08-06 | 13F | Savant Capital, LLC | 10,248 | 414 | ||||||
| 2025-08-14 | 13F | L2 Asset Management, LLC | 8,816 | 356 | ||||||
| 2025-07-17 | 13F | Janney Montgomery Scott LLC | 270,737 | 1.50 | 11 | 11.11 | ||||
| 2025-07-23 | 13F | Clear Creek Financial Management, LLC | 59,183 | -2.31 | 2,391 | 11.73 | ||||
| 2025-07-17 | 13F | HB Wealth Management, LLC | 5,300 | 214 | ||||||
| 2025-08-08 | 13F | Bailard, Inc. | 5,200 | 210 | ||||||
| 2025-08-26 | 13F/A | Thrivent Financial For Lutherans | 72,481 | -87.76 | 3 | -90.00 | ||||
| 2025-08-27 | 13F/A | Brinker Capital Investments, LLC | 55,000 | 0.00 | 2,222 | 15.31 | ||||
| 2025-05-15 | 13F/A | Orion Portfolio Solutions, LLC | 55,000 | 0.00 | 1,928 | 7.23 | ||||
| 2025-07-23 | 13F | L.K. Benson & Company, P.C. | 14,206 | 17.03 | 574 | 34.82 | ||||
| 2025-05-02 | 13F | Transcendent Capital Group LLC | 0 | -100.00 | 0 | |||||
| 2025-08-15 | 13F | Global View Capital Management LLC | 20,857 | -10.17 | 843 | 3.57 | ||||
| 2025-07-11 | 13F | SILVER OAK SECURITIES, Inc | 24,654 | 0.94 | 996 | 16.08 | ||||
| 2025-08-14 | 13F | CoreCap Advisors, LLC | 450 | 18 | ||||||
| 2025-08-14 | 13F | Coyle Financial Counsel LLC | 523,087 | 5.48 | 21,133 | 21.57 | ||||
| 2025-05-12 | 13F | Independent Advisor Alliance | 0 | -100.00 | 0 | |||||
| 2025-07-29 | 13F | Financial Guidance Group, Inc. | 31,969 | 1,292 | ||||||
| 2025-07-31 | 13F | Longview Financial Advisors, Inc. | 40,180 | 13.59 | 1,623 | 30.99 | ||||
| 2025-07-16 | 13F | Kathmere Capital Management, LLC | 519,600 | 0.78 | 20,992 | 16.15 | ||||
| 2025-07-25 | 13F | Pandora Wealth, Inc. | 45,188 | 0.65 | 1,826 | 16.02 | ||||
| 2025-08-12 | 13F | Proequities, Inc. | 0 | 0 | ||||||
| 2025-08-14 | 13F | Marshall Investment Management, Llc | 0 | -100.00 | 0 | |||||
| 2025-08-15 | 13F | Captrust Financial Advisors | 20,746 | 37.98 | 838 | 59.01 | ||||
| 2025-07-15 | 13F | Fifth Third Bancorp | 0 | -100.00 | 0 | |||||
| 2025-08-05 | 13F | Bank of New York Mellon Corp | 7,427 | 15.52 | 300 | 33.33 | ||||
| 2025-08-12 | 13F | Maripau Wealth Management Llc | 44,870 | 47.80 | 1,826 | 71.52 | ||||
| 2025-08-14 | 13F | Mml Investors Services, Llc | 55,313 | 275.44 | 2 | |||||
| 2025-08-18 | 13F/A | National Bank Of Canada /fi/ | 4,992 | 5.45 | 202 | 21.82 | ||||
| 2025-07-25 | 13F | Envestnet Portfolio Solutions, Inc. | 0 | -100.00 | 0 | |||||
| 2025-08-08 | 13F | Avantax Advisory Services, Inc. | 10,432 | 18.05 | 421 | 36.25 | ||||
| 2025-08-11 | 13F | Principal Securities, Inc. | 11,689 | 1,111.30 | 472 | 1,422.58 | ||||
| 2025-08-14 | 13F | Colony Group, LLC | 60,967 | -14.77 | 2,463 | -1.79 | ||||
| 2025-07-17 | 13F | Beacon Capital Management, LLC | 48 | 2.13 | 2 | 0.00 | ||||
| 2025-07-29 | 13F | Koshinski Asset Management, Inc. | 5,432 | 219 | ||||||
| 2025-05-06 | 13F | Venturi Wealth Management, LLC | 0 | -100.00 | 0 | |||||
| 2025-07-11 | 13F | Skyline Advisors, Inc. | 8,717 | 0.68 | 352 | 16.17 | ||||
| 2025-07-17 | 13F | Smith Anglin Financial, LLC | 11,844 | -5.87 | 478 | 8.39 | ||||
| 2025-08-13 | 13F | Townsquare Capital Llc | 0 | -100.00 | 0 | |||||
| 2025-08-07 | 13F | Tfo-tdc, Llc | 10,000 | 404 | ||||||
| 2025-08-07 | 13F | New England Private Wealth Advisors LLC | 113,580 | 1.62 | 4,597 | 17.33 | ||||
| 2025-08-08 | 13F | Creative Planning | 13,532 | 28.10 | 547 | 47.57 | ||||
| 2025-07-31 | 13F | Stegent Equity Advisors, Inc. | 11,763 | 0.00 | 475 | 15.29 | ||||
| 2025-04-21 | 13F | Nelson, Van Denburg & Campbell Wealth Management Group, LLC | 0 | -100.00 | 0 | |||||
| 2025-07-14 | 13F | AdvisorNet Financial, Inc | 1,441 | -66.57 | 58 | -61.59 | ||||
| 2025-08-06 | 13F | Stokes Family Office, LLC | 226,851 | -0.38 | 9,165 | 14.81 | ||||
| 2025-08-13 | 13F | Northern Trust Corp | 5,161 | 209 | ||||||
| 2025-05-14 | 13F | Flow Traders U.s. Llc | 0 | -100.00 | 0 | |||||
| 2025-08-13 | 13F | New Harbor Financial Group, LLC | 5,589 | -4.61 | 226 | 9.76 | ||||
| 2025-08-12 | 13F | Watchman Group, Inc. | 190,367 | -0.70 | 7,691 | 14.45 | ||||
| 2025-07-09 | 13F | Dynamic Advisor Solutions LLC | 10,109 | -3.03 | 408 | 11.78 | ||||
| 2025-08-19 | 13F | Anchor Investment Management, LLC | 5,010 | -8.98 | 202 | 5.21 | ||||
| 2025-09-04 | 13F/A | Advisor Group Holdings, Inc. | 22,443 | -37.71 | 907 | -28.32 | ||||
| 2025-04-16 | 13F | Fortitude Family Office, LLC | 0 | -100.00 | 0 | |||||
| 2025-04-10 | 13F | Clarus Wealth Advisors | 0 | -100.00 | 0 | |||||
| 2025-08-11 | 13F | Rothschild Investment Llc | 0 | -100.00 | 0 | |||||
| 2025-07-31 | 13F | Cambridge Investment Research Advisors, Inc. | 23,269 | 29.61 | 1 | |||||
| 2025-07-24 | 13F | Capital Advisors, Ltd. LLC | 8,583 | 21.31 | 0 | |||||
| 2025-08-06 | 13F | Commonwealth Equity Services, Llc | 72,132 | 5.36 | 3 | 0.00 | ||||
| 2025-08-14 | 13F | IHT Wealth Management, LLC | 7,729 | -3.04 | 312 | 11.83 | ||||
| 2025-04-28 | 13F | Strategic Financial Concepts, LLC | 0 | -100.00 | 0 | -100.00 | ||||
| 2025-08-14 | 13F | GWM Advisors LLC | 28,306 | 3.23 | 1,144 | 18.94 | ||||
| 2025-08-12 | 13F | Allen Capital Group, LLC | 33,656 | 9.53 | 1,360 | 26.18 | ||||
| 2025-08-18 | 13F | Geneos Wealth Management Inc. | 89,981 | 402.43 | 3,635 | 479.74 | ||||
| 2025-08-01 | 13F | Rossby Financial, LCC | 196,276 | 1.86 | 7,930 | 14.43 | ||||
| 2025-08-13 | 13F | Lumbard & Kellner, LLC | 154,307 | 97.17 | 6,234 | 127.27 | ||||
| 2025-08-01 | 13F | Envestnet Asset Management Inc | 356,976 | 527.54 | 14,422 | 623.58 | ||||
| 2025-08-05 | 13F | Ellevest, Inc. | 1,140,983 | 458.64 | 46,096 | 543.96 | ||||
| 2025-07-30 | 13F | Mills Wealth Advisors LLC | 5,280 | 213 | ||||||
| 2025-07-25 | 13F | We Are One Seven, LLC | 10,611 | -3.01 | 429 | 11.75 | ||||
| 2025-08-08 | 13F | Cetera Investment Advisers | 11,387 | -11.69 | 460 | 2.00 | ||||
| 2025-08-19 | 13F | Asset Dedication, LLC | 1,121 | 0.00 | 45 | 15.38 | ||||
| 2025-06-27 | NP | GIAX - Nicholas Global Equity and Income ETF | 57,776 | 22.11 | 2,089 | 29.69 | ||||
| 2025-08-04 | 13F | Center for Financial Planning, Inc. | 650 | 48.40 | 26 | 73.33 | ||||
| 2025-08-14 | 13F | Toroso Investments, LLC | 60,830 | 5.29 | 2,458 | 21.33 | ||||
| 2025-08-15 | 13F | First Heartland Consultants, Inc. | 362,182 | 14,632 | ||||||
| 2025-04-30 | 13F | Bull Oak Capital, LLC | 0 | -100.00 | 0 | |||||
| 2025-05-15 | 13F | Old Mission Capital Llc | 0 | -100.00 | 0 | |||||
| 2025-08-14 | 13F | Citadel Advisors Llc | 0 | -100.00 | 0 | |||||
| 2025-08-14 | 13F | Royal Bank Of Canada | 729 | -98.73 | 29 | -98.56 | ||||
| 2025-07-09 | 13F | Intelligence Driven Advisers, LLC | 422,619 | 25.95 | 17,074 | 45.17 | ||||
| 2025-08-01 | 13F | SwitchPoint Financial Planning, LLC | 5,644 | 228 | ||||||
| 2025-07-25 | 13F | Stephens Consulting, LLC | 187,682 | 14.25 | 7,582 | 31.70 | ||||
| 2025-08-11 | 13F | Aptus Capital Advisors, LLC | 658,174 | 91.48 | 26,590 | 120.70 | ||||
| 2025-07-15 | 13F | EWG Elevate Inc. | 93,518 | 3,778 | ||||||
| 2025-08-07 | 13F | Gs Investments, Inc. | 8,055 | 0.00 | 325 | 15.25 | ||||
| 2025-08-06 | 13F | AE Wealth Management LLC | 341 | -77.67 | 14 | -75.47 | ||||
| 2025-07-16 | 13F | ORG Partners LLC | 1,000 | 0.00 | 40 | 14.29 | ||||
| 2025-08-14 | 13F | Ancora Advisors, LLC | 3,371 | 28.47 | 136 | 49.45 | ||||
| 2025-08-12 | 13F | LPL Financial LLC | 227,106 | 25.38 | 9,175 | 44.51 | ||||
| 2025-05-15 | 13F | CAPROCK Group, Inc. | 37,747 | 1,333 | ||||||
| 2025-07-30 | 13F | Retirement Planning Group | 2,386,771 | 1.20 | 96,426 | 16.64 | ||||
| 2025-08-14 | 13F | Arete Wealth Advisors, LLC | 12,874 | -5.93 | 1 | |||||
| 2025-07-18 | 13F | Warren Street Wealth Advisors, LLC | 5,828 | 0.00 | 235 | 15.20 | ||||
| 2025-08-12 | 13F | Ameritas Investment Partners, Inc. | 94,884 | 5.72 | 3,833 | 21.88 | ||||
| 2025-07-22 | 13F | Wealthcare Advisory Partners LLC | 45,526 | 88.34 | 1,839 | 117.12 |