Basic Stats
| Institutional Owners | 163 total, 163 long only, 0 short only, 0 long/short - change of 0.00% MRQ |
| Average Portfolio Allocation | 0.3067 % - change of -9.70% MRQ |
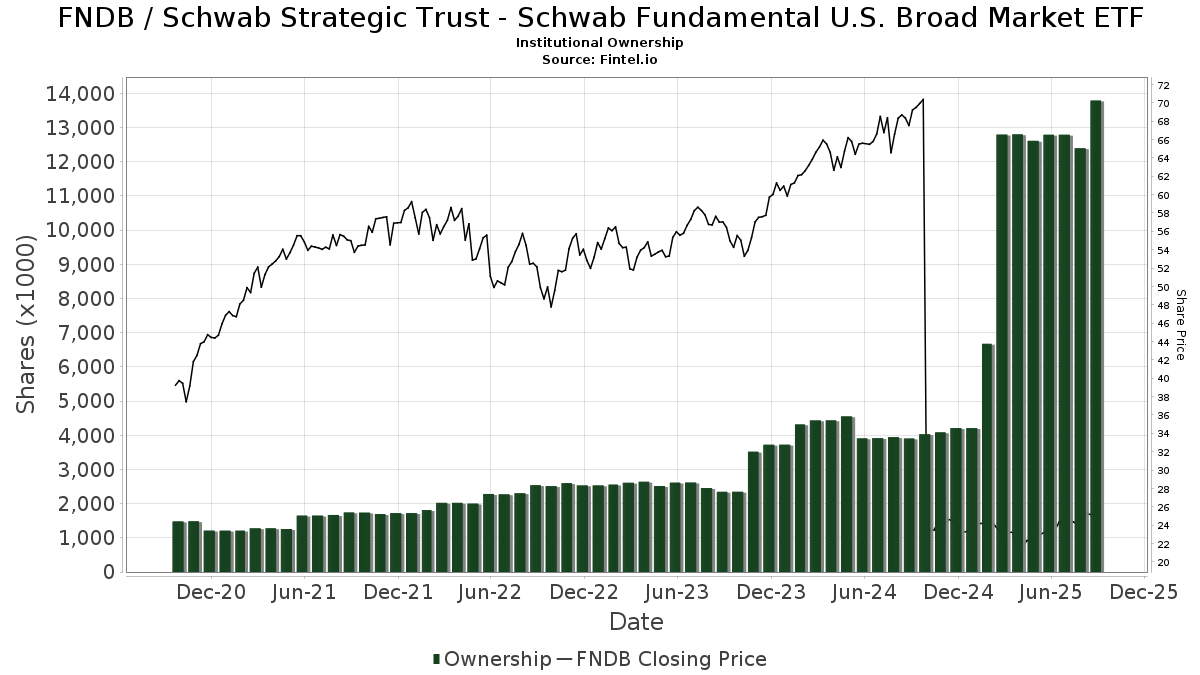
| Institutional Shares (Long) | 13,789,352 (ex 13D/G) - change of 1.00MM shares 7.83% MRQ |
| Institutional Value (Long) | $ 306,143 USD ($1000) |
Institutional Ownership and Shareholders
Schwab Strategic Trust - Schwab Fundamental U.S. Broad Market ETF (US:FNDB) has 163 institutional owners and shareholders that have filed 13D/G or 13F forms with the Securities Exchange Commission (SEC). These institutions hold a total of 13,789,352 shares. Largest shareholders include Financial Consulate, Inc, Callan Capital, LLC, AlphaCore Capital LLC, Opes Wealth Management LLC, HighTower Advisors, LLC, Cambridge Investment Research Advisors, Inc., Sound Stewardship, LLC, Bank Of America Corp /de/, Morgan Stanley, and Brightwater Advisory LLC .
Schwab Strategic Trust - Schwab Fundamental U.S. Broad Market ETF (ARCA:FNDB) institutional ownership structure shows current positions in the company by institutions and funds, as well as latest changes in position size. Major shareholders can include individual investors, mutual funds, hedge funds, or institutions. The Schedule 13D indicates that the investor holds (or held) more than 5% of the company and intends (or intended) to actively pursue a change in business strategy. Schedule 13G indicates a passive investment of over 5%.
The share price as of September 5, 2025 is 25.31 / share. Previously, on September 6, 2024, the share price was 22.36 / share. This represents an increase of 13.19% over that period.
Fund Sentiment Score
The Fund Sentiment Score (fka Ownership Accumulation Score) finds the stocks that are being most bought by funds. It is the result of a sophisticated, multi-factor quantitative model that identifies companies with the highest levels of institutional accumulation. The scoring model uses a combination of the total increase in disclosed owners, the changes in portfolio allocations in those owners and other metrics. The number ranges from 0 to 100, with higher numbers indicating a higher level of accumulation to its peers, and 50 being the average.
Update Frequency: Daily
See Ownership Explorer, which provides a list of highest-ranking companies.
Institutional Put/Call Ratio
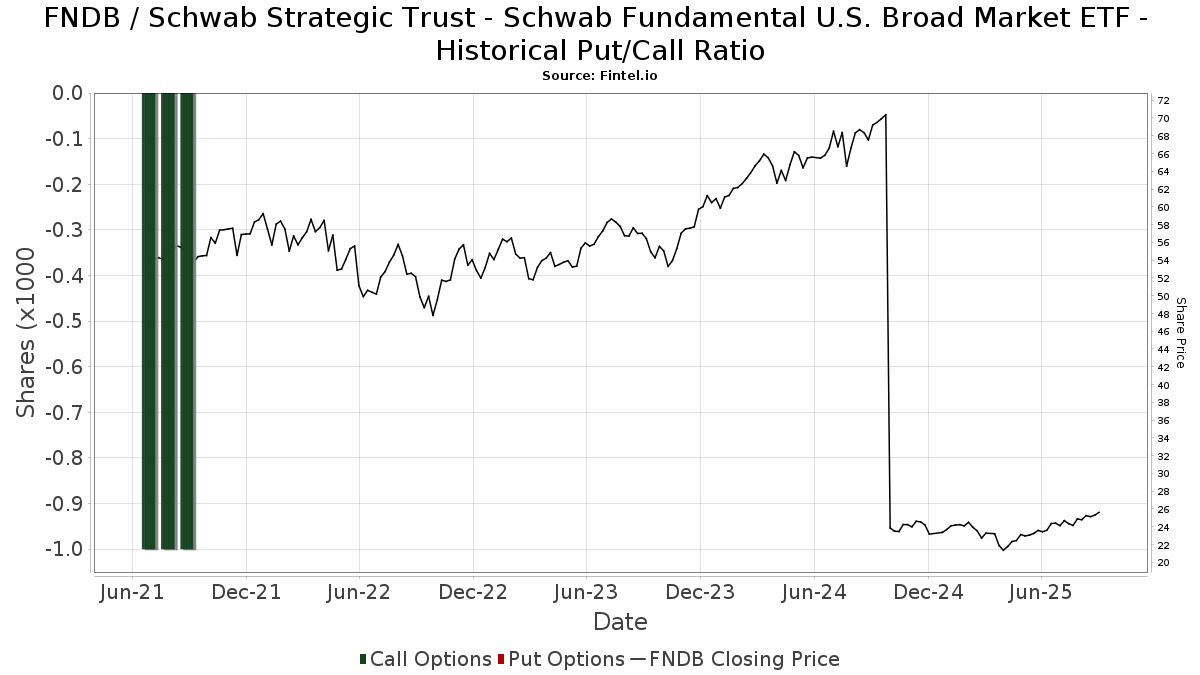
In addition to reporting standard equity and debt issues, institutions with more than 100MM assets under management must also disclose their put and call option holdings. Since put options generally indicate negative sentiment, and call options indicate positive sentiment, we can get a sense of the overall institutional sentiment by plotting the ratio of puts to calls. The chart to the right plots the historical put/call ratio for this instrument.
Using Put/Call Ratio as an indicator of investor sentiment overcomes one of the key deficiencies of using total institutional ownership, which is that a significant amount of assets under management are invested passively to track indices. Passively-managed funds do not typically buy options, so the put/call ratio indicator more closely tracks the sentiment of actively-managed funds.
13F and NPORT Filings
Detail on 13F filings are free. Detail on NP filings require a premium membership. Green rows indicate new positions. Red rows indicate closed positions. Click the link icon to see the full transaction history.
Upgrade
to unlock premium data and export to Excel ![]() .
.
| File Date | Source | Investor | Type | Avg Price (Est) |
Shares | Δ Shares (%) |
Reported Value ($1000) |
Δ Value (%) |
Port Alloc (%) |
|
|---|---|---|---|---|---|---|---|---|---|---|
| 2025-07-23 | 13F | Prime Capital Investment Advisors, LLC | 0 | -100.00 | 0 | |||||
| 2025-07-30 | 13F | Paul Damon & Associates, Inc. | 34,070 | 71.83 | 817 | 78.95 | ||||
| 2025-08-15 | 13F | Equitable Holdings, Inc. | 9,788 | 6.80 | 235 | 11.43 | ||||
| 2025-07-11 | 13F | Vanguard Capital Wealth Advisors This fund is a listed as child fund of Vanguard Group Inc and if that institution has disclosed ownership in this security, then these positions will not be double counted when calculating total shares and total value | 19,358 | -6.55 | 464 | -2.52 | ||||
| 2025-08-11 | 13F | Brown Brothers Harriman & Co | 51,171 | 0.00 | 1,227 | 4.25 | ||||
| 2025-08-13 | 13F | Quadrant Capital Group Llc | 43,944 | 0.00 | 1,054 | 4.15 | ||||
| 2025-08-05 | 13F | BCGM Wealth Management, LLC | 11,188 | -67.23 | 268 | -65.86 | ||||
| 2025-08-08 | 13F | Keyvantage Wealth, Llc | 14,484 | 0.00 | 347 | 4.20 | ||||
| 2025-07-18 | 13F | TruNorth Capital Management, LLC | 8,433 | 0.00 | 202 | 4.12 | ||||
| 2025-07-22 | 13F | Red Tortoise LLC | 46,357 | 0.18 | 1,112 | 4.42 | ||||
| 2025-07-23 | 13F | Values Added Financial LLC | 49,678 | 0.00 | 1,191 | 4.20 | ||||
| 2025-07-14 | 13F | AdvisorNet Financial, Inc | 13,005 | -56.61 | 312 | -54.86 | ||||
| 2025-05-27 | NP | EVVLX - The E-Valuator Very Conservative (0%-15%) RMS Fund Service Class Shares | 2,407 | 126.22 | 55 | 129.17 | ||||
| 2025-04-29 | 13F | Lee Danner & Bass Inc | 0 | -100.00 | 0 | |||||
| 2025-07-31 | 13F | Cambridge Investment Research Advisors, Inc. | 686,144 | 12.15 | 16 | 14.29 | ||||
| 2025-08-08 | 13F | Pinney & Scofield, Inc. | 360 | 0.00 | 9 | 0.00 | ||||
| 2025-07-29 | 13F | Foster & Motley Inc | 12,172 | 0.39 | 0 | |||||
| 2025-08-15 | 13F | Captrust Financial Advisors | 60,788 | -20.59 | 1,458 | -17.26 | ||||
| 2025-07-29 | 13F | Systelligence, LLC | 0 | -100.00 | 0 | |||||
| 2025-07-23 | 13F | Valmark Advisers, Inc. | 8,845 | -2.53 | 212 | 1.92 | ||||
| 2025-08-05 | 13F | Carolinas Wealth Consulting Llc | 0 | -100.00 | 0 | -100.00 | ||||
| 2025-07-24 | 13F | IFP Advisors, Inc | 0 | -100.00 | 0 | |||||
| 2025-08-12 | 13F | Aspiring Ventures, LLC | 121,366 | 0.00 | 2,910 | 6.91 | ||||
| 2025-08-14 | 13F | Avant Capital LLC | 22,310 | 6.11 | 535 | 10.56 | ||||
| 2025-07-14 | 13F | Foster Group, Inc. | 65,114 | 6.74 | 1,561 | 11.26 | ||||
| 2025-08-12 | 13F/A | Brightwater Advisory LLC | 290,415 | -1.90 | 6,964 | 2.25 | ||||
| 2025-08-05 | 13F | Plante Moran Financial Advisors, LLC | 351 | -9.30 | 8 | 0.00 | ||||
| 2025-08-14 | 13F | UBS Group AG | 115,672 | 6.02 | 2,774 | 10.48 | ||||
| 2025-08-11 | 13F | HHM Wealth Advisors, LLC | 96,693 | 0.00 | 2,319 | 4.23 | ||||
| 2025-08-14 | 13F | Raymond James Financial Inc | 279,639 | -37.27 | 6,706 | -34.63 | ||||
| 2025-08-12 | 13F | AlphaCore Capital LLC | 1,293,595 | 106,368.72 | 31,020 | 114,788.89 | ||||
| 2025-05-27 | NP | EVGLX - The E-Valuator Growth (70%-85%) RMS Fund Service Class Shares | 195,437 | -3.43 | 4,497 | -4.46 | ||||
| 2025-07-30 | 13F | Exencial Wealth Advisors, Llc | 35,945 | -0.29 | 862 | 3.86 | ||||
| 2025-08-08 | 13F | Cetera Investment Advisers | 26,110 | 60.89 | 626 | 67.83 | ||||
| 2025-07-29 | 13F | Chicago Partners Investment Group LLC | 22,029 | 0.00 | 543 | 9.92 | ||||
| 2025-04-29 | 13F | Callan Capital, LLC | 1,337,085 | -1.25 | 30,766 | -2.31 | ||||
| 2025-07-16 | 13F | Perigon Wealth Management, LLC | 15,258 | 0.00 | 366 | 3.99 | ||||
| 2025-08-08 | 13F | Pnc Financial Services Group, Inc. | 8,700 | -12.12 | 209 | -8.37 | ||||
| 2025-07-09 | 13F | GSG Advisors LLC | 42,487 | 0.32 | 1,019 | 9.94 | ||||
| 2025-07-09 | 13F | Breakwater Investment Management | 8,943 | 0.00 | 214 | 4.39 | ||||
| 2025-07-11 | 13F | SILVER OAK SECURITIES, Inc | 8,523 | 204 | ||||||
| 2025-08-11 | 13F | Pineridge Advisors LLC | 6,999 | 0.29 | 168 | 4.38 | ||||
| 2025-07-08 | 13F | Parallel Advisors, LLC | 2,999 | 99.93 | 72 | 108.82 | ||||
| 2025-08-11 | 13F | Traub Capital Management LLC | 1,050 | 25 | ||||||
| 2025-08-08 | 13F | Kaizen Financial Strategies | 117,633 | -0.59 | 2,821 | 3.60 | ||||
| 2025-08-13 | 13F | Jones Financial Companies Lllp | 52,895 | 186.09 | 1,263 | 199.29 | ||||
| 2025-09-04 | 13F/A | Advisor Group Holdings, Inc. | 54,666 | 10.10 | 1,311 | 14.80 | ||||
| 2025-07-16 | 13F | Townsend Asset Management Corp /nc/ /adv | 130,051 | -0.26 | 3,119 | 3.93 | ||||
| 2025-08-08 | 13F | KM Capital Management Ltd. | 19,809 | -18.02 | 475 | -14.57 | ||||
| 2025-08-08 | 13F | Larson Financial Group LLC | 2,500 | 31.58 | 60 | 37.21 | ||||
| 2025-07-22 | 13F | Valley National Advisers Inc | 6,210 | -22.67 | 0 | |||||
| 2025-08-14 | 13F | Goldman Sachs Group Inc | 273,068 | 217.63 | 6,548 | 231.04 | ||||
| 2025-08-29 | 13F | Centaurus Financial, Inc. | 5,903 | -6.54 | 0 | |||||
| 2025-08-13 | 13F | Lido Advisors, LLC | 12,238 | -4.70 | 293 | -0.68 | ||||
| 2025-05-01 | 13F | Fifth Third Securities, Inc. | 0 | -100.00 | 0 | |||||
| 2025-08-11 | 13F | Aptus Capital Advisors, LLC | 0 | -100.00 | 0 | |||||
| 2025-08-14 | 13F | Murphy & Mullick Capital Management Corp | 285 | 0.00 | 7 | 0.00 | ||||
| 2025-07-21 | 13F | Empirical Financial Services, LLC d.b.a. Empirical Wealth Management | 14,580 | 0.00 | 350 | 4.18 | ||||
| 2025-08-06 | 13F | Founders Financial Securities Llc | 49,823 | 1,195 | ||||||
| 2025-08-18 | 13F | Geneos Wealth Management Inc. | 2,787 | 0.00 | 67 | 3.13 | ||||
| 2025-03-12 | 13F/A | Private Capital Management Llc | 1,944 | -1.87 | 127 | -3.05 | ||||
| 2025-08-14 | 13F | Mml Investors Services, Llc | 145,641 | 63.02 | 3 | 50.00 | ||||
| 2025-08-06 | 13F | Commonwealth Equity Services, Llc | 83,401 | -2.73 | 2 | 100.00 | ||||
| 2025-07-30 | 13F | Retirement Planning Group | 17,424 | 0.00 | 418 | 4.25 | ||||
| 2025-08-01 | 13F | MorganRosel Wealth Management, LLC | 30,586 | -2.43 | 733 | 1.66 | ||||
| 2025-08-14 | 13F | GWM Advisors LLC | 1,923 | 0.00 | 46 | 4.55 | ||||
| 2025-08-14 | 13F | Mercer Global Advisors Inc /adv | 8,876 | -6.35 | 213 | -2.75 | ||||
| 2025-07-10 | 13F | Sovran Advisors, LLC | 18,223 | -5.34 | 443 | 7.26 | ||||
| 2025-08-01 | 13F | James Investment Research Inc | 73,197 | 7.92 | 1,755 | 12.50 | ||||
| 2025-07-11 | 13F | Seacrest Wealth Management, Llc | 42,741 | 0.14 | 1,025 | 4.28 | ||||
| 2025-07-28 | 13F | Eq Wealth Advisors, Llc | 136 | 0.00 | 3 | 0.00 | ||||
| 2025-08-15 | 13F | Tower Research Capital LLC (TRC) | 5,173 | -72.20 | 124 | -71.03 | ||||
| 2025-05-09 | 13F | Wade Financial Advisory, Inc | 45,843 | -0.68 | 1,055 | -1.77 | ||||
| 2025-07-14 | 13F | S.A. Mason LLC | 6,553 | 0.03 | 157 | 4.67 | ||||
| 2025-07-21 | 13F | Pflug Koory, LLC | 522 | 0.00 | 13 | 0.00 | ||||
| 2025-07-23 | 13F | Nbt Bank N A /ny | 11,955 | 0.00 | 287 | 4.00 | ||||
| 2025-08-13 | 13F | Milestone Investment Advisors LLC | 37,386 | -3.39 | 897 | 0.67 | ||||
| 2025-05-27 | NP | EVCLX - The E-Valuator Conservative (15%-30%) RMS Fund Service Class Shares | 8,877 | -9.43 | 204 | -10.13 | ||||
| 2025-08-14 | 13F | Colony Group, LLC | 8,340 | 200 | ||||||
| 2025-08-14 | 13F | Mariner, LLC | 57,569 | 10.35 | 1,381 | 15.00 | ||||
| 2025-08-15 | 13F | Kestra Advisory Services, LLC | 11,574 | 278 | ||||||
| 2025-07-25 | 13F | JustInvest LLC | 12,786 | 0.00 | 307 | 4.08 | ||||
| 2025-08-01 | 13F | Envestnet Asset Management Inc | 245,556 | 28.77 | 5,888 | 34.21 | ||||
| 2025-07-23 | 13F | Litman Gregory Asset Management LLC | 22,537 | 0.00 | 540 | 4.25 | ||||
| 2025-08-12 | 13F | Jpmorgan Chase & Co | 61,525 | 11.17 | 1,475 | 15.87 | ||||
| 2025-07-29 | 13F | Harbor Asset Planning, Inc. | 6,908 | 166 | ||||||
| 2025-07-31 | 13F | Guardian Financial Partners, LLC | 174,339 | -0.89 | 4,181 | 3.29 | ||||
| 2025-08-14 | 13F | Ameriprise Financial Inc | 262,206 | 6.23 | 6,278 | 10.78 | ||||
| 2025-08-14 | 13F | Jane Street Group, Llc | 12,416 | -75.43 | 298 | -74.44 | ||||
| 2025-08-14 | 13F | Wells Fargo & Company/mn | 1 | 0 | ||||||
| 2025-07-09 | 13F | Channel Wealth Llc | 31,150 | -13.81 | 747 | -10.23 | ||||
| 2025-08-11 | 13F | Hexagon Capital Partners LLC | 0 | -100.00 | 0 | |||||
| 2025-08-08 | 13F | Creative Planning | 43,241 | -13.10 | 1,037 | -9.44 | ||||
| 2025-08-13 | 13F | Cheviot Value Management, LLC | 4,018 | 0.42 | 98 | 8.99 | ||||
| 2025-07-28 | 13F | Frazier Financial Advisors, LLC | 22 | 1 | ||||||
| 2025-08-14 | 13F | Ancora Advisors, LLC | 1,350 | 0.00 | 32 | 3.23 | ||||
| 2025-08-15 | 13F | Cornerstone Financial Group, LLC /NE/ | 48,270 | 0.13 | 1,158 | 3.30 | ||||
| 2025-07-07 | 13F | Versant Capital Management, Inc | 465 | 0.00 | 11 | 10.00 | ||||
| 2025-08-13 | 13F | Northwestern Mutual Wealth Management Co | 9,172 | 33.84 | 220 | 39.49 | ||||
| 2025-08-14 | 13F | CoreCap Advisors, LLC | 1,416 | -40.85 | 34 | -40.00 | ||||
| 2025-08-14 | 13F | Royal Bank Of Canada | 23,933 | 49.05 | 574 | 55.56 | ||||
| 2025-05-15 | 13F | Old Mission Capital Llc | 0 | -100.00 | 0 | |||||
| 2025-07-29 | 13F | Stratos Wealth Partners, LTD. | 10,934 | 0.35 | 262 | 4.80 | ||||
| 2025-07-29 | 13F | Chevy Chase Trust Holdings, Inc. | 13,505 | -17.63 | 324 | -14.32 | ||||
| 2025-08-07 | 13F | 49 Wealth Management, Llc | 8,824 | 0.43 | 212 | 4.46 | ||||
| 2025-08-08 | 13F | Tanglewood Legacy Advisors, LLC | 4,191 | 0.00 | 100 | 4.17 | ||||
| 2025-08-29 | 13F | Total Investment Management Inc | 20,108 | 4.07 | 482 | 8.56 | ||||
| 2025-05-15 | 13F | Baird Financial Group, Inc. | 0 | -100.00 | 0 | |||||
| 2025-07-28 | 13F | Harbour Investments, Inc. | 7,412 | 0.43 | 178 | 4.73 | ||||
| 2025-07-25 | 13F | Cwm, Llc | 0 | -100.00 | 0 | |||||
| 2025-07-15 | 13F | Bfsg, Llc | 0 | -100.00 | 0 | |||||
| 2025-07-21 | 13F | Sage Financial Management Group, Inc. | 10,605 | -39.52 | 0 | |||||
| 2025-08-12 | 13F | CIBC Private Wealth Group, LLC | 1 | 0.00 | 0 | |||||
| 2025-07-29 | 13F | Mezzasalma Advisors, LLC | 144,666 | 1.10 | 3,469 | 5.38 | ||||
| 2025-08-12 | 13F | Coldstream Capital Management Inc | 54,096 | 0.00 | 1,297 | 4.26 | ||||
| 2025-08-11 | 13F | Wealthspire Advisors, LLC | 70,740 | 0.00 | 1,696 | 4.24 | ||||
| 2025-08-12 | 13F | Proequities, Inc. | 0 | 0 | ||||||
| 2025-08-15 | 13F | Morgan Stanley | 381,048 | 5.87 | 9,138 | 10.32 | ||||
| 2025-07-14 | 13F | Sound Stewardship, LLC | 616,513 | 7.76 | 14,784 | 12.30 | ||||
| 2025-07-29 | 13F | Werba Rubin Papier Wealth Management | 16,574 | 0.00 | 397 | 4.20 | ||||
| 2025-08-12 | 13F/A | Cozad Asset Management Inc | 28,993 | -3.15 | 695 | 1.02 | ||||
| 2025-07-15 | 13F | Mather Group, Llc. | 24,600 | 0.00 | 590 | 4.06 | ||||
| 2025-07-31 | 13F | Opes Wealth Management LLC | 701,803 | 10.59 | 16,829 | 15.26 | ||||
| 2025-08-14 | 13F | Citadel Advisors Llc | 31,796 | -43.62 | 762 | -41.25 | ||||
| 2025-08-06 | 13F | SOUTH STATE Corp | 4,031 | 1.31 | 97 | 5.49 | ||||
| 2025-08-08 | 13F | Capital Investment Advisory Services, LLC | 17,549 | 0.00 | 421 | 4.22 | ||||
| 2025-07-22 | 13F | Red Door Wealth Management, LLC | 86,728 | 0.00 | 2,080 | 4.21 | ||||
| 2025-07-30 | 13F | Blume Capital Management, Inc. | 2,000 | 0.00 | 48 | 2.17 | ||||
| 2025-05-27 | NP | EVAGX - The E-Valuator Aggressive Growth (85%-99%) RMS Fund Service Class Shares | 128,673 | -19.47 | 2,961 | -20.34 | ||||
| 2025-08-14 | 13F | Susquehanna International Group, Llp | 0 | -100.00 | 0 | |||||
| 2025-07-21 | 13F | Tower View Investment Management & Research LLC | 2,414 | 0.42 | 58 | 3.64 | ||||
| 2025-08-12 | 13F | Coston, McIsaac & Partners | 561 | 0.00 | 0 | |||||
| 2025-08-06 | 13F | Nicholas Hoffman & Company, LLC. | 49,107 | 0.32 | 1,178 | 4.53 | ||||
| 2025-07-08 | 13F | Lowe Wealth Advisors, LLC | 15 | 0.00 | 0 | |||||
| 2025-07-16 | 13F | Signaturefd, Llc | 2,284 | 1.51 | 55 | 5.88 | ||||
| 2025-08-12 | 13F | Steward Partners Investment Advisory, Llc | 7,125 | 105.45 | 171 | 115.19 | ||||
| 2025-07-23 | 13F | Winthrop Advisory Group LLC | 9,143 | 0.56 | 219 | 4.78 | ||||
| 2025-08-07 | 13F | Allworth Financial LP | 2,935 | 108.01 | 70 | 125.81 | ||||
| 2025-05-13 | 13F | Bank Of Montreal /can/ | 0 | -100.00 | 0 | |||||
| 2025-07-22 | 13F | Yoder Wealth Management, Inc. | 73,067 | -0.20 | 1,752 | 4.04 | ||||
| 2025-08-18 | 13F | Front Row Advisors LLC | 66 | 0.00 | 2 | 0.00 | ||||
| 2025-08-14 | 13F | Bank Of America Corp /de/ | 435,216 | 6.02 | 10,436 | 10.49 | ||||
| 2025-08-13 | 13F | Russell Investments Group, Ltd. | 145 | 3 | ||||||
| 2025-07-10 | 13F | Redhawk Wealth Advisors, Inc. | 34,950 | 0.43 | 838 | 4.75 | ||||
| 2025-07-30 | 13F | Crewe Advisors LLC | 8,843 | 0.00 | 212 | 4.43 | ||||
| 2025-07-08 | 13F | Zrc Wealth Management, Llc | 24,879 | -12.86 | 597 | -9.15 | ||||
| 2025-05-12 | 13F | Sandy Spring Bank | 900 | 0.00 | 21 | 0.00 | ||||
| 2025-08-14 | 13F | Great Valley Advisor Group, Inc. | 0 | -100.00 | 0 | |||||
| 2025-08-07 | 13F | Parkside Financial Bank & Trust | 4,846 | 0.37 | 116 | 4.50 | ||||
| 2025-07-17 | 13F | Sound Income Strategies, LLC | 453 | 11 | ||||||
| 2025-08-06 | 13F | Atlantic Union Bankshares Corp | 900 | 22 | ||||||
| 2025-07-08 | 13F | First National Corp /ma/ /adv | 85,225 | 0.00 | 2,044 | 4.18 | ||||
| 2025-08-12 | 13F | MAI Capital Management | 56,822 | 0.05 | 1,363 | 4.29 | ||||
| 2025-08-15 | 13F | CI Private Wealth, LLC | 140,592 | 185.48 | 3,350 | 216.04 | ||||
| 2025-08-14 | 13F | Modern Wealth Management, LLC | 22,008 | 83.31 | 528 | 90.94 | ||||
| 2025-07-21 | 13F | Ameritas Advisory Services, LLC | 1,137 | 27 | ||||||
| 2025-08-08 | 13F | Avantax Advisory Services, Inc. | 13,114 | -36.51 | 314 | -33.89 | ||||
| 2025-07-14 | 13F | Leonard Rickey Investment Advisors P.L.L.C. | 179,405 | -1.91 | 4,302 | 8.06 | ||||
| 2025-07-23 | 13F | Bellevue Asset Management, Llc | 28,555 | 0.00 | 685 | 4.11 | ||||
| 2025-07-31 | 13F | CVA Family Office, LLC | 126,680 | -1.80 | 3,038 | 2.32 | ||||
| 2025-07-31 | 13F | Carnegie Capital Asset Management, LLC | 14,823 | 0.00 | 355 | 16.01 | ||||
| 2025-08-04 | 13F | Creative Financial Designs Inc /adv | 231 | 0.00 | 6 | 0.00 | ||||
| 2025-05-27 | NP | EVMLX - The E-Valuator Moderate (50%-70%) RMS Fund Service Class Shares | 85,101 | 8.62 | 1,958 | 7.46 | ||||
| 2025-07-22 | 13F | Clarius Group, LLC | 89,484 | 0.00 | 2,146 | 4.18 | ||||
| 2025-08-14 | 13F | Fmr Llc | 8,427 | -0.46 | 202 | 4.12 | ||||
| 2025-04-23 | 13F | Mascagni Wealth Management, Inc. | 0 | -100.00 | 0 | -100.00 | ||||
| 2025-07-31 | 13F | Resonant Capital Advisors, LLC | 98,247 | 11.03 | 2,356 | 15.67 | ||||
| 2025-05-27 | NP | EVTTX - The E-Valuator Conservative/Moderate (30%-50%) RMS Fund Service Class Shares | 11,304 | 16.86 | 260 | 16.07 | ||||
| 2025-08-12 | 13F | Sfmg, Llc | 27,996 | 0.00 | 671 | 4.19 | ||||
| 2025-07-31 | 13F | Glass Jacobson Investment Advisors llc | 24,119 | 22.54 | 578 | 26.48 | ||||
| 2025-08-14 | 13F | Comerica Bank | 170 | 0.00 | 4 | 33.33 | ||||
| 2025-07-21 | 13F | Ameriflex Group, Inc. | 168 | 0.00 | 4 | 0.00 | ||||
| 2025-07-15 | 13F | Main Street Group, LTD | 0 | -100.00 | 0 | |||||
| 2025-08-12 | 13F | LPL Financial LLC | 105,719 | -15.86 | 2,535 | -12.31 | ||||
| 2025-08-11 | 13F | HighTower Advisors, LLC | 695,144 | 3.29 | 16,670 | 7.65 | ||||
| 2025-08-14 | 13F | Stifel Financial Corp | 15,854 | 8.67 | 380 | 13.43 | ||||
| 2025-07-17 | 13F | HB Wealth Management, LLC | 37,863 | 0.00 | 908 | 4.13 | ||||
| 2025-07-10 | 13F | Wealth Enhancement Advisory Services, Llc | 44,412 | 1,087 | ||||||
| 2025-07-11 | 13F | Farther Finance Advisors, LLC | 12,603 | 0.00 | 302 | 4.14 | ||||
| 2025-07-18 | 13F | Financial Consulate, Inc | 1,422,825 | -13.08 | 34,119 | -9.42 | ||||
| 2025-08-15 | 13F | Koesten, Hirschmann & Crabtree, INC. | 7,530 | 0.00 | 181 | 4.05 |