Basic Stats
| Institutional Owners | 123 total, 123 long only, 0 short only, 0 long/short - change of -1.60% MRQ |
| Average Portfolio Allocation | 0.1688 % - change of 15.67% MRQ |
| Institutional Shares (Long) | 10,470,499 (ex 13D/G) - change of 0.46MM shares 4.62% MRQ |
| Institutional Value (Long) | $ 146,079 USD ($1000) |
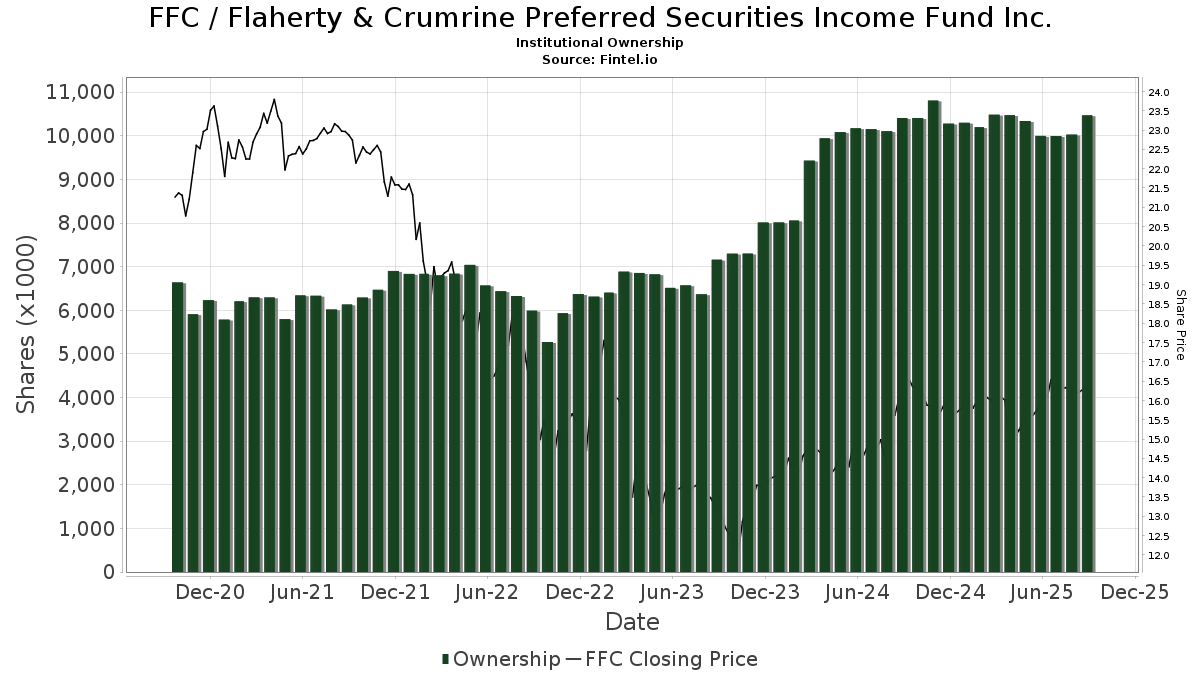
Institutional Ownership and Shareholders
Flaherty & Crumrine Preferred Securities Income Fund Inc. (US:FFC) has 123 institutional owners and shareholders that have filed 13D/G or 13F forms with the Securities Exchange Commission (SEC). These institutions hold a total of 10,470,499 shares. Largest shareholders include Wells Fargo & Company/mn, Invesco Ltd., PCEF - Invesco CEF Income Composite ETF, Morgan Stanley, Cohen & Steers, Inc., Envestnet Asset Management Inc, Bard Associates Inc, Sit Investment Associates Inc, Bank Of America Corp /de/, and Thomas J. Herzfeld Advisors, Inc. .
Flaherty & Crumrine Preferred Securities Income Fund Inc. (NYSE:FFC) institutional ownership structure shows current positions in the company by institutions and funds, as well as latest changes in position size. Major shareholders can include individual investors, mutual funds, hedge funds, or institutions. The Schedule 13D indicates that the investor holds (or held) more than 5% of the company and intends (or intended) to actively pursue a change in business strategy. Schedule 13G indicates a passive investment of over 5%.
The share price as of September 5, 2025 is 16.45 / share. Previously, on September 9, 2024, the share price was 16.28 / share. This represents an increase of 1.04% over that period.
Fund Sentiment Score
The Fund Sentiment Score (fka Ownership Accumulation Score) finds the stocks that are being most bought by funds. It is the result of a sophisticated, multi-factor quantitative model that identifies companies with the highest levels of institutional accumulation. The scoring model uses a combination of the total increase in disclosed owners, the changes in portfolio allocations in those owners and other metrics. The number ranges from 0 to 100, with higher numbers indicating a higher level of accumulation to its peers, and 50 being the average.
Update Frequency: Daily
See Ownership Explorer, which provides a list of highest-ranking companies.
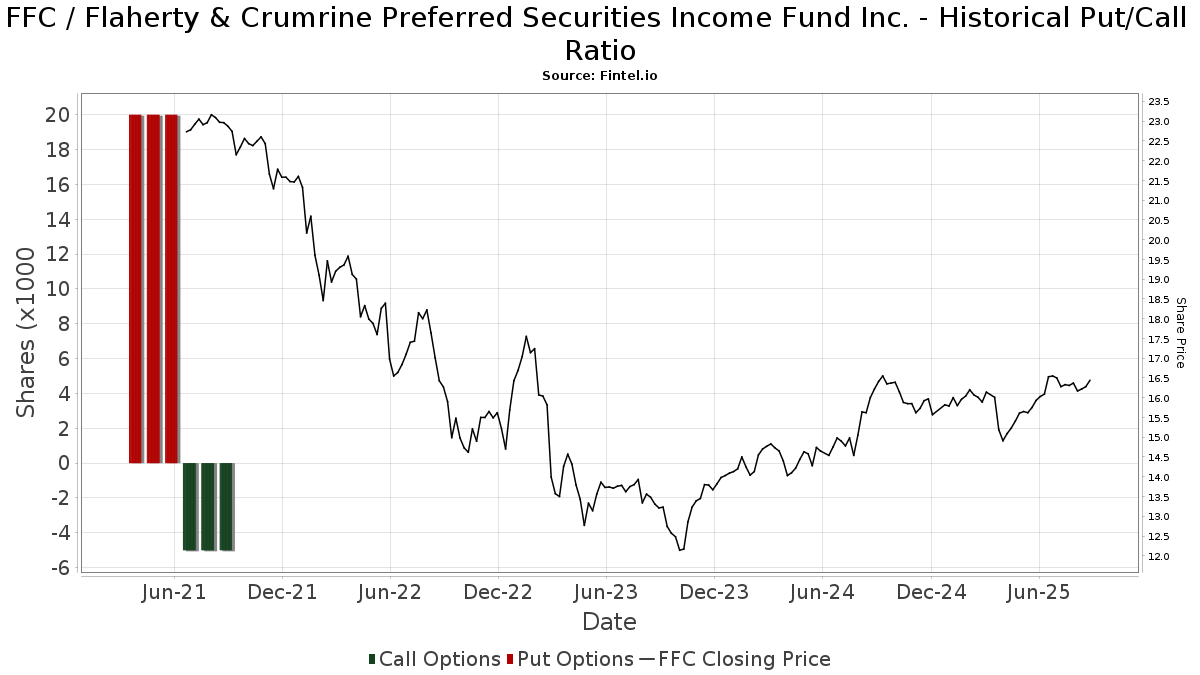
Institutional Put/Call Ratio
In addition to reporting standard equity and debt issues, institutions with more than 100MM assets under management must also disclose their put and call option holdings. Since put options generally indicate negative sentiment, and call options indicate positive sentiment, we can get a sense of the overall institutional sentiment by plotting the ratio of puts to calls. The chart to the right plots the historical put/call ratio for this instrument.
Using Put/Call Ratio as an indicator of investor sentiment overcomes one of the key deficiencies of using total institutional ownership, which is that a significant amount of assets under management are invested passively to track indices. Passively-managed funds do not typically buy options, so the put/call ratio indicator more closely tracks the sentiment of actively-managed funds.
13D/G Filings
We present 13D/G filings separately from the 13F filings because of the different treatement by the SEC. 13D/G filings can be filed by groups of investors (with one leading), whereas 13F filings cannot. This results in situations where an investor may file a 13D/G reporting one value for the total shares (representing all the shares owned by the investor group), but then file a 13F reporting a different value for the total shares (representing strictly their own ownership). This means that share ownership of 13D/G filings and 13F filings are oftentimes not directly comparable, so we present them separately.
Note: As of May 16, 2021, we no longer show owners that have not filed a 13D/G within the last year. Previously, we were showing the full history of 13D/G filings. In general, entities that are required to file 13D/G filings must file at least annually before submitting a closing filing. However, funds sometimes exit positions without submitting a closing filing (ie, they wind down), so displaying the full history sometimes resulted in confusion about the current ownership. To prevent confusion, we now only show ’current’ owners - that is - owners that have filed within the last year.
Upgrade to unlock premium data.
| File Date | Form | Investor | Prev Shares |
Latest Shares |
Δ Shares (Percent) |
Ownership (Percent) |
Δ Ownership (Percent) |
|
|---|---|---|---|---|---|---|---|---|
| 2025-07-21 | FIRST TRUST PORTFOLIOS LP | 1,493,352 | 2,721,896 | 82.27 | 5.65 | 61.43 |
13F and NPORT Filings
Detail on 13F filings are free. Detail on NP filings require a premium membership. Green rows indicate new positions. Red rows indicate closed positions. Click the link icon to see the full transaction history.
Upgrade
to unlock premium data and export to Excel ![]() .
.
| File Date | Source | Investor | Type | Avg Price (Est) |
Shares | Δ Shares (%) |
Reported Value ($1000) |
Δ Value (%) |
Port Alloc (%) |
|
|---|---|---|---|---|---|---|---|---|---|---|
| 2025-08-12 | 13F | Jacobi Capital Management LLC | 26,410 | 7.97 | 430 | 10.54 | ||||
| 2025-07-17 | 13F | Sound Income Strategies, LLC | 1,704 | -41.94 | 28 | -41.30 | ||||
| 2025-08-14 | 13F | Millennium Management Llc | 0 | -100.00 | 0 | |||||
| 2025-07-25 | 13F | Integrated Capital Management, Inc. | 18,582 | 1.98 | 303 | 4.14 | ||||
| 2025-07-25 | 13F | Cwm, Llc | 1,510 | -3.08 | 0 | |||||
| 2025-07-29 | 13F | International Assets Investment Management, Llc | 14,567 | 1.52 | 237 | 3.95 | ||||
| 2025-08-13 | 13F | Northwestern Mutual Wealth Management Co | 75 | -68.35 | 1 | -66.67 | ||||
| 2025-07-11 | 13F | SILVER OAK SECURITIES, Inc | 12,441 | 203 | ||||||
| 2025-08-14 | 13F | Evergreen Capital Management Llc | 12,550 | 0.00 | 204 | 2.51 | ||||
| 2025-05-14 | 13F | Landscape Capital Management, L.l.c. | 0 | -100.00 | 0 | |||||
| 2025-08-01 | 13F | Envestnet Asset Management Inc | 489,280 | 13.31 | 7,970 | 15.88 | ||||
| 2025-08-20 | NP | ADANX - AQR Diversified Arbitrage Fund Class N | 44,412 | -28.17 | 723 | -26.52 | ||||
| 2025-08-14 | 13F | Rivernorth Capital Management, Llc | 0 | -100.00 | 0 | |||||
| 2025-08-11 | 13F | Elequin Capital Lp | 0 | -100.00 | 0 | |||||
| 2025-08-25 | NP | MDFIX - Matisse Discounted Bond CEF Strategy Institutional Class | 23,907 | 0.00 | 389 | 2.37 | ||||
| 2025-08-13 | 13F | Baird Financial Group, Inc. | 158,715 | 10.00 | 2,585 | 12.49 | ||||
| 2025-08-14 | 13F | Jane Street Group, Llc | 10,126 | 165 | ||||||
| 2025-05-15 | 13F | Creative Planning | 0 | -100.00 | 0 | |||||
| 2025-07-29 | 13F | Stratos Wealth Partners, LTD. | 29,353 | 478 | ||||||
| 2025-08-12 | 13F | Pathstone Holdings, LLC | 0 | -100.00 | 0 | |||||
| 2025-05-08 | 13F | Arkadios Wealth Advisors | 0 | -100.00 | 0 | |||||
| 2025-08-12 | 13F | Steward Partners Investment Advisory, Llc | 500 | 0.00 | 8 | 14.29 | ||||
| 2025-07-31 | 13F | Washington Trust Advisors, Inc. | 970 | 0.00 | 16 | 0.00 | ||||
| 2025-07-14 | 13F | Maryland Capital Advisors Inc. | 5,600 | 91 | ||||||
| 2025-08-11 | 13F | Anderson Financial Strategies, LLC | 0 | -100.00 | 0 | |||||
| 2025-07-23 | 13F | Seamount Financial Group Inc | 33,955 | 0.76 | 553 | 3.17 | ||||
| 2025-07-07 | 13F | Thurston, Springer, Miller, Herd & Titak, Inc. | 0 | -100.00 | 0 | |||||
| 2025-08-14 | 13F | Federation des caisses Desjardins du Quebec | 41,886 | -37.37 | 682 | -35.96 | ||||
| 2025-07-18 | 13F | Chelsea Counsel Co | 3,010 | -3.22 | 49 | 0.00 | ||||
| 2025-08-27 | NP | RYMSX - Guggenheim Multi-Hedge Strategies Fund Class P | 118 | -36.56 | 2 | -50.00 | ||||
| 2025-07-28 | 13F | Harbour Investments, Inc. | 4,000 | 0.00 | 65 | 3.17 | ||||
| 2025-08-14 | 13F | Comerica Bank | 7,538 | -12.50 | 123 | -10.95 | ||||
| 2025-05-12 | 13F | Independent Advisor Alliance | 0 | -100.00 | 0 | |||||
| 2025-08-07 | 13F | Allworth Financial LP | 3,218 | -23.71 | 52 | -17.46 | ||||
| 2025-08-14 | 13F | Summit Trail Advisors, Llc | 10,711 | 174 | ||||||
| 2025-08-14 | 13F | Mariner, LLC | 11,046 | 180 | ||||||
| 2025-08-13 | 13F | Capital Analysts, Inc. | 2,531 | 0.00 | 0 | |||||
| 2025-08-14 | 13F | CoreCap Advisors, LLC | 1,300 | -53.57 | 21 | -52.27 | ||||
| 2025-07-03 | 13F | Sage Capital Advisors,llc | 19,244 | -9.10 | 313 | -7.12 | ||||
| 2025-08-11 | 13F | HighTower Advisors, LLC | 15,562 | -6.04 | 254 | -3.80 | ||||
| 2025-05-01 | 13F | Quest 10 Wealth Builders, Inc. | 0 | -100.00 | 0 | -100.00 | ||||
| 2025-08-14 | 13F | Fmr Llc | 0 | -100.00 | 0 | |||||
| 2025-07-15 | 13F | North Star Investment Management Corp. | 2,098 | 0.00 | 34 | 3.03 | ||||
| 2025-08-12 | 13F | Titleist Asset Management, Llc | 25,277 | 0.00 | 412 | 2.24 | ||||
| 2025-08-07 | 13F | Alpha Cubed Investments, LLC | 18,076 | 0.00 | 294 | 2.44 | ||||
| 2025-08-27 | NP | RYDEX VARIABLE TRUST - Multi-Hedge Strategies Fund Variable Annuity | 197 | -18.93 | 3 | 0.00 | ||||
| 2025-07-29 | 13F | Mountain Capital Investment Advisors, Inc | 62,924 | -0.05 | 1,030 | 8.08 | ||||
| 2025-05-15 | 13F | Mangrove Partners | 0 | -100.00 | 0 | |||||
| 2025-08-13 | 13F | Lido Advisors, LLC | 46,895 | 0.00 | 764 | 2.14 | ||||
| 2025-08-14 | 13F | Ameriprise Financial Inc | 285,383 | -0.24 | 4,649 | 2.00 | ||||
| 2025-07-14 | 13F | Whitener Capital Management, Inc. | 23,785 | 8.91 | 387 | 11.53 | ||||
| 2025-05-13 | 13F | SFI Advisors, LLC | 0 | -100.00 | 0 | |||||
| 2025-05-19 | 13F | Smith Asset Management Co., LLC | 107,539 | 1.37 | 1,497 | 4.18 | ||||
| 2025-08-06 | 13F | Wedbush Securities Inc | 26,653 | 0.02 | 0 | |||||
| 2025-08-14 | 13F | Robinson Capital Management, Llc | 15,113 | 0.00 | 246 | 2.50 | ||||
| 2025-08-14 | 13F | GWM Advisors LLC | 16,815 | -1.64 | 274 | 0.37 | ||||
| 2025-08-18 | 13F | Hollencrest Capital Management | 1,110 | 0.00 | 18 | 5.88 | ||||
| 2025-06-30 | NP | CVY - Invesco Zacks Multi-Asset Income ETF This fund is a listed as child fund of Invesco Ltd. and if that institution has disclosed ownership in this security, then these positions will not be double counted when calculating total shares and total value | 24,972 | -21.92 | 380 | -25.20 | ||||
| 2025-08-14 | 13F | Df Dent & Co Inc | 12,298 | 0.00 | 200 | 2.56 | ||||
| 2025-08-14 | 13F | Mml Investors Services, Llc | 11,666 | -24.56 | 0 | |||||
| 2025-07-18 | 13F | Consolidated Portfolio Review Corp | 39,597 | 1.10 | 645 | 3.53 | ||||
| 2025-07-14 | 13F | Sowell Financial Services LLC | 124,186 | -2.59 | 2,023 | -0.39 | ||||
| 2025-08-14 | 13F | Royal Bank Of Canada | 159,336 | -2.74 | 2,597 | -0.46 | ||||
| 2025-08-12 | 13F | Proequities, Inc. | 0 | 0 | ||||||
| 2025-08-08 | 13F | Family Firm, Inc. | 130,782 | 3.73 | 2,130 | 6.08 | ||||
| 2025-08-14 | 13F | Colony Group, LLC | 93,547 | 2.09 | 1,524 | 4.39 | ||||
| 2025-08-18 | 13F | Geneos Wealth Management Inc. | 3,810 | 0.00 | 62 | 3.33 | ||||
| 2025-06-27 | NP | Calamos ETF Trust - Calamos CEF Income & Arbitrage ETF | 20,951 | -11.54 | 319 | -15.16 | ||||
| 2025-08-06 | 13F | Csenge Advisory Group | 337,663 | -0.85 | 5,291 | 3.18 | ||||
| 2025-07-24 | 13F | Eastern Bank | 0 | -100.00 | 0 | |||||
| 2025-07-25 | 13F | Atria Wealth Solutions, Inc. | 0 | -100.00 | 0 | |||||
| 2025-08-14 | 13F | Cnh Partners Llc | 140,043 | -37.42 | 2,281 | -35.73 | ||||
| 2025-08-08 | 13F | Tiemann Investment Advisors, Llc | 15,388 | 0.00 | 251 | 2.04 | ||||
| 2025-08-13 | 13F | Cary Street Partners Financial Llc | 11,773 | 0.00 | 192 | 2.14 | ||||
| 2025-08-13 | 13F | Cerity Partners LLC | 0 | -100.00 | 0 | |||||
| 2025-07-18 | 13F | SOA Wealth Advisors, LLC. | 934 | 1.74 | 15 | 7.14 | ||||
| 2025-08-07 | 13F | Hennion & Walsh Asset Management, Inc. | 292,421 | 33.79 | 4,764 | 36.83 | ||||
| 2025-08-13 | 13F | Thomas J. Herzfeld Advisors, Inc. | 386,181 | 8.56 | 6,291 | 11.01 | ||||
| 2025-07-14 | 13F | Gridiron Partners, LLC | 147,931 | 0.00 | 2,410 | 2.25 | ||||
| 2025-08-08 | 13F | Pnc Financial Services Group, Inc. | 59,032 | 5.64 | 962 | 7.98 | ||||
| 2025-07-31 | 13F | Cambridge Investment Research Advisors, Inc. | 22,123 | -43.82 | 0 | |||||
| 2025-08-14 | 13F | UBS Group AG | 103,338 | -19.91 | 1,683 | -18.10 | ||||
| 2025-07-24 | 13F | Bernard Wealth Management Corp. | 222 | 1.83 | 4 | 0.00 | ||||
| 2025-08-13 | 13F | Everstar Asset Management, LLC | 47,900 | -9.11 | 780 | -7.03 | ||||
| 2025-08-04 | 13F | Spire Wealth Management | 20,392 | 1.79 | 332 | 4.08 | ||||
| 2025-08-08 | 13F | Cetera Investment Advisers | 119,502 | 1.85 | 1,947 | 4.12 | ||||
| 2025-08-14 | 13F | Susquehanna International Group, Llp | 21,252 | -0.34 | 346 | 2.06 | ||||
| 2025-08-14 | 13F | Bank Of America Corp /de/ | 400,569 | -3.27 | 6,525 | -1.09 | ||||
| 2025-07-10 | 13F | Wealth Enhancement Advisory Services, Llc | 50,241 | -2.28 | 832 | 1.47 | ||||
| 2025-05-12 | 13F | C2P Capital Advisory Group, LLC d.b.a. Prosperity Capital Advisors | 0 | -100.00 | 0 | -100.00 | ||||
| 2025-08-28 | NP | Cohen & Steers Closed-end Opportunity Fund, Inc. | 166,755 | 0.00 | 2,716 | 2.26 | ||||
| 2025-04-28 | 13F | Strategic Financial Concepts, LLC | 0 | -100.00 | 0 | -100.00 | ||||
| 2025-07-15 | 13F | Mather Group, Llc. | 0 | -100.00 | 0 | |||||
| 2025-08-14 | 13F | Raymond James Financial Inc | 207,465 | 1.12 | 3,380 | 3.40 | ||||
| 2025-08-14 | 13F | Sunbelt Securities, Inc. | 350 | 0.00 | 5 | 0.00 | ||||
| 2025-07-08 | 13F | Nbc Securities, Inc. | 315 | 0.00 | 0 | |||||
| 2025-08-13 | 13F | Invesco Ltd. | 763,056 | 12.12 | 12,430 | 14.66 | ||||
| 2025-08-14 | 13F | Hrt Financial Lp | 13,003 | 0 | ||||||
| 2025-04-15 | 13F | Noble Wealth Management PBC | 70,150 | -0.99 | 1,117 | 1.55 | ||||
| 2025-08-15 | 13F | Morgan Stanley | 574,174 | 0.20 | 9,353 | 2.46 | ||||
| 2025-08-05 | 13F | Ceera Investments, Llc | 24,170 | 394 | ||||||
| 2025-04-22 | 13F | Guyasuta Investment Advisors Inc | 0 | -100.00 | 0 | |||||
| 2025-07-17 | 13F | Janney Montgomery Scott LLC | 16,021 | -9.13 | 0 | |||||
| 2025-08-27 | NP | RBNAX - Robinson Opportunistic Income Fund Class A Shares | 15,003 | 0.00 | 244 | 2.52 | ||||
| 2025-08-13 | 13F | Jones Financial Companies Lllp | 0 | -100.00 | 0 | |||||
| 2025-08-14 | 13F | Sit Investment Associates Inc | 418,047 | 52.42 | 7 | 50.00 | ||||
| 2025-08-14 | 13F | 1607 Capital Partners, LLC | 375,350 | 2.40 | 6,114 | 4.71 | ||||
| 2025-08-14 | 13F | Stifel Financial Corp | 125,399 | -34.90 | 2,043 | -33.44 | ||||
| 2025-05-15 | 13F | Mercer Global Advisors Inc /adv | 0 | -100.00 | 0 | |||||
| 2025-07-23 | 13F | Matisse Capital | 23,907 | 0.00 | 389 | 2.37 | ||||
| 2025-08-13 | 13F | Smith, Moore & Co. | 24,289 | 24.95 | 396 | 27.83 | ||||
| 2025-07-29 | 13F | Private Trust Co Na | 2,100 | 0.00 | 34 | 3.03 | ||||
| 2025-08-18 | 13F/A | Nomura Holdings Inc | 10,000 | 163 | ||||||
| 2025-08-04 | 13F | Prairie Wealth Advisors, Inc. | 12,850 | 0.39 | 209 | 2.96 | ||||
| 2025-08-05 | 13F | GPS Wealth Strategies Group, LLC | 5,405 | 1.03 | 88 | 3.53 | ||||
| 2025-08-12 | 13F | MAI Capital Management | 2,400 | 0.00 | 39 | 2.63 | ||||
| 2025-07-09 | 13F | Massmutual Trust Co Fsb/adv | 3,548 | 58 | ||||||
| 2025-07-24 | 13F | IFP Advisors, Inc | 3,500 | 0.00 | 57 | 3.64 | ||||
| 2025-08-14 | 13F | Wiley Bros.-aintree Capital, Llc | 33,011 | 538 | ||||||
| 2025-08-08 | 13F | Calamos Advisors LLC | 20,951 | -8.00 | 341 | -5.80 | ||||
| 2025-08-06 | 13F | Commonwealth Equity Services, Llc | 240,041 | 27.95 | 4 | 50.00 | ||||
| 2025-08-14 | 13F | Wells Fargo & Company/mn | 908,466 | -11.57 | 14,799 | -9.57 | ||||
| 2025-04-23 | 13F | Bessemer Group Inc | 0 | -100.00 | 0 | |||||
| 2025-07-14 | 13F | Park Avenue Securities Llc | 85,932 | -2.31 | 1 | 0.00 | ||||
| 2025-07-28 | NP | PCEF - Invesco CEF Income Composite ETF This fund is a listed as child fund of Invesco Ltd. and if that institution has disclosed ownership in this security, then these positions will not be double counted when calculating total shares and total value | 600,552 | -9.46 | 9,411 | -11.77 | ||||
| 2025-08-01 | 13F | Chilton Capital Management Llc | 1,550 | 0.00 | 25 | 4.17 | ||||
| 2025-08-15 | 13F | First Heartland Consultants, Inc. | 11,620 | 189 | ||||||
| 2025-08-14 | 13F | Atomi Financial Group, Inc. | 65,525 | -0.76 | 1,067 | 1.52 | ||||
| 2025-08-15 | 13F | Koesten, Hirschmann & Crabtree, INC. | 186 | 0.00 | 3 | 50.00 | ||||
| 2025-08-26 | 13F/A | Thrivent Financial For Lutherans | 58,651 | 0.77 | 1 | |||||
| 2025-07-29 | 13F | TFC Financial Management | 0 | -100.00 | 0 | |||||
| 2025-08-11 | 13F | Private Advisor Group, LLC | 13,184 | -16.55 | 215 | -14.74 | ||||
| 2025-08-13 | 13F | Rsm Us Wealth Management Llc | 29,662 | -41.99 | 483 | -40.66 | ||||
| 2025-07-18 | 13F | Truist Financial Corp | 11,272 | -3.61 | 184 | -1.61 | ||||
| 2025-08-12 | 13F | LPL Financial LLC | 288,786 | -5.35 | 4,704 | -3.21 | ||||
| 2025-08-07 | 13F | Kestra Private Wealth Services, Llc | 16,534 | 1.48 | 269 | 3.86 | ||||
| 2025-07-15 | 13F | Elevated Capital Advisors, LLC | 122,242 | 0.00 | 1,947 | 0.00 | ||||
| 2025-07-21 | 13F | Future Financial Wealth Managment LLC | 5,000 | 0.00 | 81 | 2.53 | ||||
| 2025-08-04 | 13F | Assetmark, Inc | 220 | -57.85 | 4 | -62.50 | ||||
| 2025-06-12 | 13F/A | Deutsche Bank Ag\ | 0 | -100.00 | 0 | |||||
| 2025-08-13 | 13F | Guggenheim Capital Llc | 81,216 | 8.64 | 1,323 | 11.18 | ||||
| 2025-08-11 | 13F | Western Wealth Management, LLC | 35,579 | -8.43 | 580 | -6.31 | ||||
| 2025-09-04 | 13F/A | Advisor Group Holdings, Inc. | 122,732 | -3.91 | 1,999 | -1.72 | ||||
| 2025-07-08 | 13F | Parallel Advisors, LLC | 5,160 | 0.00 | 84 | 2.44 | ||||
| 2025-05-14 | 13F | Walleye Capital LLC | 0 | -100.00 | 0 | |||||
| 2025-07-21 | 13F | Ameritas Advisory Services, LLC | 1,682 | 27 | ||||||
| 2025-08-14 | 13F | Cohen & Steers, Inc. | 572,296 | 0.00 | 9 | 0.00 | ||||
| 2025-07-24 | 13F | Us Bancorp \de\ | 8,456 | -10.05 | 138 | -8.05 | ||||
| 2025-08-05 | 13F | Bard Associates Inc | 445,640 | 598.02 | 7,259 | 613.77 | ||||
| 2025-07-09 | 13F | Pines Wealth Management, LLC | 17,884 | 0.00 | 296 | 12.98 |