Basic Stats
| Institutional Owners | 36 total, 36 long only, 0 short only, 0 long/short - change of 28.57% MRQ |
| Average Portfolio Allocation | 0.0138 % - change of 36.02% MRQ |
| Institutional Shares (Long) | 645,043 (ex 13D/G) - change of 0.00MM shares 0.49% MRQ |
| Institutional Value (Long) | $ 18,518 USD ($1000) |
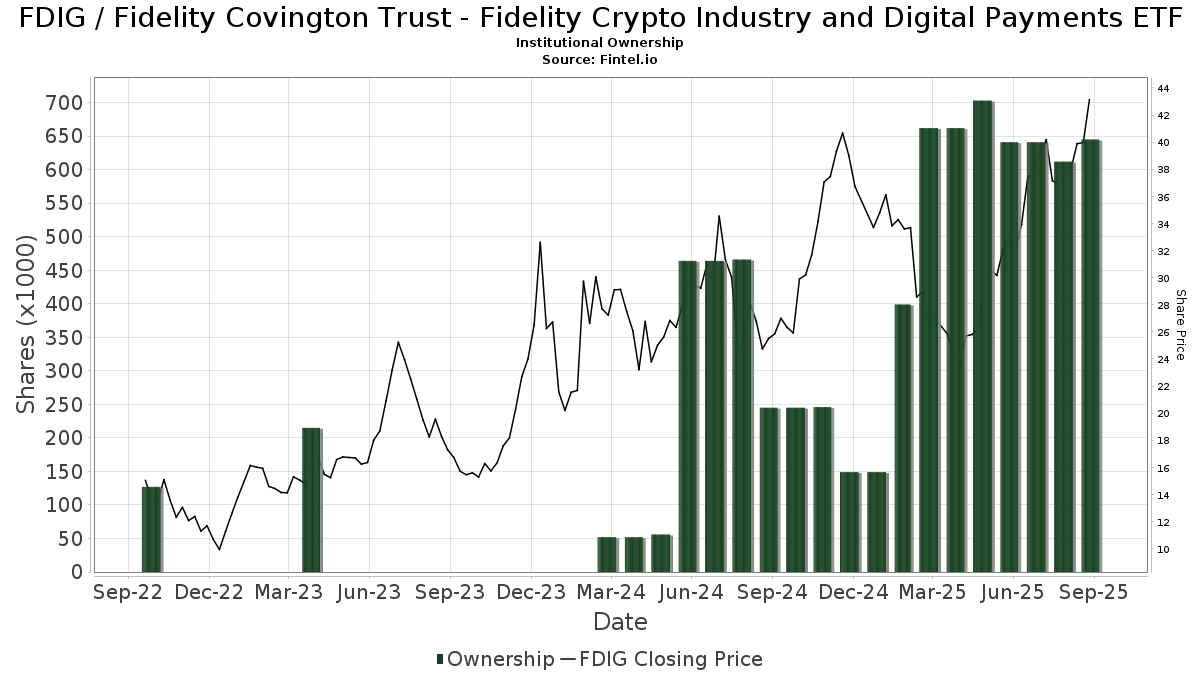
Institutional Ownership and Shareholders
Fidelity Covington Trust - Fidelity Crypto Industry and Digital Payments ETF (US:FDIG) has 36 institutional owners and shareholders that have filed 13D/G or 13F forms with the Securities Exchange Commission (SEC). These institutions hold a total of 645,043 shares. Largest shareholders include Atria Wealth Solutions, Inc., Commonwealth Equity Services, Llc, Jane Street Group, Llc, Cetera Investment Advisers, Cyndeo Wealth Partners, LLC, Citadel Advisors Llc, National Asset Management, Inc., Sowell Financial Services LLC, Gts Securities Llc, and Prairie Wealth Advisors, Inc. .
Fidelity Covington Trust - Fidelity Crypto Industry and Digital Payments ETF (NasdaqGM:FDIG) institutional ownership structure shows current positions in the company by institutions and funds, as well as latest changes in position size. Major shareholders can include individual investors, mutual funds, hedge funds, or institutions. The Schedule 13D indicates that the investor holds (or held) more than 5% of the company and intends (or intended) to actively pursue a change in business strategy. Schedule 13G indicates a passive investment of over 5%.
The share price as of September 5, 2025 is 39.30 / share. Previously, on September 6, 2024, the share price was 23.56 / share. This represents an increase of 66.81% over that period.
Fund Sentiment Score
The Fund Sentiment Score (fka Ownership Accumulation Score) finds the stocks that are being most bought by funds. It is the result of a sophisticated, multi-factor quantitative model that identifies companies with the highest levels of institutional accumulation. The scoring model uses a combination of the total increase in disclosed owners, the changes in portfolio allocations in those owners and other metrics. The number ranges from 0 to 100, with higher numbers indicating a higher level of accumulation to its peers, and 50 being the average.
Update Frequency: Daily
See Ownership Explorer, which provides a list of highest-ranking companies.
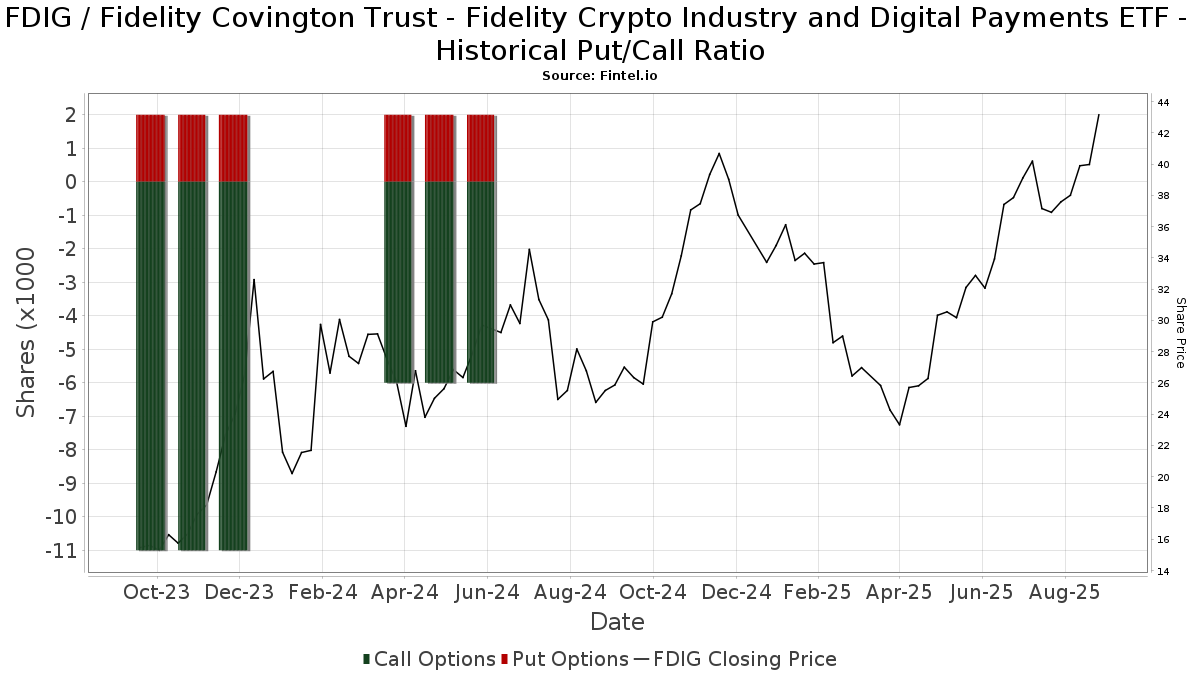
Institutional Put/Call Ratio
In addition to reporting standard equity and debt issues, institutions with more than 100MM assets under management must also disclose their put and call option holdings. Since put options generally indicate negative sentiment, and call options indicate positive sentiment, we can get a sense of the overall institutional sentiment by plotting the ratio of puts to calls. The chart to the right plots the historical put/call ratio for this instrument.
Using Put/Call Ratio as an indicator of investor sentiment overcomes one of the key deficiencies of using total institutional ownership, which is that a significant amount of assets under management are invested passively to track indices. Passively-managed funds do not typically buy options, so the put/call ratio indicator more closely tracks the sentiment of actively-managed funds.
13F and NPORT Filings
Detail on 13F filings are free. Detail on NP filings require a premium membership. Green rows indicate new positions. Red rows indicate closed positions. Click the link icon to see the full transaction history.
Upgrade
to unlock premium data and export to Excel ![]() .
.
| File Date | Source | Investor | Type | Avg Price (Est) |
Shares | Δ Shares (%) |
Reported Value ($1000) |
Δ Value (%) |
Port Alloc (%) |
|
|---|---|---|---|---|---|---|---|---|---|---|
| 2025-08-13 | 13F | Northwestern Mutual Wealth Management Co | 200 | 7 | ||||||
| 2025-08-12 | 13F | LPL Financial LLC | 9,792 | 349 | ||||||
| 2025-08-14 | 13F | Fmr Llc | 1,094 | -37.27 | 39 | -9.52 | ||||
| 2025-05-15 | 13F | Old Mission Capital Llc | 0 | -100.00 | 0 | |||||
| 2025-05-14 | 13F | Torno Capital, Llc | 0 | -100.00 | 0 | -100.00 | ||||
| 2025-07-17 | 13F | Halbert Hargrove Global Advisors, Llc | 0 | -100.00 | 0 | |||||
| 2025-08-15 | 13F | Morgan Stanley | 2,046 | 95.79 | 73 | 188.00 | ||||
| 2025-07-28 | 13F | Harbour Investments, Inc. | 29 | 0.00 | 1 | |||||
| 2025-08-14 | 13F | CoreCap Advisors, LLC | 59 | 0.00 | 2 | 100.00 | ||||
| 2025-08-12 | 13F | Proequities, Inc. | 0 | 0 | ||||||
| 2025-08-13 | 13F | Advisor Group Holdings, Inc. | 100 | 0.00 | 3 | 50.00 | ||||
| 2025-07-07 | 13F | Roxbury Financial LLC | 81 | 0.00 | 3 | 0.00 | ||||
| 2025-07-24 | 13F | Cyndeo Wealth Partners, LLC | 26,600 | -42.92 | 947 | -16.21 | ||||
| 2025-08-12 | 13F | Global Retirement Partners, LLC | 0 | -100.00 | 0 | |||||
| 2025-08-06 | 13F | Commonwealth Equity Services, Llc | 123,103 | -5.42 | 4 | 33.33 | ||||
| 2025-08-01 | 13F | Rossby Financial, LCC | 81 | 0.00 | 3 | 0.00 | ||||
| 2025-08-14 | 13F | Sunbelt Securities, Inc. | 10,329 | 236.78 | 336 | 352.70 | ||||
| 2025-08-12 | 13F | MAI Capital Management | 44 | 0.00 | 2 | 0.00 | ||||
| 2025-07-25 | 13F | Atria Wealth Solutions, Inc. | 241,409 | -2.20 | 8,594 | 43.71 | ||||
| 2025-07-25 | 13F | Cwm, Llc | 206 | 0 | ||||||
| 2025-08-08 | 13F | Gts Securities Llc | 11,228 | 400 | ||||||
| 2025-08-04 | 13F | Prairie Wealth Advisors, Inc. | 10,911 | -3.32 | 388 | 42.12 | ||||
| 2025-08-19 | 13F | National Asset Management, Inc. | 12,295 | 438 | ||||||
| 2025-05-14 | 13F | Mml Investors Services, Llc | 0 | -100.00 | 0 | |||||
| 2025-08-12 | 13F | Manchester Capital Management LLC | 500 | 0.00 | 18 | 41.67 | ||||
| 2025-08-14 | 13F | Citadel Advisors Llc | 15,081 | 537 | ||||||
| 2025-07-31 | 13F | Glass Jacobson Investment Advisors llc | 1,957 | 0.05 | 70 | 9.52 | ||||
| 2025-04-23 | 13F | Spire Wealth Management | 0 | -100.00 | 0 | |||||
| 2025-08-14 | 13F | Wells Fargo & Company/mn | 570 | 56,900.00 | 20 | |||||
| 2025-08-12 | 13F | Howe & Rusling Inc | 1,004 | 36 | ||||||
| 2025-08-08 | 13F | Cetera Investment Advisers | 27,297 | -22.87 | 972 | 13.30 | ||||
| 2025-08-14 | 13F | UBS Group AG | 82 | -98.13 | 3 | -98.11 | ||||
| 2025-05-13 | 13F | Steward Partners Investment Advisory, Llc | 0 | -100.00 | 0 | |||||
| 2025-07-14 | 13F | Sowell Financial Services LLC | 11,952 | 9.13 | 425 | 60.38 | ||||
| 2025-08-11 | 13F | Aptus Capital Advisors, LLC | 1,513 | 54 | ||||||
| 2025-07-31 | 13F | Briaud Financial Planning, Inc | 236 | 0 | ||||||
| 2025-08-14 | 13F | Raymond James Financial Inc | 560 | 20 | ||||||
| 2025-08-15 | 13F | Cooksen Wealth, LLC | 17 | 1 | ||||||
| 2025-07-11 | 13F | Farther Finance Advisors, LLC | 319 | 0.00 | 11 | 57.14 | ||||
| 2025-08-12 | 13F | Jpmorgan Chase & Co | 0 | -100.00 | 0 | |||||
| 2025-08-05 | 13F | Simplex Trading, Llc | 0 | -100.00 | 0 | |||||
| 2025-08-14 | 13F | Jane Street Group, Llc | 116,163 | -16.22 | 4,135 | 23.10 | ||||
| 2025-08-14 | 13F | Susquehanna International Group, Llp | 9,644 | 343 | ||||||
| 2025-08-08 | 13F | Larson Financial Group LLC | 28 | 0.00 | 1 | |||||
| 2025-08-06 | 13F | AE Wealth Management LLC | 2,272 | 0.00 | 81 | 45.45 | ||||
| 2025-08-14 | 13F | Bank Of America Corp /de/ | 6,241 | 222 | ||||||
| 2025-04-24 | 13F | Aspect Partners, LLC | 0 | -100.00 | 0 |