Basic Stats
| Institutional Shares (Long) | 1,586,693 - 1.87% (ex 13D/G) - change of 0.41MM shares 35.37% MRQ |
| Institutional Value (Long) | $ 4,929 USD ($1000) |
Institutional Ownership and Shareholders
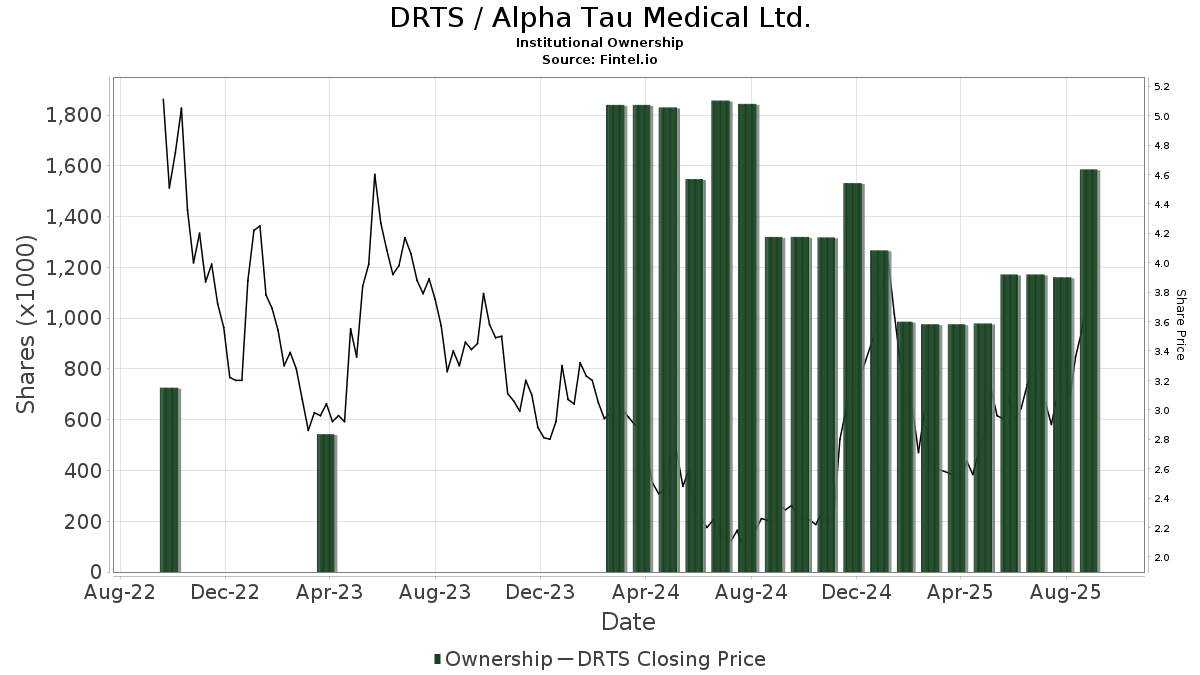
Alpha Tau Medical Ltd. (US:DRTS) has 26 institutional owners and shareholders that have filed 13D/G or 13F forms with the Securities Exchange Commission (SEC). These institutions hold a total of 1,586,693 shares. Largest shareholders include HighTower Advisors, LLC, Kovitz Investment Group Partners, LLC, Levin Capital Strategies, L.p., Citadel Advisors Llc, Satovsky Asset Management Llc, Private Advisor Group, LLC, Northern Trust Corp, Mariner, LLC, Morgan Stanley, and Geode Capital Management, Llc .
Alpha Tau Medical Ltd. (NasdaqCM:DRTS) institutional ownership structure shows current positions in the company by institutions and funds, as well as latest changes in position size. Major shareholders can include individual investors, mutual funds, hedge funds, or institutions. The Schedule 13D indicates that the investor holds (or held) more than 5% of the company and intends (or intended) to actively pursue a change in business strategy. Schedule 13G indicates a passive investment of over 5%.
The share price as of September 5, 2025 is 3.60 / share. Previously, on September 6, 2024, the share price was 2.28 / share. This represents an increase of 57.89% over that period.
Fund Sentiment Score
The Fund Sentiment Score (fka Ownership Accumulation Score) finds the stocks that are being most bought by funds. It is the result of a sophisticated, multi-factor quantitative model that identifies companies with the highest levels of institutional accumulation. The scoring model uses a combination of the total increase in disclosed owners, the changes in portfolio allocations in those owners and other metrics. The number ranges from 0 to 100, with higher numbers indicating a higher level of accumulation to its peers, and 50 being the average.
Update Frequency: Daily
See Ownership Explorer, which provides a list of highest-ranking companies.
Institutional Put/Call Ratio
In addition to reporting standard equity and debt issues, institutions with more than 100MM assets under management must also disclose their put and call option holdings. Since put options generally indicate negative sentiment, and call options indicate positive sentiment, we can get a sense of the overall institutional sentiment by plotting the ratio of puts to calls. The chart to the right plots the historical put/call ratio for this instrument.
Using Put/Call Ratio as an indicator of investor sentiment overcomes one of the key deficiencies of using total institutional ownership, which is that a significant amount of assets under management are invested passively to track indices. Passively-managed funds do not typically buy options, so the put/call ratio indicator more closely tracks the sentiment of actively-managed funds.
13D/G Filings
We present 13D/G filings separately from the 13F filings because of the different treatement by the SEC. 13D/G filings can be filed by groups of investors (with one leading), whereas 13F filings cannot. This results in situations where an investor may file a 13D/G reporting one value for the total shares (representing all the shares owned by the investor group), but then file a 13F reporting a different value for the total shares (representing strictly their own ownership). This means that share ownership of 13D/G filings and 13F filings are oftentimes not directly comparable, so we present them separately.
Note: As of May 16, 2021, we no longer show owners that have not filed a 13D/G within the last year. Previously, we were showing the full history of 13D/G filings. In general, entities that are required to file 13D/G filings must file at least annually before submitting a closing filing. However, funds sometimes exit positions without submitting a closing filing (ie, they wind down), so displaying the full history sometimes resulted in confusion about the current ownership. To prevent confusion, we now only show ’current’ owners - that is - owners that have filed within the last year.
Upgrade to unlock premium data.
| File Date | Form | Investor | Prev Shares |
Latest Shares |
Δ Shares (Percent) |
Ownership (Percent) |
Δ Ownership (Percent) |
|
|---|---|---|---|---|---|---|---|---|
| 2025-07-24 | Sofer Uzi | 13,702,361 | 15.80 | |||||
| 2025-05-01 | ORAMED PHARMACEUTICALS INC. | 14,110,121 | 19.99 |
13F and NPORT Filings
Detail on 13F filings are free. Detail on NP filings require a premium membership. Green rows indicate new positions. Red rows indicate closed positions. Click the link icon to see the full transaction history.
Upgrade
to unlock premium data and export to Excel ![]() .
.
| File Date | Source | Investor | Type | Avg Price (Est) |
Shares | Δ Shares (%) |
Reported Value ($1000) |
Δ Value (%) |
Port Alloc (%) |
|
|---|---|---|---|---|---|---|---|---|---|---|
| 2025-08-08 | 13F | Geode Capital Management, Llc | 37,893 | 0.00 | 118 | 24.21 | ||||
| 2025-08-14 | 13F | Citadel Advisors Llc | 66,479 | 11.08 | 207 | 38.00 | ||||
| 2025-08-12 | 13F | Proequities, Inc. | 0 | 0 | ||||||
| 2025-08-14 | 13F | Kovitz Investment Group Partners, LLC | 204,834 | -9.49 | 639 | 12.50 | ||||
| 2025-08-15 | 13F | Equitable Holdings, Inc. | 10,000 | 0.00 | 31 | 24.00 | ||||
| 2025-08-14 | 13F | UBS Group AG | 33,319 | 0.91 | 104 | 25.61 | ||||
| 2025-08-11 | 13F | HighTower Advisors, LLC | 686,554 | 197.59 | 2,142 | 269.95 | ||||
| 2025-08-13 | 13F | Satovsky Asset Management Llc | 53,606 | 0.00 | 167 | 24.63 | ||||
| 2025-08-14 | 13F | Mariner, LLC | 43,121 | 7.48 | 135 | 34.00 | ||||
| 2025-08-05 | 13F | Levin Capital Strategies, L.p. | 192,514 | -13.48 | 601 | 7.53 | ||||
| 2025-07-14 | 13F | Opal Wealth Advisors, LLC | 10,000 | 0.00 | 31 | 24.00 | ||||
| 2025-07-29 | 13F | Financial Guidance Group, Inc. | 21,945 | 0.00 | 68 | 23.64 | ||||
| 2025-07-22 | 13F | USAdvisors Wealth Management, LLC | 0 | -100.00 | 0 | |||||
| 2025-08-13 | 13F | Renaissance Technologies Llc | 29,400 | 92 | ||||||
| 2025-08-12 | 13F | Steward Partners Investment Advisory, Llc | 3,300 | -7.04 | 10 | 25.00 | ||||
| 2025-08-01 | 13F | Bessemer Group Inc | 3,720 | 0.00 | 0 | |||||
| 2025-08-13 | 13F | Northern Trust Corp | 45,556 | 0.96 | 142 | 25.66 | ||||
| 2025-08-14 | 13F | Raymond James Financial Inc | 1,240 | 4 | ||||||
| 2025-08-14 | 13F | Bank Of America Corp /de/ | 780 | 0.00 | 2 | 100.00 | ||||
| 2025-08-11 | 13F | Private Advisor Group, LLC | 47,583 | 0.00 | 148 | 24.37 | ||||
| 2025-08-11 | 13F | Aptus Capital Advisors, LLC | 21,945 | 0.00 | 68 | 23.64 | ||||
| 2025-08-14 | 13F | Wells Fargo & Company/mn | 2,500 | 8 | ||||||
| 2025-08-14 | 13F | Atom Investors LP | 25,773 | 15.76 | 80 | 45.45 | ||||
| 2025-07-21 | 13F | Tower View Investment Management & Research LLC | 5,566 | 0.00 | 17 | 30.77 | ||||
| 2025-08-15 | 13F | Morgan Stanley | 38,550 | -11.05 | 120 | 11.11 | ||||
| 2025-05-02 | 13F | SBI Securities Co., Ltd. | 0 | -100.00 | 0 | |||||
| 2025-05-15 | 13F | Cantor Fitzgerald, L. P. | 0 | -100.00 | 0 | |||||
| 2025-09-04 | 13F/A | Advisor Group Holdings, Inc. | 515 | 28.75 | 2 | 0.00 | ||||
| 2025-08-12 | 13F | XTX Topco Ltd | 0 | -100.00 | 0 |