Basic Stats
| Institutional Owners | 140 total, 140 long only, 0 short only, 0 long/short - change of 13.71% MRQ |
| Average Portfolio Allocation | 0.5567 % - change of 25.04% MRQ |
| Institutional Shares (Long) | 12,025,496 (ex 13D/G) - change of 3.02MM shares 33.58% MRQ |
| Institutional Value (Long) | $ 583,643 USD ($1000) |
Institutional Ownership and Shareholders
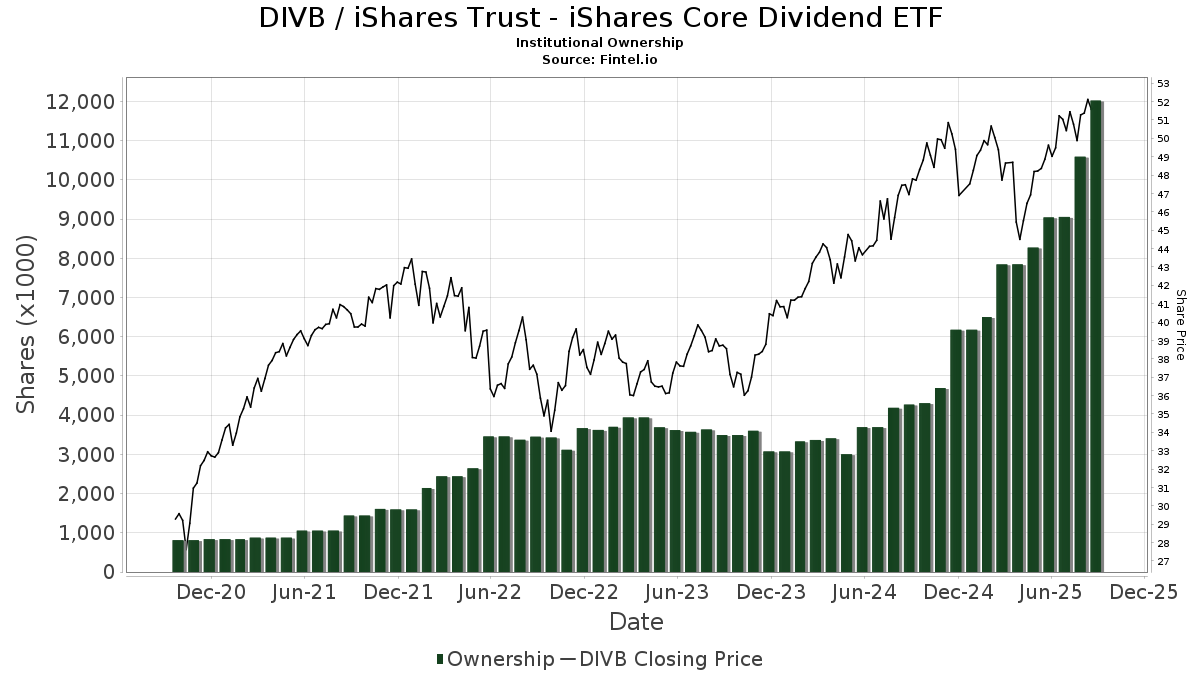
iShares Trust - iShares Core Dividend ETF (US:DIVB) has 140 institutional owners and shareholders that have filed 13D/G or 13F forms with the Securities Exchange Commission (SEC). These institutions hold a total of 12,025,496 shares. Largest shareholders include LPL Financial LLC, E Six Thirteen, Llc, Bank Of America Corp /de/, Steward Partners Investment Advisory, Llc, Foguth Wealth Management, LLC., IAG Wealth Partners, LLC, Signal Advisors Wealth, LLC, CI Private Wealth, LLC, Segall Bryant & Hamill, Llc, and Cetera Investment Advisers .
iShares Trust - iShares Core Dividend ETF (BATS:DIVB) institutional ownership structure shows current positions in the company by institutions and funds, as well as latest changes in position size. Major shareholders can include individual investors, mutual funds, hedge funds, or institutions. The Schedule 13D indicates that the investor holds (or held) more than 5% of the company and intends (or intended) to actively pursue a change in business strategy. Schedule 13G indicates a passive investment of over 5%.
The share price as of September 8, 2025 is 51.57 / share. Previously, on September 9, 2024, the share price was 47.07 / share. This represents an increase of 9.56% over that period.
Fund Sentiment Score
The Fund Sentiment Score (fka Ownership Accumulation Score) finds the stocks that are being most bought by funds. It is the result of a sophisticated, multi-factor quantitative model that identifies companies with the highest levels of institutional accumulation. The scoring model uses a combination of the total increase in disclosed owners, the changes in portfolio allocations in those owners and other metrics. The number ranges from 0 to 100, with higher numbers indicating a higher level of accumulation to its peers, and 50 being the average.
Update Frequency: Daily
See Ownership Explorer, which provides a list of highest-ranking companies.
Institutional Put/Call Ratio
In addition to reporting standard equity and debt issues, institutions with more than 100MM assets under management must also disclose their put and call option holdings. Since put options generally indicate negative sentiment, and call options indicate positive sentiment, we can get a sense of the overall institutional sentiment by plotting the ratio of puts to calls. The chart to the right plots the historical put/call ratio for this instrument.
Using Put/Call Ratio as an indicator of investor sentiment overcomes one of the key deficiencies of using total institutional ownership, which is that a significant amount of assets under management are invested passively to track indices. Passively-managed funds do not typically buy options, so the put/call ratio indicator more closely tracks the sentiment of actively-managed funds.
13D/G Filings
We present 13D/G filings separately from the 13F filings because of the different treatement by the SEC. 13D/G filings can be filed by groups of investors (with one leading), whereas 13F filings cannot. This results in situations where an investor may file a 13D/G reporting one value for the total shares (representing all the shares owned by the investor group), but then file a 13F reporting a different value for the total shares (representing strictly their own ownership). This means that share ownership of 13D/G filings and 13F filings are oftentimes not directly comparable, so we present them separately.
Note: As of May 16, 2021, we no longer show owners that have not filed a 13D/G within the last year. Previously, we were showing the full history of 13D/G filings. In general, entities that are required to file 13D/G filings must file at least annually before submitting a closing filing. However, funds sometimes exit positions without submitting a closing filing (ie, they wind down), so displaying the full history sometimes resulted in confusion about the current ownership. To prevent confusion, we now only show ’current’ owners - that is - owners that have filed within the last year.
Upgrade to unlock premium data.
| File Date | Form | Investor | Prev Shares |
Latest Shares |
Δ Shares (Percent) |
Ownership (Percent) |
Δ Ownership (Percent) |
|
|---|---|---|---|---|---|---|---|---|
| 2025-04-24 | SEGALL BRYANT & HAMILL, LLC | 529,863 | 448,599 | -15.34 | 0.30 | -96.15 |
13F and NPORT Filings
Detail on 13F filings are free. Detail on NP filings require a premium membership. Green rows indicate new positions. Red rows indicate closed positions. Click the link icon to see the full transaction history.
Upgrade
to unlock premium data and export to Excel ![]() .
.
| File Date | Source | Investor | Type | Avg Price (Est) |
Shares | Δ Shares (%) |
Reported Value ($1000) |
Δ Value (%) |
Port Alloc (%) |
|
|---|---|---|---|---|---|---|---|---|---|---|
| 2025-08-14 | 13F | Royal Bank Of Canada | 115,060 | -43.67 | 5,790 | -41.57 | ||||
| 2025-07-29 | 13F | Harbor Asset Planning, Inc. | 1,980 | 100 | ||||||
| 2025-07-22 | 13F | Peoples Bank /oh | 32,602 | 1,641 | ||||||
| 2025-08-11 | 13F | Greykasell Wealth Strategies, Inc. | 0 | -100.00 | 0 | |||||
| 2025-07-28 | 13F | Harbour Investments, Inc. | 1,592 | 0.25 | 80 | 3.90 | ||||
| 2025-08-04 | 13F | Pensionmark Financial Group, Llc | 28,310 | -11.68 | 1,425 | -8.42 | ||||
| 2025-08-08 | 13F | Citizens Financial Group Inc/ri | 7,465 | 376 | ||||||
| 2025-08-04 | 13F | Flagship Harbor Advisors, Llc | 23,861 | -2.72 | 1,201 | 0.84 | ||||
| 2025-08-14 | 13F | Ancora Advisors, LLC | 0 | -100.00 | 0 | |||||
| 2025-07-09 | 13F | Breakwater Capital Group | 82,823 | 30.21 | 4,168 | 35.03 | ||||
| 2025-08-08 | 13F | Avantax Advisory Services, Inc. | 8,117 | 25.26 | 408 | 29.94 | ||||
| 2025-07-30 | 13F | Pacific Sun Financial Corp | 4,010 | 202 | ||||||
| 2025-08-01 | 13F | Taylor Financial Group, Inc. | 69,785 | 12.35 | 3,512 | 16.53 | ||||
| 2025-08-14 | 13F | Susquehanna International Group, Llp | 28,768 | -75.52 | 1,448 | -74.62 | ||||
| 2025-08-13 | 13F | Twin Peaks Wealth Advisors, LLC | 824 | 42 | ||||||
| 2025-08-14 | 13F | Great Valley Advisor Group, Inc. | 36,878 | 454.64 | 1,855 | 476.09 | ||||
| 2025-08-12 | 13F | Argent Trust Co | 56,981 | 0.58 | 2,867 | 4.33 | ||||
| 2025-08-08 | 13F | Foundations Investment Advisors, LLC | 12,501 | 629 | ||||||
| 2025-08-06 | 13F | Golden State Wealth Management, LLC | 90 | 42.86 | 5 | 33.33 | ||||
| 2025-07-24 | 13F | Capital Advisors, Ltd. LLC | 6,181 | 0.06 | 0 | |||||
| 2025-08-12 | 13F | Gladstone Institutional Advisory LLC | 13,332 | 99.55 | 671 | 106.79 | ||||
| 2025-08-14 | 13F | Raymond James Financial Inc | 41,181 | -16.11 | 2,072 | -12.98 | ||||
| 2025-08-13 | 13F | Continuum Advisory, LLC | 17,188 | 1.14 | 865 | 4.85 | ||||
| 2025-08-14 | 13F | Goldman Sachs Group Inc | 0 | -100.00 | 0 | |||||
| 2025-07-28 | 13F | SFG Wealth Management, LLC. | 0 | -100.00 | 0 | |||||
| 2025-07-23 | 13F | REAP Financial Group, LLC | 10 | 0.00 | 1 | |||||
| 2025-08-11 | 13F | Aptus Capital Advisors, LLC | 4,976 | 1.36 | 250 | 5.04 | ||||
| 2025-05-09 | 13F | GeoWealth Management, LLC | 0 | -100.00 | 0 | |||||
| 2025-07-30 | 13F | Princeton Global Asset Management LLC | 21,209 | 0.00 | 1,067 | 3.69 | ||||
| 2025-07-25 | 13F | Kellett Schaffner Wealth Advisors LLC | 27,677 | 116.79 | 1,393 | 124.88 | ||||
| 2025-08-06 | 13F | RFG - Bristol Wealth Advisors, LLC | 6,146 | 309 | ||||||
| 2025-07-30 | 13F | Bogart Wealth, LLC | 1,100 | 37.50 | 55 | 44.74 | ||||
| 2025-07-08 | 13F | RMR Wealth Builders | 5,567 | -2.98 | 280 | 0.72 | ||||
| 2025-07-07 | 13F | TruWealth Advisors, LLC | 4,951 | -1.94 | 249 | 2.05 | ||||
| 2025-08-08 | 13F | Larson Financial Group LLC | 38,352 | 8.51 | 1,930 | 12.54 | ||||
| 2025-07-15 | 13F | Aspire Capital Advisors LLC | 183,013 | 3.50 | 9,209 | 7.34 | ||||
| 2025-08-15 | 13F | Kestra Advisory Services, LLC | 179,341 | 216.29 | 9,024 | 228.03 | ||||
| 2025-07-24 | 13F | Galvin, Gaustad & Stein, LLC | 42,361 | -1.00 | 2,132 | 2.65 | ||||
| 2025-08-12 | 13F | Steward Partners Investment Advisory, Llc | 630,300 | 53.54 | 31,717 | 59.23 | ||||
| 2025-08-14 | 13F | Federation des caisses Desjardins du Quebec | 220 | 0.00 | 11 | 10.00 | ||||
| 2025-08-05 | 13F | ADG Wealth Management Group, LLC | 18,192 | 0.07 | 915 | 3.74 | ||||
| 2025-07-25 | 13F | Sequoia Financial Advisors, LLC | 0 | -100.00 | 0 | |||||
| 2025-08-14 | 13F/A | Skopos Labs, Inc. | 34 | 2 | ||||||
| 2025-07-14 | 13F | U.S. Capital Wealth Advisors, LLC | 11,807 | 0.00 | 594 | 3.85 | ||||
| 2025-08-11 | 13F | Walter & Keenan Financial Consulting Co /mi/ /adv | 4,500 | 0.00 | 226 | 3.67 | ||||
| 2025-08-13 | 13F | Dana Investment Advisors, Inc. | 12,400 | 40.72 | 624 | 45.90 | ||||
| 2025-08-11 | 13F | Private Advisor Group, LLC | 7,370 | -0.54 | 371 | 3.06 | ||||
| 2025-08-05 | 13F | MidAtlantic Capital Management, Inc. | 21,318 | 1,073 | ||||||
| 2025-07-30 | 13F | Advantage Trust Co | 375 | 19 | ||||||
| 2025-08-04 | 13F | Integrity Alliance, Llc. | 165,633 | -42.08 | 8,335 | -39.93 | ||||
| 2025-07-21 | 13F | Ameritas Advisory Services, LLC | 1,028 | 52 | ||||||
| 2025-08-06 | 13F | Founders Financial Securities Llc | 4,727 | 238 | ||||||
| 2025-08-06 | 13F | Csenge Advisory Group | 5,302 | -16.46 | 257 | -9.82 | ||||
| 2025-08-13 | 13F | Capital Analysts, Inc. | 0 | -100.00 | 0 | |||||
| 2025-08-13 | 13F | Mount Yale Investment Advisors, LLC | 1,248 | 63 | ||||||
| 2025-08-14 | 13F | Citadel Advisors Llc | 22,092 | 335.05 | 1,112 | 351.63 | ||||
| 2025-08-14 | 13F | Money Concepts Capital Corp | 80,815 | 160.36 | 4,067 | 169.99 | ||||
| 2025-07-17 | 13F | KWB Wealth | 4,924 | 0.33 | 239 | 2.59 | ||||
| 2025-08-12 | 13F | Global Retirement Partners, LLC | 4,248 | -3.23 | 214 | 2.40 | ||||
| 2025-08-13 | 13F | IAG Wealth Partners, LLC | 512,957 | 25,812 | ||||||
| 2025-08-14 | 13F | IHT Wealth Management, LLC | 31,565 | -26.90 | 1,588 | -24.20 | ||||
| 2025-07-17 | 13F | Prepared Retirement Institute LLC | 38,051 | 9.12 | 1,915 | 13.19 | ||||
| 2025-07-22 | 13F | Valley National Advisers Inc | 5,955 | 15.79 | 0 | |||||
| 2025-07-28 | 13F | Axxcess Wealth Management, Llc | 13,988 | 704 | ||||||
| 2025-08-11 | 13F | Western Wealth Management, LLC | 26,904 | 41.99 | 1,354 | 47.23 | ||||
| 2025-08-14 | 13F | MidWestOne Financial Group, Inc. | 75,450 | 0.23 | 3,797 | 3.94 | ||||
| 2025-07-17 | 13F | Sound Income Strategies, LLC | 240 | -57.07 | 12 | -55.56 | ||||
| 2025-08-08 | 13F | Kingsview Wealth Management, LLC | 19,783 | 12.99 | 996 | 17.20 | ||||
| 2025-08-12 | 13F | Proequities, Inc. | 0 | 0 | ||||||
| 2025-08-28 | NP | ACMAX - Absolute Capital Defender Fund Class A Shares | 42,000 | 0.00 | 2,113 | 3.73 | ||||
| 2025-07-28 | 13F | BRYN MAWR TRUST Co | 594 | 0.00 | 30 | 3.57 | ||||
| 2025-08-14 | 13F | Integrated Wealth Concepts LLC | 14,707 | 7.39 | 740 | 11.45 | ||||
| 2025-07-14 | 13F | AdvisorNet Financial, Inc | 7,290 | -5.00 | 367 | -1.61 | ||||
| 2025-08-19 | 13F | Advisory Services Network, LLC | 8,632 | 60.86 | 433 | 66.15 | ||||
| 2025-07-22 | 13F | Cedar Mountain Advisors, LLC | 98,487 | 3.06 | 4,956 | 6.88 | ||||
| 2025-08-01 | 13F | Envestnet Asset Management Inc | 51,190 | 5.77 | 2,576 | 9.67 | ||||
| 2025-08-14 | 13F | Wells Fargo & Company/mn | 2,830 | 0.00 | 142 | 3.65 | ||||
| 2025-08-15 | 13F | CI Private Wealth, LLC | 453,781 | 0.42 | 22,834 | 4.15 | ||||
| 2025-07-09 | 13F | Beacon Financial Group | 0 | -100.00 | 0 | |||||
| 2025-07-30 | 13F/A | KPP Advisory Services LLC | 26,457 | -4.60 | 1,331 | -1.04 | ||||
| 2025-07-17 | 13F | San Luis Wealth Advisors LLC | 158,542 | 8 | ||||||
| 2025-08-14 | 13F | Sunbelt Securities, Inc. | 555 | -19.91 | 26 | -21.21 | ||||
| 2025-07-29 | 13F | Private Trust Co Na | 3,881 | 21.13 | 195 | 25.81 | ||||
| 2025-08-15 | 13F | Tower Research Capital LLC (TRC) | 8,441 | -60.32 | 425 | -58.91 | ||||
| 2025-08-08 | 13F | Advisors Capital Management, LLC | 73,790 | 1.43 | 3,713 | 5.21 | ||||
| 2025-07-17 | 13F | Tempus Wealth Planning, LLC | 18,203 | -7.51 | 916 | -4.09 | ||||
| 2025-08-14 | 13F | Fmr Llc | 2,670 | -10.49 | 134 | -6.94 | ||||
| 2025-04-25 | 13F | Stonebridge Financial Group, LLC | 0 | -100.00 | 0 | |||||
| 2025-08-14 | 13F | Mariner, LLC | 50,555 | 22.92 | 2,544 | 27.47 | ||||
| 2025-07-14 | 13F | Masso Torrence Wealth Management Inc. | 237,358 | 5.36 | 11,944 | 9.27 | ||||
| 2025-07-25 | 13F | M3 Advisory Group, LLC | 4,095 | 206 | ||||||
| 2025-08-08 | 13F | Cetera Investment Advisers | 429,967 | 196.17 | 21,636 | 207.18 | ||||
| 2025-08-15 | 13F | Morgan Stanley | 58,952 | -0.63 | 2,966 | 3.06 | ||||
| 2025-08-27 | 13F/A | Brinker Capital Investments, LLC | 6,685 | 6.43 | 336 | 10.53 | ||||
| 2025-05-28 | 13F | Intrua Financial, LLC | 0 | -100.00 | 0 | -100.00 | ||||
| 2025-08-08 | 13F | Compass Financial Services Inc | 117,357 | 12.04 | 5,905 | 16.19 | ||||
| 2025-08-12 | 13F | Change Path, LLC | 20,837 | -9.25 | 1,049 | -5.92 | ||||
| 2025-08-13 | 13F | Integrity Investment Advisors, LLC | 13,802 | 0.59 | 695 | 4.36 | ||||
| 2025-08-14 | 13F | Bank Of America Corp /de/ | 708,560 | 16.55 | 35,655 | 20.87 | ||||
| 2025-08-12 | 13F | LPL Financial LLC | 2,254,861 | 14.25 | 113,465 | 18.49 | ||||
| 2025-08-11 | 13F | PFG Private Wealth Management, LLC | 6,871 | 0.00 | 346 | 3.60 | ||||
| 2025-08-12 | 13F | J.w. Cole Advisors, Inc. | 9,319 | 469 | ||||||
| 2025-08-04 | 13F | Assetmark, Inc | 0 | 0 | ||||||
| 2025-07-31 | 13F | Oppenheimer & Co Inc | 0 | -100.00 | 0 | |||||
| 2025-08-13 | 13F | Cerity Partners LLC | 6,355 | -5.47 | 320 | -2.15 | ||||
| 2025-05-15 | 13F/A | Orion Portfolio Solutions, LLC | 6,281 | 305 | ||||||
| 2025-07-29 | 13F | Liberty Square Wealth Partners Llc | 10,415 | 4.15 | 524 | 8.04 | ||||
| 2025-08-12 | 13F | Financial Advocates Investment Management | 68,694 | -12.12 | 3,457 | -8.86 | ||||
| 2025-09-04 | 13F/A | Advisor Group Holdings, Inc. | 34,357 | 9.01 | 1,729 | 13.02 | ||||
| 2025-07-22 | 13F | Foguth Wealth Management, LLC. | 514,163 | -20.16 | 25,873 | -17.20 | ||||
| 2025-08-15 | 13F/A | Florida Financial Advisors, Llc | 5,226 | 3.18 | 263 | 6.94 | ||||
| 2025-07-28 | 13F | Rosenberg Matthew Hamilton | 1,066 | 0.00 | 54 | 3.92 | ||||
| 2025-05-12 | 13F | Independent Advisor Alliance | 0 | -100.00 | 0 | |||||
| 2025-08-13 | 13F | Shepherd Financial Partners LLC | 5,097 | 0.00 | 256 | 3.64 | ||||
| 2025-07-25 | 13F | Iron Financial, LLC | 17,547 | 883 | ||||||
| 2025-08-04 | 13F | Spire Wealth Management | 2,990 | 150 | ||||||
| 2025-08-15 | 13F | Brooks, Moore & Associates, Inc. | 5,470 | 274 | ||||||
| 2025-07-07 | 13F | Capital Asset Advisory Services LLC | 13,988 | 713 | ||||||
| 2025-07-10 | 13F | Wealth Enhancement Advisory Services, Llc | 17,100 | 1.03 | 880 | 7.06 | ||||
| 2025-07-25 | 13F | Atria Wealth Solutions, Inc. | 0 | -100.00 | 0 | |||||
| 2025-08-08 | 13F | IMA Wealth, Inc. | 95 | 0.00 | 5 | 0.00 | ||||
| 2025-08-14 | 13F | Mml Investors Services, Llc | 0 | -100.00 | 0 | |||||
| 2025-05-06 | 13F | AE Wealth Management LLC | 0 | -100.00 | 0 | -100.00 | ||||
| 2025-08-08 | 13F | Pnc Financial Services Group, Inc. | 1,000 | 0.00 | 50 | 4.17 | ||||
| 2025-08-05 | 13F | GPS Wealth Strategies Group, LLC | 1,471 | -0.07 | 74 | 4.23 | ||||
| 2025-08-13 | 13F | Northwestern Mutual Wealth Management Co | 54,289 | 129.94 | 2,732 | 138.52 | ||||
| 2025-08-14 | 13F | CoreCap Advisors, LLC | 5,876 | -7.48 | 296 | -4.22 | ||||
| 2025-08-01 | 13F | Liberty Wealth Management Llc | 4,906 | 0.59 | 247 | 4.24 | ||||
| 2025-08-11 | 13F | Principal Securities, Inc. | 2,780 | -8.91 | 140 | -3.47 | ||||
| 2025-07-11 | 13F | Farther Finance Advisors, LLC | 3,415 | 172 | ||||||
| 2025-07-29 | 13F | Stratos Wealth Partners, LTD. | 15,791 | 124.40 | 795 | 132.84 | ||||
| 2025-08-28 | NP | AAMAX - Absolute Capital Asset Allocator Fund Class A Shares | 79,000 | 0.00 | 3,975 | 3.70 | ||||
| 2025-08-05 | 13F | Key FInancial Inc | 4,693 | 0.00 | 236 | 3.96 | ||||
| 2025-08-13 | 13F | Colonial Trust Co / SC | 1,347 | 68 | ||||||
| 2025-07-24 | 13F | Tandem Capital Management Corp /adv | 10,825 | 0.00 | 545 | 3.62 | ||||
| 2025-08-13 | 13F | West Chester Capital Advisors, Inc | 5,191 | -0.06 | 261 | 3.57 | ||||
| 2025-08-14 | 13F | GWM Advisors LLC | 804 | 28.85 | 40 | 33.33 | ||||
| 2025-05-14 | 13F | Jane Street Group, Llc | 0 | -100.00 | 0 | |||||
| 2025-07-10 | 13F | Focus Financial Network, Inc. | 4,911 | -22.04 | 247 | -19.02 | ||||
| 2025-07-16 | 13F | Meridian Financial, LLC | 7,840 | -2.37 | 395 | 1.29 | ||||
| 2025-07-17 | 13F | E Six Thirteen, Llc | 1,560,380 | 78,518 | ||||||
| 2025-08-12 | 13F | Segall Bryant & Hamill, Llc | 437,301 | -2.52 | 22,005 | 1.10 | ||||
| 2025-08-12 | 13F | Jpmorgan Chase & Co | 130,774 | 54.26 | 6,581 | 59.98 | ||||
| 2025-04-29 | 13F | Element Wealth, LLC | 0 | -100.00 | 0 | |||||
| 2025-08-12 | 13F | Absolute Capital Management, LLC | 121,000 | 0.00 | 6,089 | 3.71 | ||||
| 2025-08-15 | 13F | Equitable Holdings, Inc. | 6,501 | 20.66 | 327 | 25.29 | ||||
| 2025-07-25 | 13F | NorthRock Partners, LLC | 17,107 | 861 | ||||||
| 2025-07-10 | 13F | Signal Advisors Wealth, LLC | 504,213 | -16.29 | 25,372 | -13.18 | ||||
| 2025-08-06 | 13F | Commonwealth Equity Services, Llc | 187,364 | 6.56 | 9 | 12.50 | ||||
| 2025-05-14 | 13F | CIBC Private Wealth Group, LLC | 0 | -100.00 | 0 | |||||
| 2025-07-31 | 13F | Cambridge Investment Research Advisors, Inc. | 38,529 | -45.12 | 2 | -66.67 | ||||
| 2025-07-29 | 13F | Crux Wealth Advisors | 0 | -100.00 | 0 | |||||
| 2025-07-24 | 13F | Us Bancorp \de\ | 5,400 | 0.00 | 272 | 3.44 | ||||
| 2025-08-04 | 13F | IFG Advisory, LLC | 324,168 | -0.87 | 16,312 | 2.80 | ||||
| 2025-08-05 | 13F | Bank Of Montreal /can/ | 83 | -8.79 | 4 | 0.00 | ||||
| 2025-04-15 | 13F | Collier Financial | 5,692 | 276 | ||||||
| 2025-07-10 | 13F | Sovran Advisors, LLC | 27,273 | 9.91 | 1,392 | 24.73 | ||||
| 2025-08-14 | 13F | UBS Group AG | 249 | 13 | ||||||
| 2025-08-04 | 13F | Hantz Financial Services, Inc. | 34 | 0 | ||||||
| 2025-07-17 | 13F | Janney Montgomery Scott LLC | 29,266 | 53.31 | 1 | |||||
| 2025-07-16 | 13F | Signaturefd, Llc | 252 | 47.37 | 13 | 50.00 |