Basic Stats
| Institutional Owners | 122 total, 122 long only, 0 short only, 0 long/short - change of 3.33% MRQ |
| Average Portfolio Allocation | 0.0607 % - change of -20.84% MRQ |
| Institutional Shares (Long) | 10,226,244 (ex 13D/G) - change of 0.91MM shares 9.73% MRQ |
| Institutional Value (Long) | $ 172,870 USD ($1000) |
Institutional Ownership and Shareholders
Global X Funds - Global X SuperDividend U.S. ETF (US:DIV) has 122 institutional owners and shareholders that have filed 13D/G or 13F forms with the Securities Exchange Commission (SEC). These institutions hold a total of 10,226,244 shares. Largest shareholders include FUKOKU MUTUAL LIFE INSURANCE Co, Morgan Stanley, AE Wealth Management LLC, LPL Financial LLC, Wells Fargo & Company/mn, Bank Of America Corp /de/, Global X Japan Co., Ltd., Wealthfront Advisers Llc, Northwestern Mutual Wealth Management Co, and Commonwealth Equity Services, Llc .
Global X Funds - Global X SuperDividend U.S. ETF (ARCA:DIV) institutional ownership structure shows current positions in the company by institutions and funds, as well as latest changes in position size. Major shareholders can include individual investors, mutual funds, hedge funds, or institutions. The Schedule 13D indicates that the investor holds (or held) more than 5% of the company and intends (or intended) to actively pursue a change in business strategy. Schedule 13G indicates a passive investment of over 5%.
The share price as of September 8, 2025 is 17.65 / share. Previously, on September 9, 2024, the share price was 18.22 / share. This represents a decline of 3.16% over that period.

Fund Sentiment Score
The Fund Sentiment Score (fka Ownership Accumulation Score) finds the stocks that are being most bought by funds. It is the result of a sophisticated, multi-factor quantitative model that identifies companies with the highest levels of institutional accumulation. The scoring model uses a combination of the total increase in disclosed owners, the changes in portfolio allocations in those owners and other metrics. The number ranges from 0 to 100, with higher numbers indicating a higher level of accumulation to its peers, and 50 being the average.
Update Frequency: Daily
See Ownership Explorer, which provides a list of highest-ranking companies.
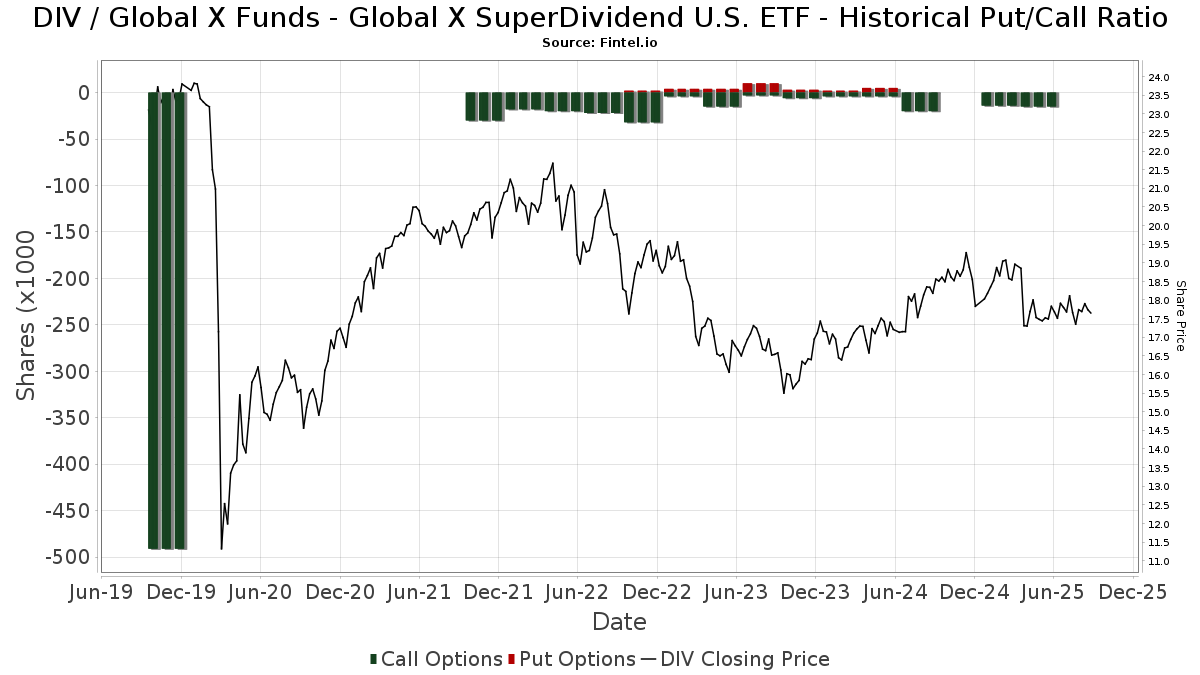
Institutional Put/Call Ratio
In addition to reporting standard equity and debt issues, institutions with more than 100MM assets under management must also disclose their put and call option holdings. Since put options generally indicate negative sentiment, and call options indicate positive sentiment, we can get a sense of the overall institutional sentiment by plotting the ratio of puts to calls. The chart to the right plots the historical put/call ratio for this instrument.
Using Put/Call Ratio as an indicator of investor sentiment overcomes one of the key deficiencies of using total institutional ownership, which is that a significant amount of assets under management are invested passively to track indices. Passively-managed funds do not typically buy options, so the put/call ratio indicator more closely tracks the sentiment of actively-managed funds.
13F and NPORT Filings
Detail on 13F filings are free. Detail on NP filings require a premium membership. Green rows indicate new positions. Red rows indicate closed positions. Click the link icon to see the full transaction history.
Upgrade
to unlock premium data and export to Excel ![]() .
.
| File Date | Source | Investor | Type | Avg Price (Est) |
Shares | Δ Shares (%) |
Reported Value ($1000) |
Δ Value (%) |
Port Alloc (%) |
|
|---|---|---|---|---|---|---|---|---|---|---|
| 2025-08-08 | 13F | Creative Planning | 16,065 | -2.44 | 282 | -9.03 | ||||
| 2025-07-21 | 13F | Curran Financial Partners, LLC | 121,947 | -65.16 | 2,144 | -67.50 | ||||
| 2025-07-21 | 13F | Crews Bank & Trust | 7,305 | 0.00 | 128 | -6.57 | ||||
| 2025-08-14 | 13F | UBS Group AG | 40,512 | 14.95 | 712 | 7.39 | ||||
| 2025-08-11 | 13F | Private Advisor Group, LLC | 11,608 | 4.48 | 204 | -2.39 | ||||
| 2025-08-14 | 13F | Qube Research & Technologies Ltd | 303 | 10,000.00 | 5 | |||||
| 2025-07-18 | 13F | PFG Investments, LLC | 11,189 | -22.42 | 197 | -27.68 | ||||
| 2025-07-17 | 13F | Janney Montgomery Scott LLC | 35,832 | -3.84 | 1 | |||||
| 2025-07-11 | 13F | Caldwell Securities, Inc | 100 | 0.00 | 2 | 0.00 | ||||
| 2025-07-18 | 13F | Truist Financial Corp | 19,724 | -0.48 | 347 | -7.24 | ||||
| 2025-08-12 | 13F | Jpmorgan Chase & Co | 42,154 | -3.40 | 741 | -9.85 | ||||
| 2025-07-17 | 13F | C2C Wealth Management, LLC | 19,000 | 0.00 | 334 | -6.44 | ||||
| 2025-08-14 | 13F | Two Sigma Investments, Lp | 121,300 | 98.85 | 2,132 | 85.55 | ||||
| 2025-07-25 | 13F | Cwm, Llc | 16,119 | 0.00 | 0 | |||||
| 2025-08-05 | 13F | GPS Wealth Strategies Group, LLC | 4,639 | 366.23 | 82 | 350.00 | ||||
| 2025-04-30 | 13F | Slagle Financial, LLC | 0 | -100.00 | 0 | -100.00 | ||||
| 2025-04-29 | 13F | Wood Tarver Financial Group, LLC | 0 | -100.00 | 0 | |||||
| 2025-07-31 | 13F | Wealthfront Advisers Llc | 304,537 | 5.08 | 5,354 | -1.96 | ||||
| 2025-07-31 | 13F | Cambridge Investment Research Advisors, Inc. | 92,713 | -0.44 | 2 | 0.00 | ||||
| 2025-07-21 | 13F | Ntv Asset Management Llc | 24,725 | -7.48 | 435 | -13.72 | ||||
| 2025-07-21 | 13F | Ameritas Advisory Services, LLC | 2,049 | 36 | ||||||
| 2025-08-14 | 13F | Goldman Sachs Group Inc | 84,097 | -0.04 | 1,478 | -6.69 | ||||
| 2025-07-28 | 13F | Mutual Advisors, LLC | 36,840 | 23.36 | 657 | 22.80 | ||||
| 2025-08-08 | 13F | Advyzon Investment Management, LLC | 25,402 | 18.47 | 447 | 10.67 | ||||
| 2025-07-14 | 13F | AdvisorNet Financial, Inc | 646 | 0.00 | 11 | -8.33 | ||||
| 2025-08-14 | 13F | Royal Bank Of Canada | 145,222 | 22.80 | 2,553 | 14.59 | ||||
| 2025-08-06 | 13F | AE Wealth Management LLC | 999,605 | 7.93 | 17,573 | 0.71 | ||||
| 2025-08-12 | 13F | Founders Financial Alliance, LLC | 11,258 | 3.44 | 198 | -3.90 | ||||
| 2025-08-07 | 13F | Kestra Private Wealth Services, Llc | 21,415 | 24.33 | 376 | 16.05 | ||||
| 2025-07-18 | 13F | Chelsea Counsel Co | 5,350 | 46.58 | 94 | 38.24 | ||||
| 2025-07-21 | 13F | Ameriflex Group, Inc. | 367 | 0.00 | 6 | 0.00 | ||||
| 2025-08-14 | 13F | Citadel Advisors Llc | Put | 0 | -100.00 | 0 | ||||
| 2025-08-08 | 13F | Wiser Advisor Group LLC | 0 | -100.00 | 0 | |||||
| 2025-07-25 | 13F | Atria Wealth Solutions, Inc. | 0 | -100.00 | 0 | |||||
| 2025-08-04 | 13F | Creekmur Asset Management LLC | 0 | 0 | ||||||
| 2025-08-04 | 13F | Joseph P. Lucia & Associates, LLC | 15,610 | -11.21 | 274 | -17.22 | ||||
| 2025-08-12 | 13F | Park Square Financial Group, LLC | 11,068 | 4.11 | 195 | -3.00 | ||||
| 2025-08-19 | 13F | Newbridge Financial Services Group, Inc. | 1,800 | -28.57 | 32 | -34.04 | ||||
| 2025-07-24 | 13F | IFP Advisors, Inc | 4,300 | -7.27 | 76 | -13.79 | ||||
| 2025-07-30 | 13F | Patten Group, Inc. | 15,625 | 0.00 | 275 | -6.80 | ||||
| 2025-08-06 | 13F | Commonwealth Equity Services, Llc | 191,027 | 2.42 | 3 | 0.00 | ||||
| 2025-08-12 | 13F | Global Retirement Partners, LLC | 28,963 | 1.18 | 509 | -1.36 | ||||
| 2025-07-11 | 13F | Global X Japan Co., Ltd. | 424,451 | 22.92 | 7,462 | 14.70 | ||||
| 2025-08-13 | 13F | SMART Wealth LLC | 163,275 | 17.84 | 2,870 | 9.96 | ||||
| 2025-08-14 | 13F | Harwood Advisory Group, LLC | 1 | 0.00 | 0 | |||||
| 2025-07-16 | 13F | Perigon Wealth Management, LLC | 10,005 | 0.00 | 176 | -6.91 | ||||
| 2025-08-12 | 13F | BlackRock, Inc. | 188 | 2.17 | 3 | 0.00 | ||||
| 2025-07-28 | 13F | RFG Advisory, LLC | 21,149 | 0.16 | 372 | -6.55 | ||||
| 2025-08-11 | 13F | Pineridge Advisors LLC | 1,819 | 0.55 | 32 | -8.82 | ||||
| 2025-08-14 | 13F | Bank Of America Corp /de/ | 704,289 | -18.33 | 12,381 | -23.80 | ||||
| 2025-08-12 | 13F | FUKOKU MUTUAL LIFE INSURANCE Co | 1,873,000 | 26.98 | 32,927 | 18.49 | ||||
| 2025-07-09 | 13F | Triumph Capital Management | 29,515 | -0.05 | 519 | -6.83 | ||||
| 2025-08-04 | 13F | Daymark Wealth Partners, Llc | 10,789 | 0.00 | 190 | -6.90 | ||||
| 2025-08-08 | 13F | Kingsview Wealth Management, LLC | 36,417 | 10.67 | 640 | 3.39 | ||||
| 2025-08-08 | 13F | Cetera Investment Advisers | 77,466 | 12.92 | 1,362 | 5.34 | ||||
| 2025-08-14 | 13F | Sequent Planning LLC | 13,047 | 229 | ||||||
| 2025-08-12 | 13F | Proequities, Inc. | 0 | 0 | ||||||
| 2025-08-06 | 13F | Walkner Condon Financial Advisors LLC | 16,650 | 0.75 | 293 | -6.11 | ||||
| 2025-08-13 | 13F | Colonial Trust Advisors | 500 | 0.00 | 9 | -11.11 | ||||
| 2025-07-29 | 13F | Stratos Wealth Partners, LTD. | 68,423 | 2.61 | 1,203 | -4.30 | ||||
| 2025-08-14 | 13F | Stifel Financial Corp | 15,150 | -3.73 | 266 | -10.14 | ||||
| 2025-07-24 | 13F | Blair William & Co/il | 1,005 | 18 | ||||||
| 2025-05-01 | 13F | Quest 10 Wealth Builders, Inc. | 22,040 | -2.18 | 415 | 2.22 | ||||
| 2025-07-15 | 13F | FLP Wealth Management, LLC | 0 | -100.00 | 0 | |||||
| 2025-08-04 | 13F | Assetmark, Inc | 5 | 0.00 | 0 | |||||
| 2025-08-08 | 13F | SBI Securities Co., Ltd. | 7,206 | 8.46 | 127 | 0.80 | ||||
| 2025-08-08 | 13F | Fortis Group Advisors, LLC | 300 | 0.00 | 5 | 0.00 | ||||
| 2025-07-24 | 13F | Us Bancorp \de\ | 5,320 | 0.00 | 94 | -7.00 | ||||
| 2025-08-15 | 13F | Tower Research Capital LLC (TRC) | 47 | 1 | ||||||
| 2025-07-21 | 13F | Monticello Wealth Management, Llc | 10,267 | 0.00 | 180 | -6.74 | ||||
| 2025-08-15 | 13F | Morgan Stanley | 1,091,703 | 10.85 | 19,192 | 3.44 | ||||
| 2025-08-13 | 13F | Northwestern Mutual Wealth Management Co | 264,502 | 526.95 | 4,650 | 485.52 | ||||
| 2025-05-06 | 13F | Venturi Wealth Management, LLC | 0 | -100.00 | 0 | |||||
| 2025-07-14 | 13F | Wealth Advisory Solutions, LLC | 24,725 | 44.17 | 435 | 34.37 | ||||
| 2025-08-12 | 13F | SRS Capital Advisors, Inc. | 64 | 0.00 | 1 | 0.00 | ||||
| 2025-07-18 | 13F | B.O.S.S. Retirement Advisors, LLC | 100,726 | -0.36 | 1,771 | -7.04 | ||||
| 2025-08-15 | 13F | Kestra Advisory Services, LLC | 18,861 | 28.64 | 332 | 19.93 | ||||
| 2025-07-31 | 13F | Buckingham Strategic Partners | 14,145 | 0.01 | 249 | -6.77 | ||||
| 2025-07-29 | 13F | Ballast, Inc. | 15,610 | 274 | ||||||
| 2025-08-06 | 13F | Hallmark Capital Management Inc | 1 | 0.00 | 0 | |||||
| 2025-08-08 | 13F | Foundations Investment Advisors, LLC | 18,415 | 1.63 | 324 | -5.28 | ||||
| 2025-09-04 | 13F/A | Advisor Group Holdings, Inc. | 148,764 | 74.54 | 2,616 | 62.83 | ||||
| 2025-08-18 | 13F/A | National Bank Of Canada /fi/ | 4,650 | 2.20 | 82 | -4.71 | ||||
| 2025-08-14 | 13F | Mariner, LLC | 28,170 | 0.44 | 495 | -6.25 | ||||
| 2025-07-11 | 13F | Farther Finance Advisors, LLC | 22,080 | 4.28 | 388 | -2.76 | ||||
| 2025-08-14 | 13F | Fmr Llc | 2,454 | -38.14 | 43 | -41.89 | ||||
| 2025-08-14 | 13F | Sunbelt Securities, Inc. | 6,900 | -0.26 | 124 | -4.62 | ||||
| 2025-08-08 | 13F/A | Sterling Capital Management LLC | 52 | 1.96 | 1 | |||||
| 2025-08-08 | 13F | Tortoise Investment Management, LLC | 1,000 | 0.00 | 18 | -5.56 | ||||
| 2025-08-05 | 13F | Huntington National Bank | 79 | -5.95 | ||||||
| 2025-07-09 | 13F | Breakwater Investment Management | 33 | 0.00 | 1 | |||||
| 2025-08-12 | 13F | CIBC Private Wealth Group, LLC | 992 | 39.52 | 17 | 54.55 | ||||
| 2025-07-14 | 13F | Caitlin John, LLC | 22,855 | 1.88 | 402 | -4.98 | ||||
| 2025-08-06 | 13F | Wedbush Securities Inc | 35,386 | -6.96 | 1 | |||||
| 2025-07-24 | 13F | Jfs Wealth Advisors, Llc | 1,544 | 0.00 | 27 | -6.90 | ||||
| 2025-07-24 | 13F | Ronald Blue Trust, Inc. | 250 | 0.00 | 4 | 0.00 | ||||
| 2025-08-12 | 13F | Steward Partners Investment Advisory, Llc | 33,408 | 12.93 | 587 | 5.39 | ||||
| 2025-08-14 | 13F | Comerica Bank | 2,644 | 0.00 | 46 | -6.12 | ||||
| 2025-08-14 | 13F | Raymond James Financial Inc | 108,546 | -20.64 | 1,908 | -25.93 | ||||
| 2025-08-14 | 13F | Citadel Advisors Llc | Call | 15,400 | 9.22 | 271 | 1.89 | |||
| 2025-08-12 | 13F | MAI Capital Management | 947 | 0.00 | 17 | -5.88 | ||||
| 2025-08-11 | 13F | HighTower Advisors, LLC | 14,817 | 29.79 | 260 | 20.93 | ||||
| 2025-08-13 | 13F | Scotia Capital Inc. | 10,888 | 0.00 | 191 | -6.83 | ||||
| 2025-08-05 | 13F | Cherry Tree Wealth Management, LLC | 1,064 | 0.00 | 19 | -10.00 | ||||
| 2025-07-07 | 13F | Teamwork Financial Advisors, LLC | 12,388 | -0.26 | 218 | -6.87 | ||||
| 2025-08-14 | 13F | Mml Investors Services, Llc | 21,131 | 2.13 | 0 | |||||
| 2025-08-11 | 13F | Principal Securities, Inc. | 4,250 | 0.00 | 75 | -2.63 | ||||
| 2025-08-13 | 13F | Transce3nd, LLC | 4,352 | 3.20 | 77 | -3.80 | ||||
| 2025-07-21 | 13F | Mirae Asset Global Investments Co., Ltd. | 124,000 | 5.08 | 2,180 | -1.40 | ||||
| 2025-04-23 | 13F | Golden State Wealth Management, LLC | 0 | -100.00 | 0 | |||||
| 2025-08-06 | 13F | New Millennium Group LLC | 91 | 0.00 | 2 | 0.00 | ||||
| 2025-07-30 | 13F | Whittier Trust Co | 50 | 0.00 | 1 | |||||
| 2025-08-12 | 13F | J.w. Cole Advisors, Inc. | 15,456 | 272 | ||||||
| 2025-08-08 | 13F | Avantax Advisory Services, Inc. | 16,192 | -14.73 | 285 | -20.45 | ||||
| 2025-08-14 | 13F | GWM Advisors LLC | 4,858 | -0.96 | 85 | -7.61 | ||||
| 2025-07-22 | 13F | Simplicity Wealth,LLC | 27,414 | 72.77 | 482 | 61.41 | ||||
| 2025-08-14 | 13F | Susquehanna International Group, Llp | 25,718 | 452 | ||||||
| 2025-08-08 | 13F | Good Life Advisors, LLC | 23,339 | 3.62 | 410 | -3.30 | ||||
| 2025-08-11 | 13F | Citigroup Inc | 600 | 0.00 | 11 | -9.09 | ||||
| 2025-07-25 | 13F | Concord Wealth Partners | 725 | 13 | ||||||
| 2025-08-11 | 13F | TRUE Private Wealth Advisors | 12,175 | -17.73 | 214 | -23.02 | ||||
| 2025-08-01 | 13F | Envestnet Asset Management Inc | 64,596 | -2.25 | 1,136 | -8.84 | ||||
| 2025-07-23 | 13F | Eagle Strategies LLC | 39,354 | 6.99 | 692 | -0.14 | ||||
| 2025-08-14 | 13F | Arete Wealth Advisors, LLC | 0 | -100.00 | 0 | |||||
| 2025-08-13 | 13F | Jones Financial Companies Lllp | 45,727 | 24.12 | 803 | 16.38 | ||||
| 2025-07-31 | 13F | Cornerstone Management, Inc. | 11,663 | 0.00 | 205 | -6.39 | ||||
| 2025-08-11 | 13F | FSA Wealth Management LLC | 365 | 1.96 | 6 | 0.00 | ||||
| 2025-07-29 | 13F | Private Trust Co Na | 2,000 | 0.00 | 35 | -5.41 | ||||
| 2025-07-30 | 13F | LifeWealth Investments, LLC | 29,689 | 25.70 | 522 | 17.34 | ||||
| 2025-08-14 | 13F | Wells Fargo & Company/mn | 775,844 | 13.50 | 13,639 | 5.91 | ||||
| 2025-07-25 | 13F | Cypress Capital Group | 25,319 | 445 | ||||||
| 2025-07-25 | 13F | Apollon Wealth Management, LLC | 0 | -100.00 | 0 | -100.00 | ||||
| 2025-08-12 | 13F | LPL Financial LLC | 925,738 | -1.31 | 16,274 | -7.91 | ||||
| 2025-04-17 | 13F | Authentikos Wealth Advisory, LLC | 0 | -100.00 | 0 | |||||
| 2025-07-14 | 13F | Painted Porch Advisors LLC | 0 | -100.00 | 0 | |||||
| 2025-08-07 | 13F | Allworth Financial LP | 185 | -30.45 | 3 | -25.00 | ||||
| 2025-03-21 | 13F | Prostatis Group LLC | 0 | -100.00 | 0 | |||||
| 2025-08-14 | 13F | Bnp Paribas Arbitrage, Sa | 0 | -100.00 | 0 | |||||
| 2025-07-16 | 13F | Squire Investment Management Company, LLC | 14,089 | 0.00 | 248 | -6.79 |