Basic Stats
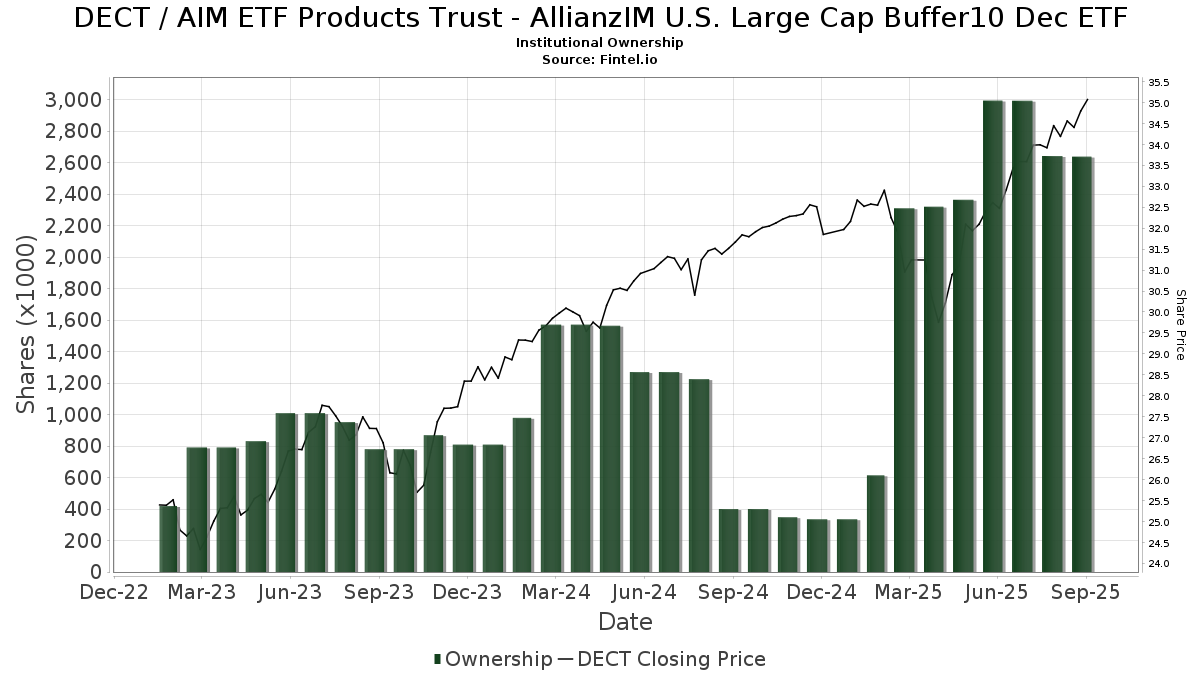
| Institutional Owners | 40 total, 40 long only, 0 short only, 0 long/short - change of -2.44% MRQ |
| Average Portfolio Allocation | 0.2700 % - change of -8.00% MRQ |
| Institutional Shares (Long) | 2,638,729 (ex 13D/G) - change of -0.36MM shares -11.87% MRQ |
| Institutional Value (Long) | $ 84,143 USD ($1000) |
Institutional Ownership and Shareholders
AIM ETF Products Trust - AllianzIM U.S. Large Cap Buffer10 Dec ETF (US:DECT) has 40 institutional owners and shareholders that have filed 13D/G or 13F forms with the Securities Exchange Commission (SEC). These institutions hold a total of 2,638,729 shares. Largest shareholders include AE Wealth Management LLC, Advisor Group Holdings, Inc., FSR Wealth Management Ltd., SMART Wealth LLC, Commonwealth Equity Services, Llc, Family Wealth Group, LLC, Raymond James Financial Inc, LPL Financial LLC, Strategic Blueprint, LLC, and WealthPlan Investment Management, LLC .
AIM ETF Products Trust - AllianzIM U.S. Large Cap Buffer10 Dec ETF (ARCA:DECT) institutional ownership structure shows current positions in the company by institutions and funds, as well as latest changes in position size. Major shareholders can include individual investors, mutual funds, hedge funds, or institutions. The Schedule 13D indicates that the investor holds (or held) more than 5% of the company and intends (or intended) to actively pursue a change in business strategy. Schedule 13G indicates a passive investment of over 5%.
The share price as of September 5, 2025 is 34.57 / share. Previously, on September 9, 2024, the share price was 31.32 / share. This represents an increase of 10.35% over that period.
Fund Sentiment Score
The Fund Sentiment Score (fka Ownership Accumulation Score) finds the stocks that are being most bought by funds. It is the result of a sophisticated, multi-factor quantitative model that identifies companies with the highest levels of institutional accumulation. The scoring model uses a combination of the total increase in disclosed owners, the changes in portfolio allocations in those owners and other metrics. The number ranges from 0 to 100, with higher numbers indicating a higher level of accumulation to its peers, and 50 being the average.
Update Frequency: Daily
See Ownership Explorer, which provides a list of highest-ranking companies.
Institutional Put/Call Ratio
In addition to reporting standard equity and debt issues, institutions with more than 100MM assets under management must also disclose their put and call option holdings. Since put options generally indicate negative sentiment, and call options indicate positive sentiment, we can get a sense of the overall institutional sentiment by plotting the ratio of puts to calls. The chart to the right plots the historical put/call ratio for this instrument.
Using Put/Call Ratio as an indicator of investor sentiment overcomes one of the key deficiencies of using total institutional ownership, which is that a significant amount of assets under management are invested passively to track indices. Passively-managed funds do not typically buy options, so the put/call ratio indicator more closely tracks the sentiment of actively-managed funds.
13F and NPORT Filings
Detail on 13F filings are free. Detail on NP filings require a premium membership. Green rows indicate new positions. Red rows indicate closed positions. Click the link icon to see the full transaction history.
Upgrade
to unlock premium data and export to Excel ![]() .
.
| File Date | Source | Investor | Type | Avg Price (Est) |
Shares | Δ Shares (%) |
Reported Value ($1000) |
Δ Value (%) |
Port Alloc (%) |
|
|---|---|---|---|---|---|---|---|---|---|---|
| 2025-07-28 | 13F | WealthPlan Investment Management, LLC | 37,626 | -85.38 | 1,256 | -84.26 | ||||
| 2025-08-14 | 13F | UBS Group AG | 1,000 | -55.75 | 33 | -52.86 | ||||
| 2025-07-30 | 13F | LifeWealth Investments, LLC | 15,969 | -5.32 | 533 | 2.11 | ||||
| 2025-08-14 | 13F/A | Barclays Plc | 5,321 | -16.62 | 0 | |||||
| 2025-07-28 | 13F | Nvest Financial, LLC | 24,370 | 0.00 | 814 | 7.68 | ||||
| 2025-08-12 | 13F | LPL Financial LLC | 54,682 | 212.34 | 1,826 | 236.72 | ||||
| 2025-08-13 | 13F | SMART Wealth LLC | 101,430 | -4.03 | 3,387 | 3.33 | ||||
| 2025-07-08 | 13F | Nbc Securities, Inc. | 500 | 0.00 | 0 | |||||
| 2025-08-06 | 13F | AE Wealth Management LLC | 1,563,358 | -0.73 | 52,201 | 6.91 | ||||
| 2025-08-14 | 13F | Raymond James Financial Inc | 55,302 | -7.37 | 1,847 | -0.27 | ||||
| 2025-07-10 | 13F | Signal Advisors Wealth, LLC | 7,792 | 260 | ||||||
| 2025-08-12 | 13F | Proequities, Inc. | 0 | 0 | ||||||
| 2025-08-06 | 13F | Csenge Advisory Group | 23,678 | 0.48 | 763 | 8.55 | ||||
| 2025-08-06 | 13F | Commonwealth Equity Services, Llc | 99,142 | 21.75 | 3 | 50.00 | ||||
| 2025-08-12 | 13F | Kaye Capital Management | 0 | -100.00 | 0 | |||||
| 2025-08-12 | 13F | Allianz Investment Management U.S. LLC | 5,000 | 0.00 | 167 | 9.93 | ||||
| 2025-08-05 | 13F | Lord & Richards Wealth Management, LLC | 0 | -100.00 | 0 | |||||
| 2025-08-04 | 13F | Family Wealth Group, LLC | 92,120 | 12.78 | 3,076 | 21.45 | ||||
| 2025-07-24 | 13F | IFP Advisors, Inc | 50 | 2 | ||||||
| 2025-07-28 | 13F | WealthPLAN Partners, LLC | 6,510 | -94.58 | 217 | -94.17 | ||||
| 2025-07-18 | 13F | B.O.S.S. Retirement Advisors, LLC | 6,971 | -2.49 | 233 | 4.98 | ||||
| 2025-08-13 | 13F | StoneX Group Inc. | 0 | -100.00 | 0 | -100.00 | ||||
| 2025-08-11 | 13F | Brown Brothers Harriman & Co | 2,009 | 0.00 | 67 | 8.06 | ||||
| 2025-08-04 | 13F | Creative Financial Designs Inc /adv | 125 | 0.00 | 4 | 33.33 | ||||
| 2025-08-29 | 13F | Centaurus Financial, Inc. | 10,617 | 0.00 | 0 | |||||
| 2025-08-06 | 13F | Moors & Cabot, Inc. | 0 | -100.00 | 0 | |||||
| 2025-04-21 | 13F | Nelson, Van Denburg & Campbell Wealth Management Group, LLC | 0 | -100.00 | 0 | |||||
| 2025-08-14 | 13F | Garden State Investment Advisory Services LLC | 10,200 | 0.00 | 341 | 7.59 | ||||
| 2025-04-25 | 13F | New Millennium Group LLC | 0 | -100.00 | 0 | |||||
| 2025-07-31 | 13F | FSR Wealth Management Ltd. | 112,670 | 3.29 | 3,762 | 11.24 | ||||
| 2025-08-12 | 13F | Jpmorgan Chase & Co | 15,138 | 505 | ||||||
| 2025-08-14 | 13F | Old Mission Capital Llc | 26,552 | 887 | ||||||
| 2025-09-04 | 13F/A | Advisor Group Holdings, Inc. | 133,967 | -30.68 | 4,473 | -25.36 | ||||
| 2025-08-15 | 13F | Kestra Advisory Services, LLC | 15,355 | 96.58 | 513 | 111.57 | ||||
| 2025-07-10 | 13F | Oliver Lagore Vanvalin Investment Group | 0 | -100.00 | 0 | |||||
| 2025-08-01 | 13F | FSA Advisors, Inc. | 27,360 | 28.78 | 914 | 38.75 | ||||
| 2025-08-14 | 13F | Citadel Advisors Llc | 15,761 | 8.55 | 526 | 16.89 | ||||
| 2025-07-30 | 13F | Strategic Blueprint, LLC | 44,727 | 0.00 | 1,493 | 7.72 | ||||
| 2025-07-14 | 13F | AdvisorNet Financial, Inc | 1,460 | 0.00 | 49 | 6.67 | ||||
| 2025-07-18 | 13F | Consolidated Portfolio Review Corp | 16,090 | 537 | ||||||
| 2025-08-08 | 13F | Avantax Advisory Services, Inc. | 9,732 | 0.00 | 325 | 7.64 | ||||
| 2025-07-25 | 13F | Atria Wealth Solutions, Inc. | 17,097 | -0.44 | 571 | 7.14 | ||||
| 2025-07-28 | 13F | Harbour Investments, Inc. | 15,900 | 2.15 | 531 | 9.96 | ||||
| 2025-07-21 | 13F | Ameritas Advisory Services, LLC | 1,855 | 62 | ||||||
| 2025-08-01 | 13F | Envestnet Asset Management Inc | 0 | -100.00 | 0 | |||||
| 2025-08-08 | 13F | Cetera Investment Advisers | 26,842 | -1.86 | 896 | 5.66 | ||||
| 2025-07-10 | 13F | Focus Financial Network, Inc. | 8,234 | 0.00 | 275 | 7.45 | ||||
| 2025-08-11 | 13F | Blue Bell Private Wealth Management, Llc | 1,040 | 0.00 | 35 | 6.25 | ||||
| 2025-05-01 | 13F | Quest 10 Wealth Builders, Inc. | 25,177 | 3.55 | 781 | 0.78 |