Basic Stats
| Institutional Owners | 104 total, 103 long only, 0 short only, 1 long/short - change of 9.47% MRQ |
| Average Portfolio Allocation | 0.2468 % - change of 45.15% MRQ |
| Institutional Shares (Long) | 23,715,120 (ex 13D/G) - change of 6.12MM shares 34.75% MRQ |
| Institutional Value (Long) | $ 301,097 USD ($1000) |
Institutional Ownership and Shareholders
Crescent Capital BDC, Inc. (US:CCAP) has 104 institutional owners and shareholders that have filed 13D/G or 13F forms with the Securities Exchange Commission (SEC). These institutions hold a total of 23,715,120 shares. Largest shareholders include Texas County & District Retirement System, Fidelity National Financial, Inc., Blackstone Group Inc, Sun Life Financial Inc, Ares Management Llc, Franklin Resources Inc, Putnam ETF Trust - Putnam BDC ETF -, Mariner, LLC, Almitas Capital LLC, and CF Capital LLC .
Crescent Capital BDC, Inc. (NasdaqGM:CCAP) institutional ownership structure shows current positions in the company by institutions and funds, as well as latest changes in position size. Major shareholders can include individual investors, mutual funds, hedge funds, or institutions. The Schedule 13D indicates that the investor holds (or held) more than 5% of the company and intends (or intended) to actively pursue a change in business strategy. Schedule 13G indicates a passive investment of over 5%.
The share price as of September 5, 2025 is 15.94 / share. Previously, on September 9, 2024, the share price was 18.09 / share. This represents a decline of 11.89% over that period.

Fund Sentiment Score
The Fund Sentiment Score (fka Ownership Accumulation Score) finds the stocks that are being most bought by funds. It is the result of a sophisticated, multi-factor quantitative model that identifies companies with the highest levels of institutional accumulation. The scoring model uses a combination of the total increase in disclosed owners, the changes in portfolio allocations in those owners and other metrics. The number ranges from 0 to 100, with higher numbers indicating a higher level of accumulation to its peers, and 50 being the average.
Update Frequency: Daily
See Ownership Explorer, which provides a list of highest-ranking companies.
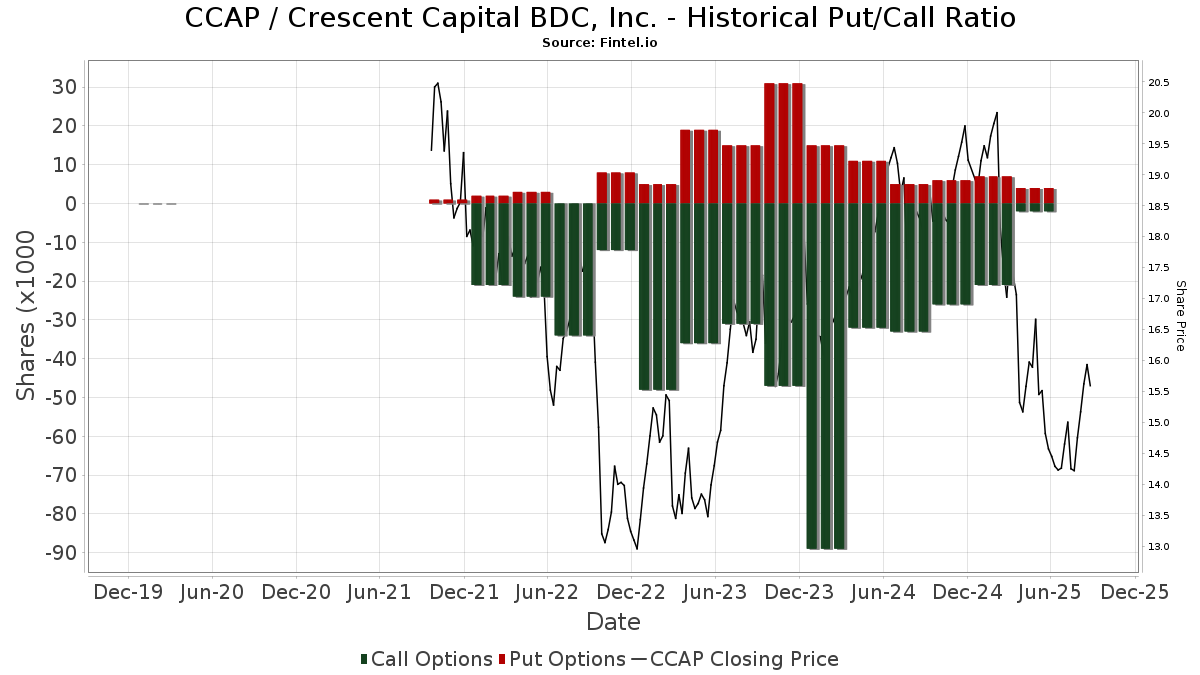
Institutional Put/Call Ratio
In addition to reporting standard equity and debt issues, institutions with more than 100MM assets under management must also disclose their put and call option holdings. Since put options generally indicate negative sentiment, and call options indicate positive sentiment, we can get a sense of the overall institutional sentiment by plotting the ratio of puts to calls. The chart to the right plots the historical put/call ratio for this instrument.
Using Put/Call Ratio as an indicator of investor sentiment overcomes one of the key deficiencies of using total institutional ownership, which is that a significant amount of assets under management are invested passively to track indices. Passively-managed funds do not typically buy options, so the put/call ratio indicator more closely tracks the sentiment of actively-managed funds.
13D/G Filings
We present 13D/G filings separately from the 13F filings because of the different treatement by the SEC. 13D/G filings can be filed by groups of investors (with one leading), whereas 13F filings cannot. This results in situations where an investor may file a 13D/G reporting one value for the total shares (representing all the shares owned by the investor group), but then file a 13F reporting a different value for the total shares (representing strictly their own ownership). This means that share ownership of 13D/G filings and 13F filings are oftentimes not directly comparable, so we present them separately.
Note: As of May 16, 2021, we no longer show owners that have not filed a 13D/G within the last year. Previously, we were showing the full history of 13D/G filings. In general, entities that are required to file 13D/G filings must file at least annually before submitting a closing filing. However, funds sometimes exit positions without submitting a closing filing (ie, they wind down), so displaying the full history sometimes resulted in confusion about the current ownership. To prevent confusion, we now only show ’current’ owners - that is - owners that have filed within the last year.
Upgrade to unlock premium data.
| File Date | Form | Investor | Prev Shares |
Latest Shares |
Δ Shares (Percent) |
Ownership (Percent) |
Δ Ownership (Percent) |
|
|---|---|---|---|---|---|---|---|---|
| 2025-08-19 | UFCW-Northern California Employers Joint Pension Plan | 2,528,031 | 784,356 | -68.97 | 2.12 | -68.91 | ||
| 2025-08-14 | Blackstone Holdings I L.P. | 4,205,307 | 11.30 | |||||
| 2025-02-14 | Texas County & District Retirement System | 5,001,752 | 5,001,752 | 0.00 | 13.50 | 0.03 | ||
| 2024-11-26 | SUN LIFE FINANCIAL INC | 2,226,308 | 6.01 | |||||
| 2024-11-26 | Sun Life Assurance Co of Canada | 2,226,308 | 6.01 |
13F and NPORT Filings
Detail on 13F filings are free. Detail on NP filings require a premium membership. Green rows indicate new positions. Red rows indicate closed positions. Click the link icon to see the full transaction history.
Upgrade
to unlock premium data and export to Excel ![]() .
.
| File Date | Source | Investor | Type | Avg Price (Est) |
Shares | Δ Shares (%) |
Reported Value ($1000) |
Δ Value (%) |
Port Alloc (%) |
|
|---|---|---|---|---|---|---|---|---|---|---|
| 2025-08-13 | 13F | Virtus Investment Advisers, Inc. | 56,892 | 6.63 | 802 | -12.16 | ||||
| 2025-07-09 | 13F | Silverberg Bernstein Capital Management LLC | 14,760 | 3.51 | 208 | -14.75 | ||||
| 2025-08-12 | 13F | Aigen Investment Management, Lp | 10,519 | 148 | ||||||
| 2025-07-15 | 13F | Texas County & District Retirement System | 5,001,752 | 0.00 | 70,525 | -17.64 | ||||
| 2025-07-31 | 13F | MQS Management LLC | 31,807 | -15.97 | 448 | -30.86 | ||||
| 2025-08-08 | 13F | Cetera Investment Advisers | 0 | -100.00 | 0 | |||||
| 2025-08-14 | 13F | Engineers Gate Manager LP | 0 | -100.00 | 0 | |||||
| 2025-08-08 | 13F | Rockefeller Capital Management L.P. | 0 | -100.00 | 0 | |||||
| 2025-08-14 | 13F | FJ Capital Management LLC | 37,640 | 531 | ||||||
| 2025-08-27 | NP | Special Opportunities Fund, Inc. | 99,489 | 124.29 | 1,403 | 84.96 | ||||
| 2025-08-13 | 13F | Lido Advisors, LLC | 13,975 | 0.00 | 203 | -17.55 | ||||
| 2025-08-13 | 13F | Mackenzie Financial Corp | 32,930 | -29.85 | 464 | -42.22 | ||||
| 2025-07-28 | 13F | BRYN MAWR TRUST Co | 0 | -100.00 | 0 | |||||
| 2025-06-18 | NP | Putnam ETF Trust - Putnam BDC ETF - | 469,431 | 40.84 | 7,497 | 14.76 | ||||
| 2025-08-14 | 13F | Royal Bank Of Canada | 49,394 | -19.95 | 696 | -34.09 | ||||
| 2025-08-07 | 13F | Hennion & Walsh Asset Management, Inc. | 104,679 | -0.05 | 1,476 | -17.74 | ||||
| 2025-04-15 | 13F | Redhawk Wealth Advisors, Inc. | 0 | -100.00 | 0 | |||||
| 2025-08-04 | 13F | Muzinich & Co., Inc. | 110,423 | 36.72 | 1,557 | 12.59 | ||||
| 2025-08-11 | 13F | Nordwand Advisors, LLC | 38,860 | 0.00 | 548 | -17.74 | ||||
| 2025-08-11 | 13F | HighTower Advisors, LLC | 135,683 | -1.23 | 1,913 | -18.63 | ||||
| 2025-08-13 | 13F | Invesco Ltd. | 38,377 | 31.44 | 541 | 8.42 | ||||
| 2025-08-14 | 13F | CF Capital LLC | 311,000 | 4,394 | ||||||
| 2025-08-14 | 13F | Kovitz Investment Group Partners, LLC | 210,770 | 3.89 | 2,972 | -14.45 | ||||
| 2025-05-14 | 13F | Northwestern Mutual Wealth Management Co | 0 | -100.00 | 0 | |||||
| 2025-07-30 | 13F | Denali Advisors Llc | 153,691 | -13.94 | 2,167 | -29.11 | ||||
| 2025-09-04 | 13F/A | Advisor Group Holdings, Inc. | 8,606 | -35.65 | 121 | -46.93 | ||||
| 2025-07-31 | 13F | Oppenheimer & Co Inc | 21,186 | 55.71 | 299 | 28.45 | ||||
| 2025-04-11 | 13F | First Affirmative Financial Network | 11,605 | 199 | ||||||
| 2025-08-13 | 13F | Generation Capital Management LLC | 10,000 | 0.00 | 141 | -17.54 | ||||
| 2025-08-05 | 13F | Simplex Trading, Llc | Put | 4,400 | 57.14 | 0 | ||||
| 2025-07-29 | NP | Putnam High Income Securities Fund | 105,162 | 90.14 | 1,632 | 77.01 | ||||
| 2025-05-05 | 13F | Montag A & Associates Inc | 0 | -100.00 | 0 | |||||
| 2025-08-05 | 13F | Simplex Trading, Llc | 2,122 | 4,060.78 | 0 | |||||
| 2025-08-14 | 13F | Ares Management Llc | 516,409 | 9.97 | 7,281 | -9.43 | ||||
| 2025-07-28 | 13F | Axxcess Wealth Management, Llc | 10,103 | 0.00 | 142 | -17.44 | ||||
| 2025-08-05 | 13F | Simplex Trading, Llc | Call | 2,200 | 37.50 | 0 | ||||
| 2025-08-14 | 13F | VPR Management LLC | 2,000 | 28 | ||||||
| 2025-08-14 | 13F | Mml Investors Services, Llc | 0 | -100.00 | 0 | |||||
| 2025-08-15 | 13F | Morgan Stanley | 119,158 | 26.38 | 1,680 | 4.09 | ||||
| 2025-08-06 | 13F | Ethos Financial Group, LLC | 26,008 | 0.00 | 367 | -17.75 | ||||
| 2025-05-16 | 13F | Dynamic Technology Lab Private Ltd | 0 | -100.00 | 0 | |||||
| 2025-08-14 | 13F | Aspen Grove Capital, LLC | 259,631 | 1.28 | 3,661 | -16.59 | ||||
| 2025-08-12 | 13F | Fidelity National Financial, Inc. This fund is a listed as child fund of Fmr Llc and if that institution has disclosed ownership in this security, then these positions will not be double counted when calculating total shares and total value | 4,205,307 | 0.00 | 59,295 | -17.64 | ||||
| 2025-05-15 | 13F | Aquatic Capital Management LLC | 0 | -100.00 | 0 | |||||
| 2025-08-13 | 13F | Jones Financial Companies Lllp | 1,000 | 14 | ||||||
| 2025-08-14 | 13F | Susquehanna International Group, Llp | Call | 0 | -100.00 | 0 | ||||
| 2025-05-14 | 13F | Huntington National Bank | 0 | -100.00 | 0 | |||||
| 2025-06-25 | NP | VPC - Virtus Private Credit Strategy ETF | 48,738 | 6.87 | 778 | -12.88 | ||||
| 2025-05-12 | 13F | National Bank Of Canada /fi/ | 0 | -100.00 | 0 | -100.00 | ||||
| 2025-08-14 | 13F | Citadel Advisors Llc | 47,037 | -30.06 | 663 | -42.40 | ||||
| 2025-07-17 | 13F | Janney Montgomery Scott LLC | 17,545 | -62.31 | 0 | |||||
| 2025-08-01 | 13F | Cobblestone Capital Advisors Llc /ny/ | 58,042 | -1.76 | 818 | -19.09 | ||||
| 2025-08-12 | 13F | BlackRock, Inc. | 212,303 | 29.38 | 2,993 | 6.55 | ||||
| 2025-07-17 | 13F | Sound Income Strategies, LLC | 176 | 0.00 | 2 | -33.33 | ||||
| 2025-08-14 | 13F | Jane Street Group, Llc | 102,662 | 1,448 | ||||||
| 2025-08-14 | 13F | Qube Research & Technologies Ltd | 13,727 | -61.68 | 194 | -68.52 | ||||
| 2025-08-14 | 13F | Wells Fargo & Company/mn | 245,968 | -4.96 | 3,468 | -21.72 | ||||
| 2025-08-06 | 13F | Commonwealth Equity Services, Llc | 12,060 | 0 | ||||||
| 2025-05-14 | 13F/A | Group One Trading, L.p. | Call | 0 | -100.00 | 0 | ||||
| 2025-05-02 | 13F | Pettinga Financial Advisors, LLC | 0 | -100.00 | 0 | -100.00 | ||||
| 2025-07-21 | 13F | Catalina Capital Group, LLC | 12,336 | 174 | ||||||
| 2025-08-19 | 13F | Anchor Investment Management, LLC | 16,909 | 0.00 | 238 | -17.65 | ||||
| 2025-08-13 | 13F | Skandinaviska Enskilda Banken AB (publ) | 109,288 | 0.00 | 1,541 | -17.69 | ||||
| 2025-08-18 | 13F | Hollencrest Capital Management | 0 | -100.00 | 0 | |||||
| 2025-05-15 | 13F | Hrt Financial Lp | 0 | -100.00 | 0 | |||||
| 2025-05-15 | 13F | Tower Research Capital LLC (TRC) | 0 | -100.00 | 0 | |||||
| 2025-07-01 | 13F | Confluence Investment Management Llc | 76,061 | 1.34 | 1,072 | -16.51 | ||||
| 2025-08-14 | 13F | Raymond James Financial Inc | 236,817 | 12.62 | 3,339 | -7.25 | ||||
| 2025-08-13 | 13F | Northern Trust Corp | 19,612 | -15.45 | 277 | -30.48 | ||||
| 2025-08-13 | 13F | Quantbot Technologies LP | 15,560 | 219 | ||||||
| 2025-08-21 | NP | MOFTX - Mercer Opportunistic Fixed Income Fund Class I | 39,542 | 558 | ||||||
| 2025-08-13 | 13F | ExodusPoint Capital Management, LP | 0 | -100.00 | 0 | |||||
| 2025-08-14 | 13F | Mariner, LLC | 449,314 | 2.17 | 6,335 | -16.00 | ||||
| 2025-08-01 | 13F | Envestnet Asset Management Inc | 18,221 | -0.92 | 257 | -18.47 | ||||
| 2025-08-14 | 13F | Two Sigma Investments, Lp | 89,989 | -34.84 | 1,269 | -46.36 | ||||
| 2025-08-14 | 13F/A | Barclays Plc | 26,003 | -84.62 | 0 | -100.00 | ||||
| 2025-08-14 | 13F | Millennium Management Llc | 113,088 | 788.08 | 1,595 | 631.19 | ||||
| 2025-08-07 | 13F | Allworth Financial LP | 100 | 0.00 | 1 | 0.00 | ||||
| 2025-08-14 | 13F | Stifel Financial Corp | 58,334 | 20.06 | 823 | -1.08 | ||||
| 2025-08-14 | 13F | Tudor Investment Corp Et Al | 0 | -100.00 | 0 | |||||
| 2025-08-14 | 13F | Almitas Capital LLC | 348,015 | 1,338.08 | 4,907 | 1,085.27 | ||||
| 2025-08-25 | NP | IOBAX - ICON FLEXIBLE BOND FUND Investor Class | 104,901 | 79.71 | 1,479 | 48.05 | ||||
| 2025-07-25 | NP | First Trust Specialty Finance & Financial Opportunities Fund This fund is a listed as child fund of First Trust Advisors Lp and if that institution has disclosed ownership in this security, then these positions will not be double counted when calculating total shares and total value | 42,565 | 0.00 | 661 | -15.71 | ||||
| 2025-05-14 | 13F | Colonial Trust Advisors | 0 | -100.00 | 0 | |||||
| 2025-08-13 | 13F | SCS Capital Management LLC | 28,814 | 0.00 | 406 | -17.65 | ||||
| 2025-08-14 | 13F | Bank Of America Corp /de/ | 73,012 | -35.42 | 1,029 | -46.82 | ||||
| 2025-08-14 | 13F | Oxford Asset Management Llp | 40,048 | 565 | ||||||
| 2025-08-12 | 13F | Trexquant Investment LP | 0 | -100.00 | 0 | |||||
| 2025-08-13 | 13F | Neuberger Berman Group LLC | 0 | -100.00 | 0 | |||||
| 2025-08-14 | 13F | Van Eck Associates Corp | 93,125 | 62.88 | 1 | |||||
| 2025-08-14 | 13F | Barnett & Company, Inc. | 23,500 | 35.84 | 331 | 11.82 | ||||
| 2025-07-31 | 13F/A | Avion Wealth | 308 | 2.67 | 0 | |||||
| 2025-08-14 | 13F | Blackstone Group Inc | 4,205,307 | 10.78 | 59,295 | -8.77 | ||||
| 2025-08-14 | 13F | GWM Advisors LLC | 10,057 | -7.61 | 142 | -24.19 | ||||
| 2025-08-11 | 13F | Lsv Asset Management | 7,300 | 0.00 | 0 | |||||
| 2025-07-22 | 13F | Valley National Advisers Inc | 600 | 0.00 | 0 | |||||
| 2025-08-14 | 13F | Two Sigma Advisers, Lp | 246,576 | -23.96 | 3,477 | -37.38 | ||||
| 2025-08-08 | 13F | Geode Capital Management, Llc | 12,883 | 0.00 | 182 | -17.73 | ||||
| 2025-08-28 | NP | TRIFX - Catalyst/SMH Total Return Income Fund Class A | 4,900 | 69 | ||||||
| 2025-07-24 | NP | FNCMX - Fidelity Nasdaq Composite Index Fund This fund is a listed as child fund of Fmr Llc and if that institution has disclosed ownership in this security, then these positions will not be double counted when calculating total shares and total value | 12,883 | 0.00 | 200 | -16.03 | ||||
| 2025-08-12 | 13F | Coldstream Capital Management Inc | 0 | -100.00 | 0 | |||||
| 2025-05-12 | 13F | Connor, Clark & Lunn Investment Management Ltd. | 0 | -100.00 | 0 | |||||
| 2025-08-13 | 13F | Icon Advisers Inc/co | 69,973 | 20.19 | 987 | -1.00 | ||||
| 2025-08-14 | 13F | BI Asset Management Fondsmaeglerselskab A/S | 63,893 | 0.00 | 1 | -100.00 | ||||
| 2025-08-11 | 13F | Citigroup Inc | 0 | -100.00 | 0 | |||||
| 2025-08-14 | 13F | Ieq Capital, Llc | 24,038 | 2.21 | 339 | -15.92 | ||||
| 2025-08-14 | 13F | SWAN Capital LLC | 264 | 4 | ||||||
| 2025-08-25 | NP | TMVAX - RBC Microcap Value Fund A Shares | 10,600 | 0.00 | 149 | -17.68 | ||||
| 2025-05-12 | 13F | Eagle Global Advisors Llc | 0 | -100.00 | 0 | |||||
| 2025-08-15 | 13F | WealthCollab, LLC | 0 | -100.00 | 0 | |||||
| 2025-08-12 | 13F | Franklin Resources Inc | 504,926 | 16.75 | 7,119 | -3.84 | ||||
| 2025-08-13 | 13F | Sun Life Financial Inc | 2,226,308 | 0.00 | 31 | -18.42 | ||||
| 2025-08-25 | 13F/A | Promus Capital, LLC | 1,750 | 0.00 | 25 | -17.24 | ||||
| 2025-08-14 | 13F | Wiley Bros.-aintree Capital, Llc | 13,343 | 188 | ||||||
| 2025-04-21 | 13F | PSI Advisors, LLC | 0 | -100.00 | 0 | |||||
| 2025-08-14 | 13F | Ameriprise Financial Inc | 89,027 | 10.58 | 1,136 | -17.63 | ||||
| 2025-05-14 | 13F | Credit Agricole S A | 43,380 | 0.00 | 743 | -10.92 | ||||
| 2025-08-15 | 13F | Captrust Financial Advisors | 52,686 | 40.91 | 743 | 15.94 | ||||
| 2025-07-31 | 13F | Sumitomo Mitsui Trust Holdings, Inc. | 110,423 | 36.72 | 1,557 | 12.59 | ||||
| 2025-08-14 | 13F | UBS Group AG | 221,956 | 93.63 | 3,130 | 59.48 | ||||
| 2025-07-31 | 13F | Catalyst Capital Advisors LLC | 4,900 | 69 | ||||||
| 2025-08-14 | 13F | Bulldog Investors, LLP | 290,383 | 4,094 | ||||||
| 2025-08-08 | 13F | Condor Capital Management | 307,738 | 4.93 | 4,339 | -13.58 | ||||
| 2025-08-12 | 13F | LPL Financial LLC | 18,042 | -34.79 | 254 | -46.30 | ||||
| 2025-07-25 | 13F | Apollon Wealth Management, LLC | 36,479 | 57.16 | 514 | 29.47 | ||||
| 2025-05-15 | 13F/A | Cooperman Leon G | 0 | -100.00 | 0 | |||||
| 2025-05-15 | 13F | C M Bidwell & Associates Ltd | 0 | -100.00 | 0 | |||||
| 2025-08-14 | 13F | Citadel Advisors Llc | Call | 0 | -100.00 | 0 | ||||
| 2025-08-14 | 13F | Comerica Bank | 16,598 | -0.69 | 234 | -18.18 | ||||
| 2025-03-28 | NP | DVDN - Kingsbarn Dividend Opportunity ETF | 0 | -100.00 | 0 | -100.00 | ||||
| 2025-05-14 | 13F | Virtus ETF Advisers LLC | 0 | -100.00 | 0 | |||||
| 2025-08-14 | 13F | Citadel Advisors Llc | Put | 0 | -100.00 | 0 | ||||
| 2025-08-12 | 13F | Proequities, Inc. | Put | 0 | 0 | |||||
| 2025-08-12 | 13F | Proequities, Inc. | Call | 0 | 0 | |||||
| 2025-08-12 | 13F | Proequities, Inc. | 0 | 0 | ||||||
| 2025-08-13 | 13F | Jump Financial, LLC | 20,312 | 286 | ||||||
| 2025-08-12 | 13F | XTX Topco Ltd | 11,709 | 165 | ||||||
| 2025-08-13 | 13F | Beacon Pointe Advisors, LLC | 23,173 | 0.00 | 327 | -17.68 | ||||
| 2025-07-29 | NP | SVYAX - SIIT U.S. Managed Volatility Fund - Class A | 2,280 | 35 | ||||||
| 2025-08-14 | 13F | Quarry LP | 552 | 8 | ||||||
| 2025-08-13 | 13F | Marshall Wace, Llp | 0 | -100.00 | 0 | |||||
| 2025-08-08 | 13F | Larson Financial Group LLC | 0 | -100.00 | 0 | |||||
| 2025-08-14 | 13F | Verition Fund Management LLC | 35,792 | 505 |