Basic Stats
| Institutional Shares (Long) | 1,136,474 (ex 13D/G) - change of -0.17MM shares -12.88% MRQ |
| Institutional Value (Long) | $ 510 USD ($1000) |
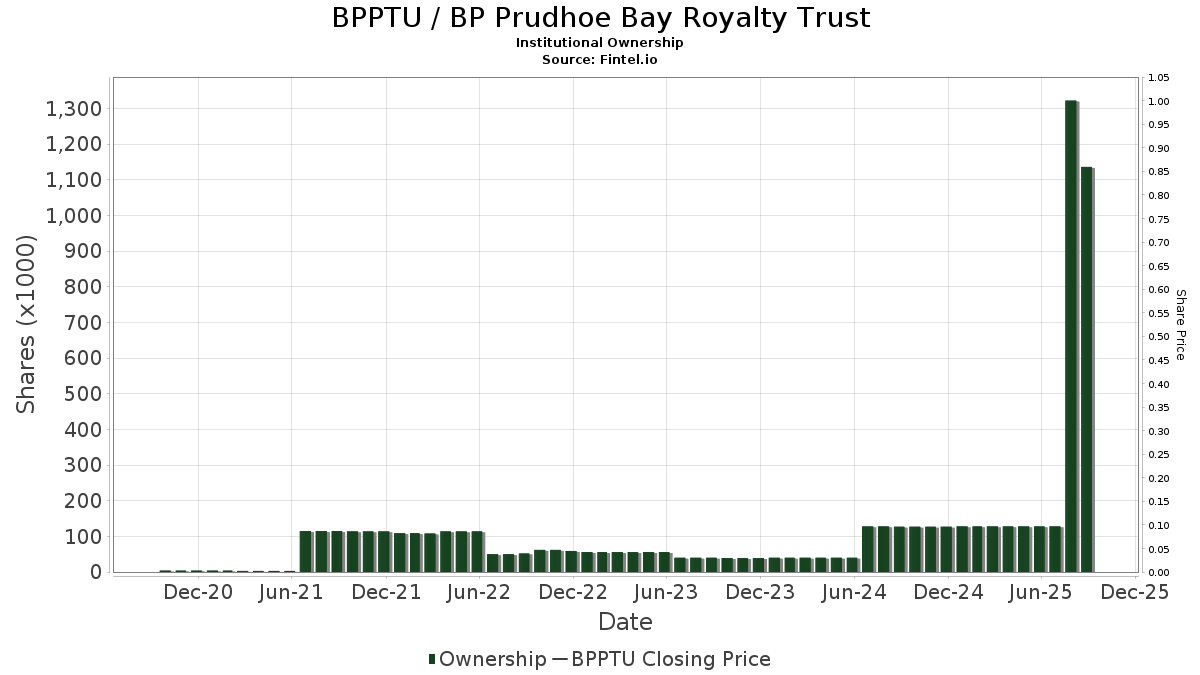
Institutional Ownership and Shareholders
BP Prudhoe Bay Royalty Trust (US:BPPTU) has 43 institutional owners and shareholders that have filed 13D/G or 13F forms with the Securities Exchange Commission (SEC). These institutions hold a total of 1,136,474 shares. Largest shareholders include Ashton Thomas Private Wealth, LLC, Citadel Advisors Llc, PRFZ - Invesco FTSE RAFI US 1500 Small-Mid ETF, Two Sigma Investments, Lp, Wedbush Securities Inc, Susquehanna International Group, Llp, Welch Group, LLC, XTX Topco Ltd, UBS Group AG, and Morgan Stanley .
BP Prudhoe Bay Royalty Trust (OTCPK:BPPTU) institutional ownership structure shows current positions in the company by institutions and funds, as well as latest changes in position size. Major shareholders can include individual investors, mutual funds, hedge funds, or institutions. The Schedule 13D indicates that the investor holds (or held) more than 5% of the company and intends (or intended) to actively pursue a change in business strategy. Schedule 13G indicates a passive investment of over 5%.
Fund Sentiment Score
The Fund Sentiment Score (fka Ownership Accumulation Score) finds the stocks that are being most bought by funds. It is the result of a sophisticated, multi-factor quantitative model that identifies companies with the highest levels of institutional accumulation. The scoring model uses a combination of the total increase in disclosed owners, the changes in portfolio allocations in those owners and other metrics. The number ranges from 0 to 100, with higher numbers indicating a higher level of accumulation to its peers, and 50 being the average.
Update Frequency: Daily
See Ownership Explorer, which provides a list of highest-ranking companies.
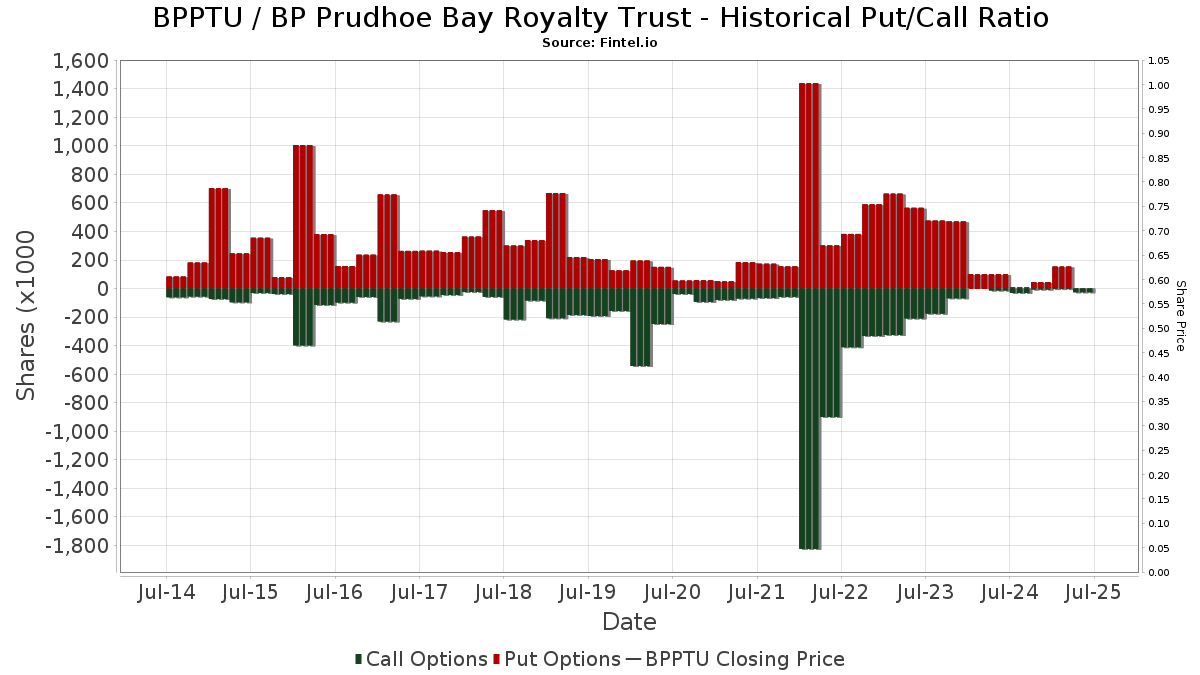
Institutional Put/Call Ratio
In addition to reporting standard equity and debt issues, institutions with more than 100MM assets under management must also disclose their put and call option holdings. Since put options generally indicate negative sentiment, and call options indicate positive sentiment, we can get a sense of the overall institutional sentiment by plotting the ratio of puts to calls. The chart to the right plots the historical put/call ratio for this instrument.
Using Put/Call Ratio as an indicator of investor sentiment overcomes one of the key deficiencies of using total institutional ownership, which is that a significant amount of assets under management are invested passively to track indices. Passively-managed funds do not typically buy options, so the put/call ratio indicator more closely tracks the sentiment of actively-managed funds.
13F and NPORT Filings
Detail on 13F filings are free. Detail on NP filings require a premium membership. Green rows indicate new positions. Red rows indicate closed positions. Click the link icon to see the full transaction history.
Upgrade
to unlock premium data and export to Excel ![]() .
.
| File Date | Source | Investor | Type | Avg Price (Est) |
Shares | Δ Shares (%) |
Reported Value ($1000) |
Δ Value (%) |
Port Alloc (%) |
|
|---|---|---|---|---|---|---|---|---|---|---|
| 2025-08-14 | 13F | Two Sigma Investments, Lp | 77,912 | -22.47 | 39 | -29.09 | ||||
| 2025-08-12 | 13F | PSI Advisors, LLC | 0 | -100.00 | 0 | |||||
| 2025-05-12 | 13F | Invesco Ltd. | 0 | -100.00 | 0 | |||||
| 2025-05-07 | 13F | Sheaff Brock Investment Advisors, LLC | 16,963 | 0.00 | 9 | 12.50 | ||||
| 2025-08-12 | 13F | Virtu Financial LLC | 23,244 | 41.85 | 0 | |||||
| 2025-04-30 | 13F | Sofos Investments, Inc. | 0 | -100.00 | 0 | -100.00 | ||||
| 2025-08-06 | 13F | Wedbush Securities Inc | 47,263 | -0.53 | 0 | |||||
| 2025-08-14 | 13F | Jane Street Group, Llc | 0 | -100.00 | 0 | |||||
| 2025-08-14 | 13F | Royal Bank Of Canada | 733 | -78.75 | 0 | -100.00 | ||||
| 2025-08-14 | 13F | Hunting Hill Global Capital, LLC | 0 | -100.00 | 0 | |||||
| 2025-07-25 | 13F | Welch Group, LLC | 33,759 | 0.00 | 17 | -11.11 | ||||
| 2025-07-21 | 13F | DHJJ Financial Advisors, Ltd. | 25 | 0.00 | 0 | |||||
| 2025-07-10 | 13F | Baader Bank INC | 0 | -100.00 | 0 | |||||
| 2025-08-05 | 13F | Carolinas Wealth Consulting Llc | 0 | -100.00 | 0 | |||||
| 2025-08-13 | 13F | Alerus Financial Na | 3,850 | 2 | ||||||
| 2025-08-14 | 13F | Group One Trading, L.p. | 4,953 | -61.62 | 2 | -71.43 | ||||
| 2025-08-14 | 13F | Wells Fargo & Company/mn | 853 | -56.32 | 0 | -100.00 | ||||
| 2025-08-15 | 13F | Fidelity D & D Bancorp Inc | 21,000 | 0.00 | 11 | -9.09 | ||||
| 2025-08-14 | 13F | Goldman Sachs Group Inc | 0 | -100.00 | 0 | |||||
| 2025-08-14 | 13F | Citadel Advisors Llc | Put | 0 | -100.00 | 0 | ||||
| 2025-08-13 | 13F | StoneX Group Inc. | 0 | -100.00 | 0 | -100.00 | ||||
| 2025-08-14 | 13F | Safeguard Investment Advisory Group, LLC | 15,607 | 0.00 | 8 | -12.50 | ||||
| 2025-05-13 | 13F | Steward Partners Investment Advisory, Llc | 0 | -100.00 | 0 | |||||
| 2025-08-14 | 13F | Fmr Llc | 1,000 | 1 | ||||||
| 2025-08-12 | 13F | CIBC Private Wealth Group, LLC | 0 | -100.00 | 0 | |||||
| 2025-08-14 | 13F | UBS Group AG | 29,509 | -64.67 | 15 | -69.57 | ||||
| 2025-05-15 | 13F | Creative Planning | 0 | -100.00 | 0 | |||||
| 2025-08-14 | 13F | Two Sigma Securities, Llc | 0 | -100.00 | 0 | |||||
| 2025-08-14 | 13F | SIH Partners, LLLP | Put | 0 | -100.00 | 0 | ||||
| 2025-05-16 | 13F | Coppell Advisory Solutions LLC | 0 | -100.00 | 0 | |||||
| 2025-08-14 | 13F | Federation des caisses Desjardins du Quebec | 0 | -100.00 | 0 | |||||
| 2025-08-14 | 13F/A | Barclays Plc | 23 | 0.00 | 0 | |||||
| 2025-07-16 | 13F | Signaturefd, Llc | 47 | 0.00 | 0 | |||||
| 2025-08-04 | 13F | Creekmur Asset Management LLC | 0 | -100.00 | 0 | |||||
| 2025-09-04 | 13F/A | Advisor Group Holdings, Inc. | 10,927 | 3.05 | 5 | 0.00 | ||||
| 2025-08-14 | 13F | Hrt Financial Lp | 16,510 | 0 | ||||||
| 2025-07-31 | 13F | Azzad Asset Management Inc /adv | 22,000 | 0.00 | 11 | -8.33 | ||||
| 2025-08-01 | 13F | Ashton Thomas Private Wealth, LLC | 429,752 | 0.00 | 216 | -9.28 | ||||
| 2025-07-15 | 13F | FLP Wealth Management, LLC | 0 | -100.00 | 0 | |||||
| 2025-08-05 | 13F | Simplex Trading, Llc | 2,213 | -80.98 | 0 | |||||
| 2025-08-12 | 13F | XTX Topco Ltd | 31,569 | -45.53 | 16 | -53.12 | ||||
| 2025-08-15 | 13F | Morgan Stanley | 28,637 | -9.38 | 14 | -17.65 | ||||
| 2025-05-15 | 13F | Gts Securities Llc | 0 | -100.00 | 0 | |||||
| 2025-08-11 | 13F | Private Advisor Group, LLC | 11,510 | 0.00 | 6 | -16.67 | ||||
| 2025-04-01 | NP | PRFZ - Invesco FTSE RAFI US 1500 Small-Mid ETF This fund is a listed as child fund of Invesco Ltd. and if that institution has disclosed ownership in this security, then these positions will not be double counted when calculating total shares and total value | 128,441 | -0.13 | 67 | -49.62 | ||||
| 2025-08-14 | 13F | Bank Of America Corp /de/ | 4,901 | 0.82 | 2 | 0.00 | ||||
| 2025-07-15 | 13F | Mather Group, Llc. | 0 | -100.00 | 0 | |||||
| 2025-08-12 | 13F | Bokf, Na | 64 | -82.42 | 0 | |||||
| 2025-04-24 | 13F | Trust Co Of Vermont | 0 | -100.00 | 0 | |||||
| 2025-07-23 | 13F | Narwhal Capital Management | 23,587 | 0.00 | 12 | -15.38 | ||||
| 2025-08-14 | 13F | Gould Capital, LLC | 70 | 0.00 | 0 | |||||
| 2025-08-12 | 13F | Proequities, Inc. | 0 | 0 | ||||||
| 2025-07-11 | 13F | Adirondack Trust Co | 100 | 0.00 | 0 | |||||
| 2025-05-07 | 13F | Vista Private Wealth Partners. LLC | 0 | -100.00 | 0 | |||||
| 2025-08-07 | 13F | Allworth Financial LP | 17,178 | 6,969.14 | 9 | |||||
| 2025-08-11 | 13F | Bellwether Advisors, LLC | 1 | 0.00 | 0 | |||||
| 2025-08-14 | 13F | GWM Advisors LLC | 894 | 0.00 | 0 | |||||
| 2025-05-02 | 13F | Whittier Trust Co Of Nevada Inc | 0 | -100.00 | 0 | |||||
| 2025-07-15 | 13F | Cranbrook Wealth Management, LLC | 676 | 0.00 | 0 | |||||
| 2025-08-08 | 13F | Cetera Investment Advisers | 13,827 | -6.27 | 7 | -25.00 | ||||
| 2025-08-13 | 13F | Northern Trust Corp | 0 | -100.00 | 0 | |||||
| 2025-08-14 | 13F | Citadel Advisors Llc | Call | 25,300 | 583.78 | 13 | 500.00 | |||
| 2025-07-24 | 13F | Us Bancorp \de\ | 900 | 0.00 | 0 | |||||
| 2025-08-14 | 13F | Citadel Advisors Llc | 202,731 | 4.50 | 102 | -5.61 | ||||
| 2025-08-12 | 13F | MAI Capital Management | 2,320 | 0.00 | 1 | 0.00 | ||||
| 2025-08-14 | 13F | Susquehanna International Group, Llp | 36,800 | -18.83 | 18 | -28.00 | ||||
| 2025-08-14 | 13F | Raymond James Financial Inc | 1,420 | 1 | ||||||
| 2025-05-16 | 13F | Jones Financial Companies Lllp | 0 | -100.00 | 0 | |||||
| 2025-07-21 | 13F | Ameritas Advisory Services, LLC | 1,000 | 1 | ||||||
| 2025-08-19 | 13F | Cape Investment Advisory, Inc. | 16 | 0.00 | 0 | |||||
| 2025-08-14 | 13F | Sunbelt Securities, Inc. | 130 | 0.00 | 0 |