Basic Stats
| Institutional Owners | 154 total, 154 long only, 0 short only, 0 long/short - change of 1.30% MRQ |
| Average Portfolio Allocation | 0.3494 % - change of -34.53% MRQ |
| Institutional Shares (Long) | 66,144,575 (ex 13D/G) - change of 8.73MM shares 15.21% MRQ |
| Institutional Value (Long) | $ 1,345,479 USD ($1000) |
Institutional Ownership and Shareholders
abrdn ETFs - abrdn Bloomberg All Commodity Strategy K-1 Free ETF (US:BCI) has 154 institutional owners and shareholders that have filed 13D/G or 13F forms with the Securities Exchange Commission (SEC). These institutions hold a total of 66,144,575 shares. Largest shareholders include Wells Fargo & Company/mn, Sei Investments Co, Metis Global Partners, LLC, Bank Of America Corp /de/, Morgan Stanley, Nepc Llc, Northwestern Mutual Wealth Management Co, Royal Bank Of Canada, Great Lakes Advisors, Llc, and Lockheed Martin Investment Management Co .
abrdn ETFs - abrdn Bloomberg All Commodity Strategy K-1 Free ETF (ARCA:BCI) institutional ownership structure shows current positions in the company by institutions and funds, as well as latest changes in position size. Major shareholders can include individual investors, mutual funds, hedge funds, or institutions. The Schedule 13D indicates that the investor holds (or held) more than 5% of the company and intends (or intended) to actively pursue a change in business strategy. Schedule 13G indicates a passive investment of over 5%.
The share price as of September 5, 2025 is 20.99 / share. Previously, on September 6, 2024, the share price was 19.07 / share. This represents an increase of 10.07% over that period.

Fund Sentiment Score
The Fund Sentiment Score (fka Ownership Accumulation Score) finds the stocks that are being most bought by funds. It is the result of a sophisticated, multi-factor quantitative model that identifies companies with the highest levels of institutional accumulation. The scoring model uses a combination of the total increase in disclosed owners, the changes in portfolio allocations in those owners and other metrics. The number ranges from 0 to 100, with higher numbers indicating a higher level of accumulation to its peers, and 50 being the average.
Update Frequency: Daily
See Ownership Explorer, which provides a list of highest-ranking companies.
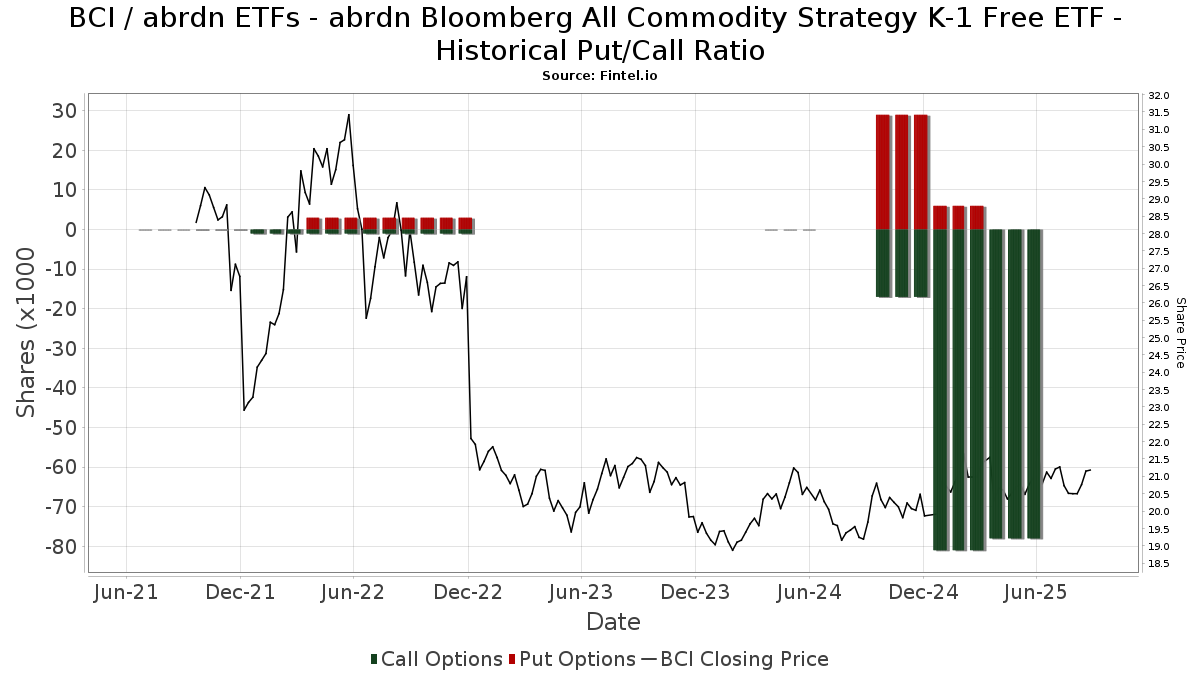
Institutional Put/Call Ratio
In addition to reporting standard equity and debt issues, institutions with more than 100MM assets under management must also disclose their put and call option holdings. Since put options generally indicate negative sentiment, and call options indicate positive sentiment, we can get a sense of the overall institutional sentiment by plotting the ratio of puts to calls. The chart to the right plots the historical put/call ratio for this instrument.
Using Put/Call Ratio as an indicator of investor sentiment overcomes one of the key deficiencies of using total institutional ownership, which is that a significant amount of assets under management are invested passively to track indices. Passively-managed funds do not typically buy options, so the put/call ratio indicator more closely tracks the sentiment of actively-managed funds.
13F and NPORT Filings
Detail on 13F filings are free. Detail on NP filings require a premium membership. Green rows indicate new positions. Red rows indicate closed positions. Click the link icon to see the full transaction history.
Upgrade
to unlock premium data and export to Excel ![]() .
.
| File Date | Source | Investor | Type | Avg Price (Est) |
Shares | Δ Shares (%) |
Reported Value ($1000) |
Δ Value (%) |
Port Alloc (%) |
|
|---|---|---|---|---|---|---|---|---|---|---|
| 2025-08-25 | NP | NDAA - Ned Davis Research 360 Dynamic Allocation ETF | 6,163 | -72.10 | 128 | -72.94 | ||||
| 2025-08-12 | 13F | Aldebaran Capital, Llc | 150,053 | -1.55 | 3,117 | -4.71 | ||||
| 2025-08-12 | 13F | Steward Partners Investment Advisory, Llc | 5,094 | 950.31 | 106 | 950.00 | ||||
| 2025-08-25 | NP | MAINSTAY VP FUNDS TRUST - MainStay VP IQ Hedge Multi-Strategy Portfolio Initial Class | 26,687 | 554 | ||||||
| 2025-07-28 | 13F | Kiker Wealth Management, LLC | 300 | 0.00 | 6 | 0.00 | ||||
| 2025-08-14 | 13F | Smartleaf Asset Management LLC | 2,509 | 52 | ||||||
| 2025-08-14 | 13F | Susquehanna International Group, Llp | 0 | -100.00 | 0 | |||||
| 2025-08-12 | 13F | Accredited Wealth Management, LLC | 22,472 | 467 | ||||||
| 2025-05-05 | 13F | Private Advisor Group, LLC | 0 | -100.00 | 0 | |||||
| 2025-08-13 | 13F | Quadrature Capital Ltd | 207,686 | 4,313 | ||||||
| 2025-08-06 | 13F | Black Swift Group, LLC | 0 | -100.00 | 0 | |||||
| 2025-06-10 | NP | LFTEX - Lincoln Inflation Plus Fund Class I | 36,700 | 0.00 | 747 | -0.80 | ||||
| 2025-06-25 | NP | QAI - IQ Hedge Multi-Strategy Tracker ETF | 88,275 | 1,796 | ||||||
| 2025-08-14 | 13F | Sunbelt Securities, Inc. | 2,493 | 0.00 | 49 | -7.55 | ||||
| 2025-08-19 | NP | NORTHWESTERN MUTUAL SERIES FUND INC - Balanced Portfolio | 258,400 | 0.00 | 5,367 | -3.23 | ||||
| 2025-08-04 | 13F | AlphaStar Capital Management, LLC | 164,769 | 3,422 | ||||||
| 2025-08-08 | 13F | Hartland & Co., LLC | 300 | 0.00 | 6 | 0.00 | ||||
| 2025-07-25 | 13F | Concurrent Investment Advisors, LLC | 11,382 | 236 | ||||||
| 2025-07-22 | 13F | MBL Wealth, LLC | 17,424 | -7.22 | 362 | -10.20 | ||||
| 2025-08-07 | 13F | Fund Evaluation Group, LLC | 20,786 | 0.00 | 432 | -3.36 | ||||
| 2025-08-14 | 13F | Ancora Advisors, LLC | 14,700 | 0.00 | 305 | -3.17 | ||||
| 2025-08-07 | 13F | Cahill Financial Advisors Inc | 24,077 | -14.95 | 500 | -17.63 | ||||
| 2025-08-18 | 13F | Hollencrest Capital Management | 28,091 | -2.96 | 583 | -6.12 | ||||
| 2025-08-11 | 13F | United Advisor Group, LLC | 16,704 | 347 | ||||||
| 2025-08-06 | 13F | Csenge Advisory Group | 38,379 | 15.32 | 779 | 13.06 | ||||
| 2025-08-08 | 13F | Creative Planning | 46,137 | -0.19 | 958 | -3.43 | ||||
| 2025-08-14 | 13F | Mml Investors Services, Llc | 30,236 | 35.11 | 1 | |||||
| 2025-08-14 | 13F | UBS Group AG | 5,644 | -34.65 | 117 | -36.76 | ||||
| 2025-08-19 | NP | NORTHWESTERN MUTUAL SERIES FUND INC - Asset Allocation Portfolio | 46,500 | 0.00 | 966 | -3.21 | ||||
| 2025-08-14 | 13F | Wells Fargo & Company/mn | 25,317,919 | 37.02 | 525,853 | 32.61 | ||||
| 2025-04-30 | 13F | Allworth Financial LP | 0 | -100.00 | 0 | |||||
| 2025-07-25 | 13F | Cwm, Llc | 2,272 | 0.00 | 0 | |||||
| 2025-05-15 | 13F/A | Orion Portfolio Solutions, LLC | 97,847 | -5.49 | 2,100 | 2.69 | ||||
| 2025-09-04 | 13F/A | Advisor Group Holdings, Inc. | 3,071 | -29.47 | 64 | -32.26 | ||||
| 2025-08-18 | 13F | Geneos Wealth Management Inc. | 86,201 | -7.94 | 1,790 | -10.90 | ||||
| 2025-07-07 | 13F | Thurston, Springer, Miller, Herd & Titak, Inc. | 4,432 | 19.98 | 92 | 16.46 | ||||
| 2025-07-16 | 13F | ORG Partners LLC | 295 | 6 | ||||||
| 2025-08-07 | 13F | Vise Technologies, Inc. | 189,276 | -1.00 | 3,931 | 4.10 | ||||
| 2025-07-24 | 13F | Ronald Blue Trust, Inc. | 255,394 | 1.79 | 5,305 | -1.49 | ||||
| 2025-07-31 | 13F | Leavell Investment Management, Inc. | 229,861 | 8.39 | 4,774 | 4.90 | ||||
| 2025-08-04 | 13F | Center for Financial Planning, Inc. | 0 | -100.00 | 0 | |||||
| 2025-08-14 | 13F | Royal Bank Of Canada | 1,461,283 | 8.43 | 30,352 | 4.94 | ||||
| 2025-05-05 | 13F | Creekmur Asset Management LLC | 0 | -100.00 | 0 | |||||
| 2025-07-11 | 13F | Farther Finance Advisors, LLC | 1,742 | 97.95 | 36 | 100.00 | ||||
| 2025-04-14 | 13F | Park Avenue Securities Llc | 0 | -100.00 | 0 | |||||
| 2025-04-21 | 13F | Envestnet Portfolio Solutions, Inc. | 0 | -100.00 | 0 | |||||
| 2025-08-26 | NP | TBFC - The Brinsmere Fund - Conservative ETF | 226,990 | 2.68 | 4,715 | -0.63 | ||||
| 2025-07-21 | 13F | Abundance Wealth Counselors | 595,964 | -0.20 | 12 | 0.00 | ||||
| 2025-08-05 | 13F | Verity Asset Management, Inc. | 0 | -100.00 | 0 | |||||
| 2025-08-08 | 13F | Cetera Investment Advisers | 81,527 | -0.83 | 1,693 | -4.02 | ||||
| 2025-08-04 | 13F | Lockheed Martin Investment Management Co | 938,100 | -5.06 | 19,484 | -8.11 | ||||
| 2025-08-13 | 13F | Victory Financial Group, Llc | 38,298 | 5.23 | 795 | 1.53 | ||||
| 2025-07-30 | 13F | Exencial Wealth Advisors, Llc | 28,548 | -18.81 | 593 | -21.49 | ||||
| 2025-08-01 | 13F | Envestnet Asset Management Inc | 349,752 | -11.45 | 7,264 | -14.30 | ||||
| 2025-08-11 | 13F | Principal Securities, Inc. | 8,832 | -9.11 | 183 | -4.19 | ||||
| 2025-07-14 | 13F | GAMMA Investing LLC | 2,090 | 0.00 | 43 | -2.27 | ||||
| 2025-08-14 | 13F | Citadel Advisors Llc | Call | 78,500 | -3.80 | 1,630 | -6.91 | |||
| 2025-07-08 | 13F | Nbc Securities, Inc. | 4,278 | 1,577.65 | 0 | |||||
| 2025-08-13 | 13F | Truvestments Capital Llc | 0 | -100.00 | 0 | |||||
| 2025-05-06 | 13F | Lifeworks Advisors, LLC | 0 | -100.00 | 0 | -100.00 | ||||
| 2025-08-14 | 13F | Atomi Financial Group, Inc. | 13,801 | -35.06 | 287 | -37.28 | ||||
| 2025-08-07 | 13F | Winthrop Capital Management, LLC | 22,654 | 0 | ||||||
| 2025-07-16 | 13F | Diversified Enterprises, LLC | 13,028 | -14.88 | 271 | -17.68 | ||||
| 2025-08-08 | 13F | Crossmark Global Holdings, Inc. | 45,662 | -4.55 | 947 | -7.52 | ||||
| 2025-08-14 | 13F | Disciplina Capital Management LLC | 394,947 | 46.20 | 8,203 | 41.50 | ||||
| 2025-08-08 | 13F | Avantax Advisory Services, Inc. | 12,704 | -34.29 | 264 | -36.47 | ||||
| 2025-08-13 | 13F | Flow Traders U.s. Llc | 0 | -100.00 | 0 | |||||
| 2025-07-29 | 13F | Werba Rubin Papier Wealth Management | 42,484 | 14.83 | 882 | 11.22 | ||||
| 2025-08-08 | 13F | Mason Street Advisors, Llc | 304,900 | 0.00 | 6,333 | -3.22 | ||||
| 2025-08-13 | 13F | Russell Investments Group, Ltd. | 0 | 0 | ||||||
| 2025-08-06 | 13F | First Horizon Advisors, Inc. | 0 | -100.00 | 0 | |||||
| 2025-07-31 | 13F | Resonant Capital Advisors, LLC | 237,666 | -0.13 | 4,936 | -3.35 | ||||
| 2025-08-01 | 13F | Rossby Financial, LCC | 0 | -100.00 | 0 | |||||
| 2025-08-14 | 13F | Raymond James Financial Inc | 321,984 | 702.15 | 6,688 | 676.66 | ||||
| 2025-05-14 | 13F | Huntington National Bank | 5 | -33.33 | ||||||
| 2025-08-14 | 13F | Evergreen Wealth Solutions, LLC | 273,489 | 3.11 | 5,680 | -0.19 | ||||
| 2025-04-23 | 13F | Continuum Advisory, LLC | 0 | -100.00 | 0 | |||||
| 2025-08-08 | 13F | Cornerstone Advisors Asset Management, Inc | 22,712 | -21.21 | 472 | -23.79 | ||||
| 2025-08-14 | 13F | Wiley Bros.-aintree Capital, Llc | 17,770 | -0.79 | 363 | -4.99 | ||||
| 2025-07-24 | 13F | Us Bancorp \de\ | 1,176 | 115.78 | 24 | 118.18 | ||||
| 2025-07-18 | 13F | Truist Financial Corp | 254,562 | -12.82 | 5,287 | -15.62 | ||||
| 2025-08-13 | 13F | Renaissance Technologies Llc | 59,300 | 1,232 | ||||||
| 2025-08-12 | 13F | Global Retirement Partners, LLC | 41 | -91.13 | 1 | -100.00 | ||||
| 2025-08-14 | 13F | CoreCap Advisors, LLC | 9 | -87.84 | 0 | -100.00 | ||||
| 2025-08-27 | 13F/A | Brinker Capital Investments, LLC | 91,922 | -6.06 | 1,909 | -9.05 | ||||
| 2025-08-13 | 13F | Mount Yale Investment Advisors, LLC | 12,525 | 260 | ||||||
| 2025-08-05 | 13F | C2P Capital Advisory Group, LLC d.b.a. Prosperity Capital Advisors | 0 | -100.00 | 0 | |||||
| 2025-07-23 | 13F | Austin Asset Management Co Inc | 29,638 | -0.10 | 616 | -3.30 | ||||
| 2025-08-13 | 13F | Financial & Tax Architects, LLC | 0 | -100.00 | 0 | |||||
| 2025-08-13 | 13F | Avestar Capital, LLC | 103,914 | 20.73 | 2,158 | 16.84 | ||||
| 2025-04-17 | 13F | Rs Crum Inc. | 156,425 | 3,357 | ||||||
| 2025-08-13 | 13F | Leuthold Group, Llc | 36,609 | 0.00 | 760 | -3.18 | ||||
| 2025-08-11 | 13F | Rothschild Investment Llc | 92 | 0.00 | 2 | 0.00 | ||||
| 2025-07-02 | 13F | Boston Standard Wealth Management, LLC | 40,047 | 29.55 | 832 | 32.48 | ||||
| 2025-07-17 | 13F | Keystone Global Partners, LLC | 0 | -100.00 | 0 | |||||
| 2025-08-14 | 13F | Fmr Llc | 267 | 1,113.64 | 6 | |||||
| 2025-08-05 | 13F | Advisors Preferred, LLC | 0 | -100.00 | 0 | |||||
| 2025-08-12 | 13F | Twin Focus Capital Partners, Llc | 0 | -100.00 | 0 | |||||
| 2025-08-13 | 13F | Cresset Asset Management, LLC | 705,422 | 6.35 | 14,652 | 2.92 | ||||
| 2025-08-14 | 13F | Stifel Financial Corp | 486,767 | -3.08 | 10,110 | -6.19 | ||||
| 2025-07-10 | 13F | Signal Advisors Wealth, LLC | 30,806 | 640 | ||||||
| 2025-08-15 | 13F | Morgan Stanley | 2,244,727 | 92.00 | 46,623 | 85.83 | ||||
| 2025-07-31 | 13F | Whipplewood Advisors, LLC | 1,114 | -90.58 | 23 | -14.81 | ||||
| 2025-08-08 | 13F | Empower Advisory Group, LLC | 20,115 | 418 | ||||||
| 2025-08-13 | 13F | Aristides Capital LLC | 30,000 | 0.00 | 623 | -3.11 | ||||
| 2025-07-16 | 13F | Perigon Wealth Management, LLC | 24,492 | -17.55 | 509 | -20.25 | ||||
| 2025-08-14 | 13F | Toroso Investments, LLC | 0 | -100.00 | 0 | |||||
| 2025-08-08 | 13F | MTM Investment Management, LLC | 4,980 | 103 | ||||||
| 2025-07-14 | 13F | AdvisorNet Financial, Inc | 4,371 | 7.77 | 91 | 3.45 | ||||
| 2025-07-31 | 13F | Cambridge Investment Research Advisors, Inc. | 33,156 | -23.53 | 1 | |||||
| 2025-07-10 | 13F | Wealth Enhancement Advisory Services, Llc | 149,107 | -8.26 | 3,143 | -9.87 | ||||
| 2025-07-30 | 13F | Whittier Trust Co | 1,080 | 22 | ||||||
| 2025-07-22 | 13F | Merit Financial Group, LLC | 54,268 | 37.80 | 1,127 | 33.37 | ||||
| 2025-08-14 | 13F | Macquarie Group Ltd | 147,001 | -11.30 | 3,053 | -14.15 | ||||
| 2025-08-19 | 13F | Cape Investment Advisory, Inc. | 581 | -22.84 | 12 | -25.00 | ||||
| 2025-07-30 | 13F | D.a. Davidson & Co. | 11,827 | -37.05 | 246 | -39.21 | ||||
| 2025-08-14 | 13F | Nepc Llc | 2,175,486 | 18.55 | 45,185 | 14.73 | ||||
| 2025-08-11 | 13F | Anfield Capital Management, LLC | 1,021 | 186.80 | 21 | 200.00 | ||||
| 2025-08-11 | 13F | Wealthspire Advisors, LLC | 21,115 | 0.00 | 439 | -3.31 | ||||
| 2025-08-06 | 13F | Walkner Condon Financial Advisors LLC | 30,713 | -16.29 | 638 | -18.93 | ||||
| 2025-08-04 | 13F | Spire Wealth Management | 0 | -100.00 | 0 | |||||
| 2025-08-14 | 13F | Sei Investments Co | 7,953,374 | -17.00 | 165,189 | -19.67 | ||||
| 2025-07-07 | 13F | Upper Left Wealth Management, LLC | 296,586 | 4.50 | 6,160 | 1.15 | ||||
| 2025-05-08 | NP | QALTX - Quantified Alternative Investment Fund Investor Class Shares | 7,900 | 170 | ||||||
| 2025-07-21 | 13F | Ameritas Advisory Services, LLC | 349 | 7 | ||||||
| 2025-05-09 | 13F | Atria Wealth Solutions, Inc. | 0 | -100.00 | 0 | |||||
| 2025-08-14 | 13F | Bank Of America Corp /de/ | 2,577,292 | 34.95 | 53,530 | 30.62 | ||||
| 2025-08-14 | 13F | Mariner, LLC | 29,191 | 606 | ||||||
| 2025-07-29 | 13F | Stratos Wealth Partners, LTD. | 0 | -100.00 | 0 | |||||
| 2025-04-29 | 13F | Td Private Client Wealth Llc | 0 | -100.00 | 0 | |||||
| 2025-08-11 | 13F | Compass Capital Corp /ma/ /adv | 0 | -100.00 | 0 | |||||
| 2025-08-19 | 13F | Advisory Services Network, LLC | 64,723 | 0.36 | 1,336 | -3.47 | ||||
| 2025-08-11 | 13F | Aspen Investment Management Inc | 33,885 | -11.03 | 1 | |||||
| 2025-07-10 | 13F | Oliver Lagore Vanvalin Investment Group | 75 | 2 | ||||||
| 2025-05-14 | 13F | Congress Wealth Management LLC / DE / | 0 | -100.00 | 0 | |||||
| 2025-08-05 | 13F | Sigma Planning Corp | 9,866 | 0.00 | 205 | -3.32 | ||||
| 2025-08-01 | 13F | New York Life Investment Management Llc | 121,072 | 2,515 | ||||||
| 2025-07-30 | 13F | Whittier Trust Co Of Nevada Inc | 2,131 | 0.00 | 44 | -2.22 | ||||
| 2025-08-19 | 13F | Wealth Group, Ltd. | 0 | -100.00 | 0 | |||||
| 2025-08-05 | 13F | Key FInancial Inc | 17 | 0.00 | 0 | |||||
| 2025-04-30 | 13F | Ramiah Investment Group | 50,804 | 38.51 | 1,090 | 53.52 | ||||
| 2025-07-24 | 13F | Callan Family Office, LLC | 13,577 | 0.00 | 282 | -3.44 | ||||
| 2025-08-06 | 13F | Commonwealth Equity Services, Llc | 12,917 | 5.91 | 0 | |||||
| 2025-05-15 | 13F | Fullerton Fund Management Co Ltd | 0 | -100.00 | 0 | |||||
| 2025-08-11 | 13F | HighTower Advisors, LLC | 43,254 | 13.81 | 898 | 10.18 | ||||
| 2025-08-14 | 13F | Vident Advisory, LLC | 22,445 | 91.17 | 466 | 85.66 | ||||
| 2025-07-30 | 13F | Cullen/frost Bankers, Inc. | 0 | -100.00 | 0 | |||||
| 2025-05-15 | 13F | Tower Research Capital LLC (TRC) | 0 | -100.00 | 0 | |||||
| 2025-08-14 | 13F | IHT Wealth Management, LLC | 11,175 | -28.01 | 232 | -30.33 | ||||
| 2025-05-28 | 13F/A | Modern Wealth Management, LLC | 12,301 | 238 | ||||||
| 2025-08-14 | 13F | Bnp Paribas Arbitrage, Sa | 4,698 | 98 | ||||||
| 2025-08-14 | 13F | Alliancebernstein L.p. | 174,950 | 3,634 | ||||||
| 2025-07-11 | 13F | Pinnacle Bancorp, Inc. | 256 | 0.00 | 5 | 0.00 | ||||
| 2025-07-24 | 13F | Comprehensive Money Management Services LLC | 57,211 | -2.78 | 1,188 | -5.86 | ||||
| 2025-08-13 | 13F | Transce3nd, LLC | 13 | 0.00 | 0 | |||||
| 2025-05-08 | 13F | Parkside Financial Bank & Trust | 0 | -100.00 | 0 | -100.00 | ||||
| 2025-07-22 | 13F | Marks Group Wealth Management, Inc | 0 | -100.00 | 0 | |||||
| 2025-08-14 | 13F | GWM Advisors LLC | 50,578 | -17.79 | 1,051 | -20.45 | ||||
| 2025-04-10 | 13F | Retirement Planning Group | 0 | -100.00 | 0 | |||||
| 2025-08-14 | 13F | Comerica Bank | 18,594 | 57.80 | 386 | 53.17 | ||||
| 2025-08-13 | 13F | Jones Financial Companies Lllp | 0 | -100.00 | 0 | |||||
| 2025-07-08 | 13F | Braun-Bostich & Associates Inc. | 0 | -100.00 | 0 | |||||
| 2025-08-08 | 13F | Principal Financial Group Inc | 285,250 | 5,925 | ||||||
| 2025-08-11 | 13F | Citigroup Inc | 9 | 0 | ||||||
| 2025-08-01 | 13F | American Financial & Tax Strategies Inc | 130,550 | -11.82 | 2,712 | -14.67 | ||||
| 2025-07-11 | 13F | Williams Financial, LLC | 0 | -100.00 | 0 | |||||
| 2025-08-06 | 13F | Penserra Capital Management LLC | 598,877 | 2.59 | 12 | 0.00 | ||||
| 2025-07-28 | 13F | Harbour Investments, Inc. | 1,210 | 0.08 | 25 | 0.00 | ||||
| 2025-08-14 | 13F | Citadel Advisors Llc | Put | 0 | -100.00 | 0 | ||||
| 2025-08-06 | 13F | Metis Global Partners, LLC | 7,925,004 | 27.74 | 164,602 | 23.63 | ||||
| 2025-08-14 | 13F | Cohen & Steers, Inc. | 35,159 | -12.70 | 1 | |||||
| 2025-08-04 | 13F | Creative Financial Designs Inc /adv | 150 | 0.00 | 3 | 0.00 | ||||
| 2025-08-04 | 13F | Assetmark, Inc | 330 | 3,566.67 | 7 | |||||
| 2025-07-07 | 13F | Versant Capital Management, Inc | 20 | 0.00 | 0 | |||||
| 2025-07-18 | 13F | SigFig Wealth Management, LLC | 191,010 | 15.87 | 3,988 | 13.59 | ||||
| 2025-04-30 | 13F | ARGI Investment Services, LLC | 0 | -100.00 | 0 | |||||
| 2025-07-24 | 13F | IFP Advisors, Inc | 0 | -100.00 | 0 | |||||
| 2025-05-08 | 13F | Banque Cantonale Vaudoise | 0 | -100.00 | 0 | |||||
| 2025-07-09 | 13F | Bruce G. Allen Investments, LLC | 30,065 | -0.43 | 624 | -3.55 | ||||
| 2025-07-10 | 13F | Stewardship Advisors, LLC | 13,438 | -18.63 | 279 | -21.19 | ||||
| 2025-07-17 | 13F | K2 Financial Inc. | 78,706 | 5.81 | 1,661 | 8.07 | ||||
| 2025-08-11 | 13F | WPG Advisers, LLC | 4,629 | -23.73 | 96 | -26.15 | ||||
| 2025-08-12 | 13F | Rock Creek Group, LP | 0 | -100.00 | 0 | |||||
| 2025-08-12 | 13F | Proequities, Inc. | 0 | 0 | ||||||
| 2025-08-12 | 13F | Jpmorgan Chase & Co | 30 | -93.42 | 1 | -100.00 | ||||
| 2025-08-11 | 13F | Brown Brothers Harriman & Co | 1,900 | 39 | ||||||
| 2025-07-15 | 13F | MCF Advisors LLC | 935,435 | 1.03 | 19,429 | -2.22 | ||||
| 2025-06-05 | 13F | Cim, Llc | 0 | -100.00 | 0 | |||||
| 2025-08-08 | 13F | Pnc Financial Services Group, Inc. | 970 | 0.00 | 20 | 0.00 | ||||
| 2025-07-07 | 13F | Bangor Savings Bank | 2,280 | 0.00 | 47 | -2.08 | ||||
| 2025-06-25 | NP | DPREX - Delaware Global Listed Real Assets Fund CLASS A | 152,691 | -10.44 | 3,107 | -11.13 | ||||
| 2025-08-26 | NP | TBFG - The Brinsmere Fund - Growth ETF | 371,887 | 2.54 | 7,724 | -0.76 | ||||
| 2025-08-13 | 13F | Northwestern Mutual Wealth Management Co | 2,018,914 | 22.64 | 41,933 | 18.70 | ||||
| 2025-08-14 | 13F | Ambassador Advisors, LLC | 22,979 | 2.80 | 477 | -0.42 | ||||
| 2025-08-11 | 13F | Aptus Capital Advisors, LLC | 11,545 | 0.00 | 240 | -3.24 | ||||
| 2025-08-19 | 13F/A | Pitcairn Co | 187,136 | 0.00 | 3,887 | -3.21 | ||||
| 2025-08-11 | 13F | Great Lakes Advisors, Llc | 1,454,571 | -6.30 | 30,211 | -9.31 | ||||
| 2025-08-12 | 13F | LPL Financial LLC | 144,921 | 11.20 | 3,010 | 7.65 | ||||
| 2025-08-15 | 13F | Captrust Financial Advisors | 43,885 | 39.43 | 911 | 34.96 | ||||
| 2025-08-22 | 13F | Carter Financial Group, INC. | 47,380 | 35.50 | 984 | -1.99 |