Basic Stats
| Institutional Owners | 28 total, 23 long only, 0 short only, 5 long/short - change of 7.69% MRQ |
| Average Portfolio Allocation | 0.0362 % - change of -70.78% MRQ |
| Institutional Shares (Long) | 289,068 (ex 13D/G) - change of 0.05MM shares 20.95% MRQ |
| Institutional Value (Long) | $ 19,584 USD ($1000) |
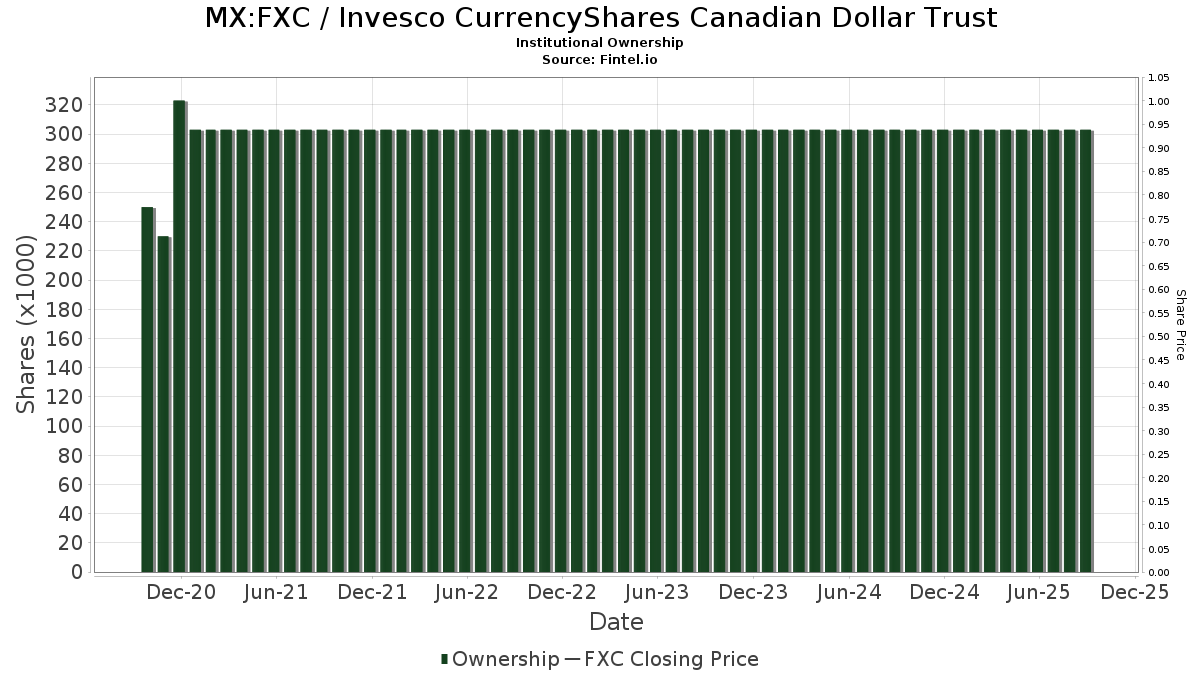
Institutional Ownership and Shareholders
Invesco CurrencyShares Canadian Dollar Trust (MX:FXC) has 28 institutional owners and shareholders that have filed 13D/G or 13F forms with the Securities Exchange Commission (SEC). These institutions hold a total of 289,068 shares. Largest shareholders include Citadel Advisors Llc, Royal Bank Of Canada, Jane Street Group, Llc, Citadel Advisors Llc, Ashton Thomas Private Wealth, LLC, Jane Street Group, Llc, Susquehanna International Group, Llp, Susquehanna International Group, Llp, LPL Financial LLC, and Wolverine Trading, Llc .
Invesco CurrencyShares Canadian Dollar Trust (BMV:FXC) institutional ownership structure shows current positions in the company by institutions and funds, as well as latest changes in position size. Major shareholders can include individual investors, mutual funds, hedge funds, or institutions. The Schedule 13D indicates that the investor holds (or held) more than 5% of the company and intends (or intended) to actively pursue a change in business strategy. Schedule 13G indicates a passive investment of over 5%.
Fund Sentiment Score
The Fund Sentiment Score (fka Ownership Accumulation Score) finds the stocks that are being most bought by funds. It is the result of a sophisticated, multi-factor quantitative model that identifies companies with the highest levels of institutional accumulation. The scoring model uses a combination of the total increase in disclosed owners, the changes in portfolio allocations in those owners and other metrics. The number ranges from 0 to 100, with higher numbers indicating a higher level of accumulation to its peers, and 50 being the average.
Update Frequency: Daily
See Ownership Explorer, which provides a list of highest-ranking companies.
13F and NPORT Filings
Detail on 13F filings are free. Detail on NP filings require a premium membership. Green rows indicate new positions. Red rows indicate closed positions. Click the link icon to see the full transaction history.
Upgrade
to unlock premium data and export to Excel ![]() .
.
| File Date | Source | Investor | Type | Avg Price (Est) |
Shares | Δ Shares (%) |
Reported Value ($1000) |
Δ Value (%) |
Port Alloc (%) |
|
|---|---|---|---|---|---|---|---|---|---|---|
| 2025-08-18 | 13F/A | National Bank Of Canada /fi/ | 123 | 0.00 | 9 | 0.00 | ||||
| 2025-08-14 | 13F | Bank Of America Corp /de/ | 6,690 | 54.72 | 480 | 63.82 | ||||
| 2025-08-18 | 13F | Geneos Wealth Management Inc. | 726 | 0.14 | 52 | 6.12 | ||||
| 2025-08-14 | 13F | Susquehanna International Group, Llp | 0 | -100.00 | 0 | |||||
| 2025-08-11 | 13F | CFS Investment Advisory Services, LLC | 4,898 | 0.00 | 0 | |||||
| 2025-08-08 | 13F | Pnc Financial Services Group, Inc. | 220 | 0.00 | 16 | 7.14 | ||||
| 2025-07-31 | 13F | Richards, Merrill & Peterson, Inc. | 0 | -100.00 | 0 | |||||
| 2025-07-03 | 13F | Fiduciary Financial Group, Llc | 3,208 | 0.25 | 230 | 2.69 | ||||
| 2025-07-29 | 13F | Private Trust Co Na | 95 | 7 | ||||||
| 2025-08-12 | 13F | LPL Financial LLC | 17,331 | 453.35 | 1,245 | 486.79 | ||||
| 2025-08-05 | 13F | Simplex Trading, Llc | Put | 1,600 | -77.46 | 0 | ||||
| 2025-08-14 | 13F | Ancora Advisors, LLC | 1,000 | -50.00 | 72 | -47.41 | ||||
| 2025-08-13 | 13F/A | StoneX Group Inc. | 4,444 | -8.90 | 322 | -7.76 | ||||
| 2025-08-05 | 13F | Simplex Trading, Llc | Call | 6,200 | 1.64 | 0 | ||||
| 2025-08-01 | 13F | Unconventional Investor, LLC | 7,140 | 513 | ||||||
| 2025-08-15 | 13F | Morgan Stanley | 8,729 | 54.06 | 627 | 62.60 | ||||
| 2025-08-12 | 13F | MAI Capital Management | 4 | 0.00 | 0 | |||||
| 2025-08-14 | 13F | Royal Bank Of Canada | 64,780 | 8.08 | 4,651 | 14.13 | ||||
| 2025-07-31 | 13F | Cambridge Investment Research Advisors, Inc. | 2,805 | 0 | ||||||
| 2025-08-05 | 13F | Bank Of Montreal /can/ | 0 | -100.00 | 0 | |||||
| 2025-08-18 | 13F | Wolverine Trading, Llc | Put | 6,700 | -78.66 | 478 | -77.72 | |||
| 2025-08-18 | 13F | Wolverine Trading, Llc | 9,578 | -68.26 | 684 | -66.88 | ||||
| 2025-08-12 | 13F | Virtu Financial LLC | 8,423 | 1 | ||||||
| 2025-08-14 | 13F | UBS Group AG | 1,991 | 42.21 | 143 | 49.47 | ||||
| 2025-08-04 | 13F | Center for Financial Planning, Inc. | 735 | 0.00 | 53 | 6.12 | ||||
| 2025-08-01 | 13F | Ashton Thomas Private Wealth, LLC | 29,138 | -26.49 | 2,092 | -22.35 | ||||
| 2025-08-14 | 13F | Jane Street Group, Llc | 28,072 | 188.87 | 2,016 | 205.30 | ||||
| 2025-08-14 | 13F | Citadel Advisors Llc | 79,854 | 5,734 | ||||||
| 2025-08-18 | 13F | Wolverine Trading, Llc | Call | 0 | -100.00 | 0 | -100.00 | |||
| 2025-08-14 | 13F | Group One Trading, L.p. | 0 | -100.00 | 0 | |||||
| 2025-08-14 | 13F | Jane Street Group, Llc | Put | 6,700 | 481 | |||||
| 2025-08-14 | 13F | Citadel Advisors Llc | Put | 6,000 | -53.12 | 431 | -50.57 | |||
| 2025-08-14 | 13F | Jane Street Group, Llc | Call | 58,800 | 4,222 | |||||
| 2025-08-14 | 13F | Wells Fargo & Company/mn | 475 | 64.36 | 34 | 78.95 | ||||
| 2025-08-14 | 13F | Group One Trading, L.p. | Put | 0 | -100.00 | 0 | ||||
| 2025-08-14 | 13F | Citadel Advisors Llc | Call | 54,800 | -30.28 | 3,935 | -26.37 | |||
| 2025-08-12 | 13F | Proequities, Inc. | Put | 0 | 0 | |||||
| 2025-08-12 | 13F | Proequities, Inc. | Call | 0 | 0 | |||||
| 2025-08-12 | 13F | Proequities, Inc. | 0 | 0 | ||||||
| 2025-08-15 | 13F | Tower Research Capital LLC (TRC) | 4 | 0 | ||||||
| 2025-08-14 | 13F | Susquehanna International Group, Llp | Put | 22,900 | 518.92 | 1,644 | 554.98 | |||
| 2025-09-04 | 13F/A | Advisor Group Holdings, Inc. | 104 | 0.00 | 7 | 0.00 | ||||
| 2025-08-14 | 13F | Susquehanna International Group, Llp | Call | 18,100 | -81.85 | 1,300 | -80.84 | |||
| 2025-05-14 | 13F | Van Hulzen Asset Management, LLC | 0 | -100.00 | 0 | -100.00 | ||||
| 2025-08-04 | 13F | Haven Private, LLC | 8,501 | 610 | ||||||
| 2025-05-12 | 13F | Simplex Trading, Llc | 0 | -100.00 | 0 |
Other Listings
| US:FXC | $70.55 |