Basic Stats
| Institutional Shares (Long) | 432,972 - 3.26% (ex 13D/G) - change of 0.02MM shares 4.41% MRQ |
| Institutional Value (Long) | $ 526 USD ($1000) |
Institutional Ownership and Shareholders
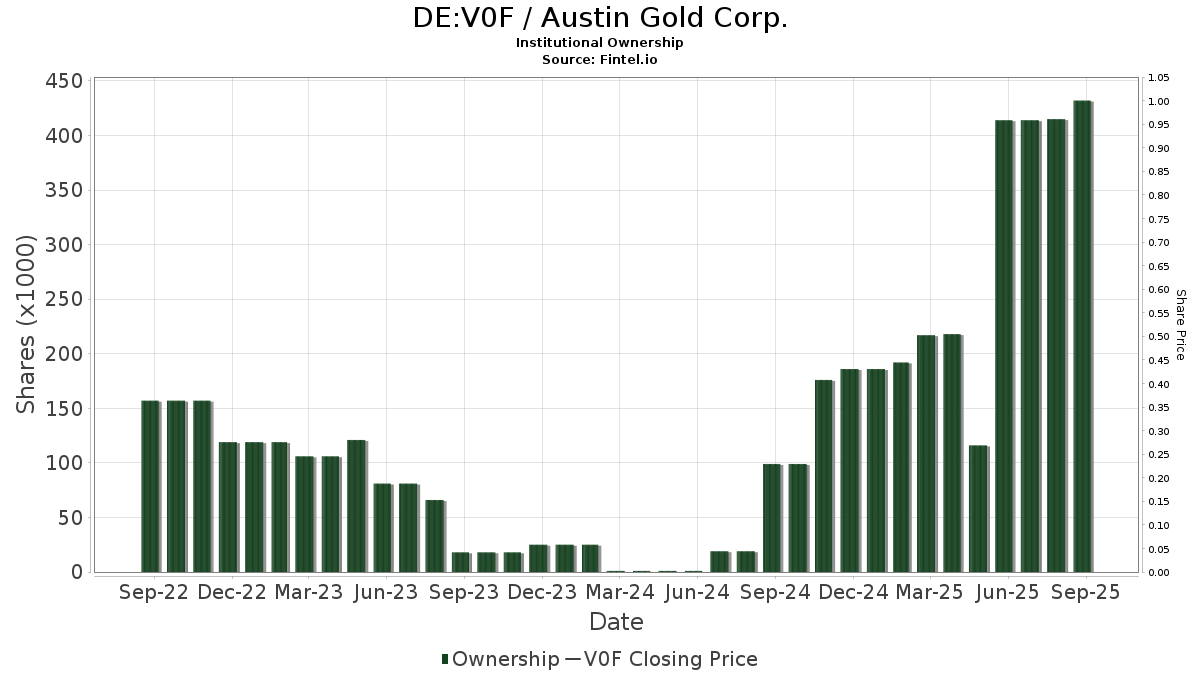
Austin Gold Corp. (DE:V0F) has 10 institutional owners and shareholders that have filed 13D/G or 13F forms with the Securities Exchange Commission (SEC). These institutions hold a total of 432,972 shares. Largest shareholders include Morgan Stanley, Citadel Advisors Llc, XTX Topco Ltd, Peak Financial Management, Inc., Virtu Financial LLC, Susquehanna International Group, Llp, Allworth Financial LP, Oliver Lagore Vanvalin Investment Group, TD Waterhouse Canada Inc., and Advisor Group Holdings, Inc. .
Austin Gold Corp. (DB:V0F) institutional ownership structure shows current positions in the company by institutions and funds, as well as latest changes in position size. Major shareholders can include individual investors, mutual funds, hedge funds, or institutions. The Schedule 13D indicates that the investor holds (or held) more than 5% of the company and intends (or intended) to actively pursue a change in business strategy. Schedule 13G indicates a passive investment of over 5%.
Fund Sentiment Score
The Fund Sentiment Score (fka Ownership Accumulation Score) finds the stocks that are being most bought by funds. It is the result of a sophisticated, multi-factor quantitative model that identifies companies with the highest levels of institutional accumulation. The scoring model uses a combination of the total increase in disclosed owners, the changes in portfolio allocations in those owners and other metrics. The number ranges from 0 to 100, with higher numbers indicating a higher level of accumulation to its peers, and 50 being the average.
Update Frequency: Daily
See Ownership Explorer, which provides a list of highest-ranking companies.
13F and NPORT Filings
Detail on 13F filings are free. Detail on NP filings require a premium membership. Green rows indicate new positions. Red rows indicate closed positions. Click the link icon to see the full transaction history.
Upgrade
to unlock premium data and export to Excel ![]() .
.
| File Date | Source | Investor | Type | Avg Price (Est) |
Shares | Δ Shares (%) |
Reported Value ($1000) |
Δ Value (%) |
Port Alloc (%) |
|
|---|---|---|---|---|---|---|---|---|---|---|
| 2025-08-11 | 13F | TD Waterhouse Canada Inc. | 1,000 | 0.00 | 1 | 0.00 | ||||
| 2025-05-13 | 13F | Ground Swell Capital, LLC | 0 | -100.00 | 0 | |||||
| 2025-08-12 | 13F | XTX Topco Ltd | 33,927 | 12.81 | 44 | 10.26 | ||||
| 2025-08-12 | 13F | Proequities, Inc. | 0 | 0 | ||||||
| 2025-08-15 | 13F | Morgan Stanley | 168,600 | 28.12 | 217 | 26.90 | ||||
| 2025-08-14 | 13F | Susquehanna International Group, Llp | 14,721 | -76.32 | 19 | -77.50 | ||||
| 2025-08-14 | 13F | Two Sigma Securities, Llc | 0 | -100.00 | 0 | |||||
| 2025-05-15 | 13F | Tower Research Capital LLC (TRC) | 0 | -100.00 | 0 | |||||
| 2025-05-16 | 13F | Jones Financial Companies Lllp | 0 | -100.00 | 0 | |||||
| 2025-07-23 | 13F | Peak Financial Management, Inc. | 24,000 | 0.00 | 31 | -3.23 | ||||
| 2025-09-04 | 13F/A | Advisor Group Holdings, Inc. | 750 | 1 | ||||||
| 2025-08-12 | 13F | Virtu Financial LLC | 20,081 | 0 | ||||||
| 2025-08-07 | 13F | Allworth Financial LP | 6,000 | 0.00 | 8 | 0.00 | ||||
| 2025-08-14 | 13F | Citadel Advisors Llc | 162,561 | 13.59 | 210 | 12.37 | ||||
| 2025-07-10 | 13F | Oliver Lagore Vanvalin Investment Group | 1,332 | 42.92 | 2 | 0.00 |
Other Listings
| US:AUST | 1,79 US$ |