Basic Stats
| Institutional Shares (Long) | 2,713,139 - 1.70% (ex 13D/G) - change of -0.07MM shares -2.43% MRQ |
| Institutional Value (Long) | $ 247 USD ($1000) |
Institutional Ownership and Shareholders
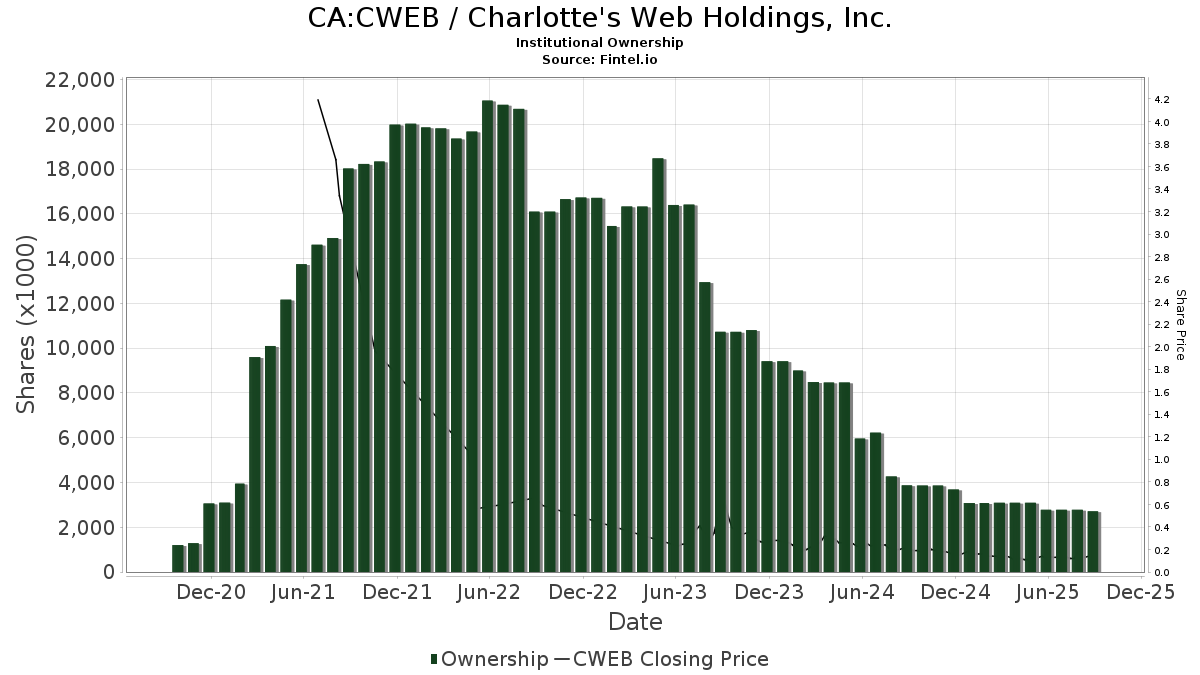
Charlotte's Web Holdings, Inc. (CA:CWEB) has 5 institutional owners and shareholders that have filed 13D/G or 13F forms with the Securities Exchange Commission (SEC). These institutions hold a total of 2,713,139 shares. Largest shareholders include YOLO - AdvisorShares Pure Cannabis ETF, CNBS - Amplify Seymour Cannabis ETF, Vermillion & White Wealth Management Group, LLC, Main Street Group, LTD, and Wealth Preservation Advisors, LLC .
Charlotte's Web Holdings, Inc. (TSX:CWEB) institutional ownership structure shows current positions in the company by institutions and funds, as well as latest changes in position size. Major shareholders can include individual investors, mutual funds, hedge funds, or institutions. The Schedule 13D indicates that the investor holds (or held) more than 5% of the company and intends (or intended) to actively pursue a change in business strategy. Schedule 13G indicates a passive investment of over 5%.
The share price as of September 5, 2025 is 0.14 / share. Previously, on September 9, 2024, the share price was 0.20 / share. This represents a decline of 32.50% over that period.
Fund Sentiment Score
The Fund Sentiment Score (fka Ownership Accumulation Score) finds the stocks that are being most bought by funds. It is the result of a sophisticated, multi-factor quantitative model that identifies companies with the highest levels of institutional accumulation. The scoring model uses a combination of the total increase in disclosed owners, the changes in portfolio allocations in those owners and other metrics. The number ranges from 0 to 100, with higher numbers indicating a higher level of accumulation to its peers, and 50 being the average.
Update Frequency: Daily
See Ownership Explorer, which provides a list of highest-ranking companies.
13F and NPORT Filings
Detail on 13F filings are free. Detail on NP filings require a premium membership. Green rows indicate new positions. Red rows indicate closed positions. Click the link icon to see the full transaction history.
Upgrade
to unlock premium data and export to Excel ![]() .
.
| File Date | Source | Investor | Type | Avg Price (Est) |
Shares | Δ Shares (%) |
Reported Value ($1000) |
Δ Value (%) |
Port Alloc (%) |
|
|---|---|---|---|---|---|---|---|---|---|---|
| 2025-08-25 | NP | YOLO - AdvisorShares Pure Cannabis ETF | 2,039,555 | 0.77 | 187 | 2.20 | ||||
| 2025-08-14 | 13F | Wealth Preservation Advisors, LLC | 3 | 0.00 | 0 | |||||
| 2025-07-15 | 13F | Main Street Group, LTD | 100 | 0.00 | 0 | |||||
| 2025-08-28 | NP | CNBS - Amplify Seymour Cannabis ETF | 673,281 | -11.01 | 62 | -10.29 | ||||
| 2025-08-13 | 13F | Vermillion & White Wealth Management Group, LLC | 200 | 100.00 | 0 |