Basic Stats
| Institutional Shares (Long) | 2,172,596 - 0.75% (ex 13D/G) - change of 0.19MM shares 9.79% MRQ |
| Institutional Value (Long) | $ 19,691 USD ($1000) |
Institutional Ownership and Shareholders
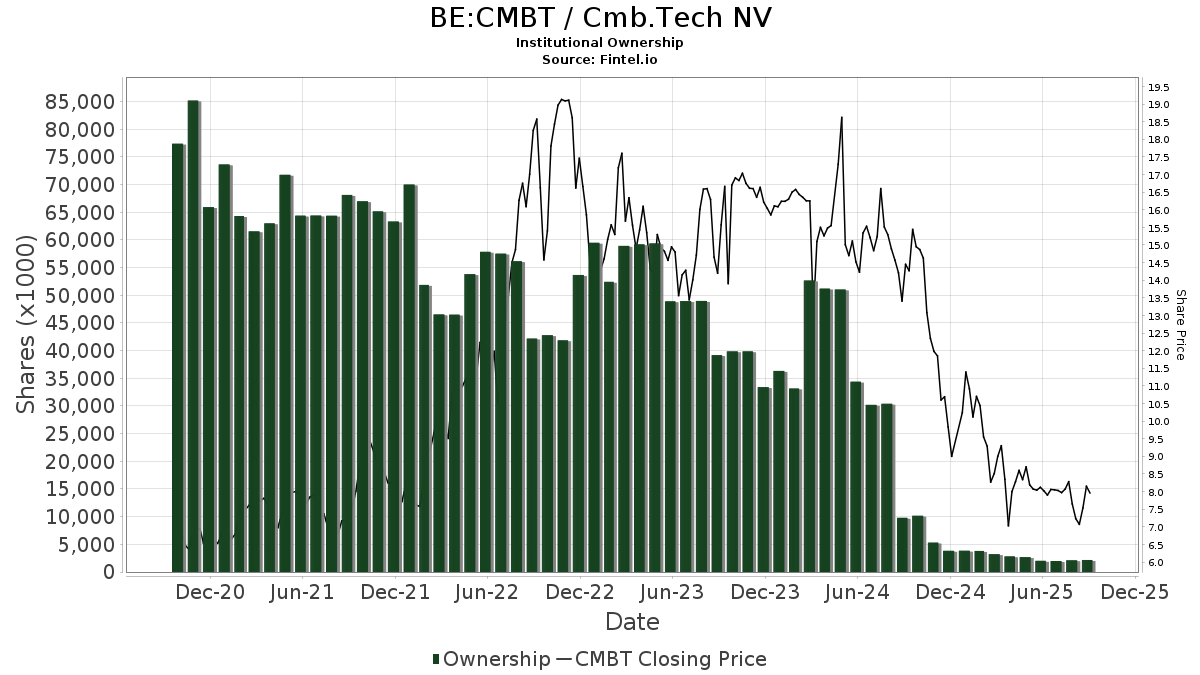
Cmb.Tech NV (BE:CMBT) has 55 institutional owners and shareholders that have filed 13D/G or 13F forms with the Securities Exchange Commission (SEC). These institutions hold a total of 2,172,596 shares. Largest shareholders include Uniplan Investment Counsel, Inc., Norges Bank, UBS Group AG, Susquehanna International Group, Llp, DFAI - Dimensional International Core Equity Market ETF, Vanguard Group Inc, Mariner, LLC, DRISX - Foundry Partners Fundamental Small Cap Value Fund Institutional Class, DFAX - Dimensional World ex U.S. Core Equity 2 ETF, and DFIC - Dimensional International Core Equity 2 ETF .
Cmb.Tech NV (ENXTBR:CMBT) institutional ownership structure shows current positions in the company by institutions and funds, as well as latest changes in position size. Major shareholders can include individual investors, mutual funds, hedge funds, or institutions. The Schedule 13D indicates that the investor holds (or held) more than 5% of the company and intends (or intended) to actively pursue a change in business strategy. Schedule 13G indicates a passive investment of over 5%.
The share price as of September 5, 2025 is 7.68 / share. Previously, on September 9, 2024, the share price was 13.64 / share. This represents a decline of 43.70% over that period.
Fund Sentiment Score
The Fund Sentiment Score (fka Ownership Accumulation Score) finds the stocks that are being most bought by funds. It is the result of a sophisticated, multi-factor quantitative model that identifies companies with the highest levels of institutional accumulation. The scoring model uses a combination of the total increase in disclosed owners, the changes in portfolio allocations in those owners and other metrics. The number ranges from 0 to 100, with higher numbers indicating a higher level of accumulation to its peers, and 50 being the average.
Update Frequency: Daily
See Ownership Explorer, which provides a list of highest-ranking companies.
13F and NPORT Filings
Detail on 13F filings are free. Detail on NP filings require a premium membership. Green rows indicate new positions. Red rows indicate closed positions. Click the link icon to see the full transaction history.
Upgrade
to unlock premium data and export to Excel ![]() .
.
| File Date | Source | Investor | Type | Avg Price (Est) |
Shares | Δ Shares (%) |
Reported Value ($1000) |
Δ Value (%) |
Port Alloc (%) |
|
|---|---|---|---|---|---|---|---|---|---|---|
| 2025-08-12 | 13F | XTX Topco Ltd | 0 | -100.00 | 0 | |||||
| 2025-06-26 | NP | DFIS - Dimensional International Small Cap ETF | 41,222 | -32.45 | 392 | -40.43 | ||||
| 2025-07-24 | 13F | Us Bancorp \de\ | 0 | -100.00 | 0 | |||||
| 2025-06-26 | NP | DFAI - Dimensional International Core Equity Market ETF | 135,357 | -8.14 | 1,287 | -19.01 | ||||
| 2025-08-13 | 13F | Norges Bank | 312,596 | 2,847 | ||||||
| 2025-08-14 | 13F | Group One Trading, L.p. | 38,593 | 60.61 | 348 | 59.63 | ||||
| 2025-07-24 | 13F/A | Mraz, Amerine & Associates, Inc. | 0 | -100.00 | 0 | -100.00 | ||||
| 2025-08-14 | 13F | RBF Capital, LLC | 15,955 | 0.00 | 144 | -0.69 | ||||
| 2025-03-31 | NP | DRISX - Foundry Partners Fundamental Small Cap Value Fund Institutional Class | 108,869 | -57.49 | 1,175 | -67.04 | ||||
| 2025-06-26 | NP | DFAX - Dimensional World ex U.S. Core Equity 2 ETF | 91,996 | 0.00 | 875 | -11.90 | ||||
| 2025-07-24 | 13F | Lester Murray Antman dba SimplyRich | 34,206 | -0.61 | 0 | |||||
| 2025-06-30 | NP | PDN - Invesco FTSE RAFI Developed Markets ex-U.S. Small-Mid ETF This fund is a listed as child fund of Invesco Ltd. and if that institution has disclosed ownership in this security, then these positions will not be double counted when calculating total shares and total value | 0 | -100.00 | 0 | -100.00 | ||||
| 2025-08-14 | 13F | Wells Fargo & Company/mn | 590 | -17.13 | 5 | -16.67 | ||||
| 2025-05-12 | 13F | Townsquare Capital Llc | 0 | -100.00 | 0 | -100.00 | ||||
| 2025-08-14 | 13F | Css Llc/il | 0 | -100.00 | 0 | |||||
| 2025-08-14 | 13F | Qube Research & Technologies Ltd | 0 | -100.00 | 0 | -100.00 | ||||
| 2025-08-14 | 13F | Css Llc/il | Put | 0 | -100.00 | 0 | ||||
| 2025-08-11 | 13F | Vanguard Group Inc | 135,033 | 1,232 | ||||||
| 2025-08-12 | 13F | MAI Capital Management | 90 | 0.00 | 1 | |||||
| 2025-08-14 | 13F | Ubs Asset Management Americas Inc | 5,788 | 4,187.41 | 52 | 5,100.00 | ||||
| 2025-08-14 | 13F | Vident Advisory, LLC | 44,961 | -35.62 | 406 | -36.12 | ||||
| 2025-04-23 | 13F | Chapin Davis, Inc. | 0 | -100.00 | 0 | -100.00 | ||||
| 2025-06-26 | NP | DFIC - Dimensional International Core Equity 2 ETF | 70,999 | 0.00 | 675 | -11.88 | ||||
| 2025-05-05 | 13F | Foundry Partners, LLC | 0 | -100.00 | 0 | -100.00 | ||||
| 2025-08-14 | 13F | Headlands Technologies LLC | 1,448 | 34.57 | 13 | 44.44 | ||||
| 2025-08-27 | NP | ALLIANZ VARIABLE INSURANCE PRODUCTS TRUST - AZL DFA International Core Equity Fund | 1,031 | 0.00 | 9 | 0.00 | ||||
| 2025-09-04 | 13F/A | Advisor Group Holdings, Inc. | 2,864 | 39.98 | 26 | 38.89 | ||||
| 2025-05-14 | 13F | Credit Agricole S A | 456 | 0.00 | 4 | 0.00 | ||||
| 2025-07-17 | 13F | Sound Income Strategies, LLC | 997 | 0.00 | 9 | -11.11 | ||||
| 2025-08-08 | 13F | Itau Unibanco Holding S.A. | 0 | -100.00 | 0 | |||||
| 2025-08-27 | 13F/A | Brinker Capital Investments, LLC | 10,899 | 98 | ||||||
| 2025-05-05 | 13F | IFP Advisors, Inc | 0 | -100.00 | 0 | |||||
| 2025-08-14 | 13F | FourWorld Capital Management LLC | 0 | -100.00 | 0 | -100.00 | ||||
| 2025-08-12 | 13F | Proequities, Inc. | 0 | 0 | ||||||
| 2025-05-14 | 13F | State of Wyoming | 0 | -100.00 | 0 | |||||
| 2025-08-04 | 13F | Mesirow Financial Investment Management, Inc. | 11,336 | -17.08 | 102 | -17.74 | ||||
| 2025-08-14 | 13F | Bank Of America Corp /de/ | 20,767 | -62.03 | 187 | -62.30 | ||||
| 2025-07-28 | 13F | BRYN MAWR TRUST Co | 168 | 0.00 | 2 | 0.00 | ||||
| 2025-08-14 | 13F | Royal Bank Of Canada | 3,945 | 9.58 | 36 | 9.09 | ||||
| 2025-06-26 | NP | DISV - Dimensional International Small Cap Value ETF | 29,234 | 0.00 | 278 | -11.75 | ||||
| 2025-08-01 | 13F | Envestnet Asset Management Inc | 65,624 | -9.22 | 592 | -9.91 | ||||
| 2025-08-13 | 13F | Barclays Plc | 0 | -100.00 | 0 | |||||
| 2025-08-18 | 13F/A | National Bank Of Canada /fi/ | 700 | 0.00 | 6 | 0.00 | ||||
| 2025-08-12 | 13F | Jpmorgan Chase & Co | 30,752 | 3,978.51 | 277 | 4,516.67 | ||||
| 2025-08-14 | 13F | Goldman Sachs Group Inc | 69,911 | -71.81 | 631 | -72.01 | ||||
| 2025-08-14 | 13F | Susquehanna International Group, Llp | Call | 176,900 | 1,596 | |||||
| 2025-05-14 | 13F | Northwestern Mutual Wealth Management Co | 0 | -100.00 | 0 | |||||
| 2025-05-14 | 13F | JustInvest LLC | 0 | -100.00 | 0 | |||||
| 2025-05-15 | 13F | Citadel Advisors Llc | Put | 0 | -100.00 | 0 | -100.00 | |||
| 2025-07-31 | 13F | City State Bank | 100 | 0.00 | 1 | |||||
| 2025-08-13 | 13F | EverSource Wealth Advisors, LLC | 1,889 | -40.11 | 17 | -39.29 | ||||
| 2025-07-24 | 13F | Ronald Blue Trust, Inc. | 5,059 | -21.75 | 46 | -22.41 | ||||
| 2025-08-08 | 13F | Larson Financial Group LLC | 260 | 2 | ||||||
| 2025-08-12 | 13F | Steward Partners Investment Advisory, Llc | 5,873 | 8.86 | 53 | 8.33 | ||||
| 2025-07-24 | 13F | Ramirez Asset Management, Inc. | 0 | -100.00 | 0 | |||||
| 2025-08-14 | 13F | Citadel Advisors Llc | 37,577 | 339 | ||||||
| 2025-08-14 | 13F | Uniplan Investment Counsel, Inc. | 372,643 | -10.00 | 3,361 | -10.59 | ||||
| 2025-04-08 | 13F | Pacifica Partners Inc. | 0 | -100.00 | 0 | |||||
| 2025-07-15 | 13F | Fifth Third Bancorp | 9,760 | 0.05 | 88 | 0.00 | ||||
| 2025-08-01 | 13F | Rossby Financial, LCC | 290 | 0.00 | 3 | 0.00 | ||||
| 2025-08-14 | 13F | UBS Group AG | 247,715 | -11.16 | 2,234 | -11.73 | ||||
| 2025-05-15 | 13F | Millennium Management Llc | 0 | -100.00 | 0 | -100.00 | ||||
| 2025-06-30 | 13F/A | Deutsche Bank Ag\ | 0 | -100.00 | 0 | |||||
| 2025-08-14 | 13F | Citadel Advisors Llc | Call | 14,000 | 126 | |||||
| 2025-08-08 | 13F | SBI Securities Co., Ltd. | 7,158 | 3.23 | 65 | 3.23 | ||||
| 2025-08-11 | 13F | Citigroup Inc | 2,395 | 22 | ||||||
| 2025-08-14 | 13F | Css Llc/il | Call | 0 | -100.00 | 0 | ||||
| 2025-08-14 | 13F | Mariner, LLC | 113,496 | 138.86 | 1,024 | 137.35 | ||||
| 2025-08-12 | 13F | Legal & General Group Plc | 6,529 | 221.31 | 59 | 227.78 | ||||
| 2025-08-15 | 13F | Tower Research Capital LLC (TRC) | 426 | 14,100.00 | 4 | |||||
| 2025-08-14 | 13F | Raymond James Financial Inc | 2,953 | 27 | ||||||
| 2025-08-15 | 13F | Morgan Stanley | 11,902 | -82.25 | 107 | -82.40 | ||||
| 2025-08-14 | 13F | Boston Private Wealth Llc | 0 | -100.00 | 0 | |||||
| 2025-08-04 | 13F | Wolverine Asset Management Llc | 900 | 8 | ||||||
| 2025-07-15 | 13F | Td Private Client Wealth Llc | 250 | 0.00 | 2 | 0.00 | ||||
| 2025-08-07 | 13F | Mitsubishi UFJ Kokusai Asset Management Co., Ltd. | 0 | -100.00 | 0 | |||||
| 2025-08-11 | 13F | Hexagon Capital Partners LLC | 0 | -100.00 | 0 | |||||
| 2025-08-11 | 13F | TD Waterhouse Canada Inc. | 152 | 0.00 | 1 | 0.00 | ||||
| 2025-08-13 | 13F | Jones Financial Companies Lllp | 55 | 0.00 | 1 | |||||
| 2025-07-22 | 13F | Highland Capital Management, Llc | 42,100 | -2.77 | 380 | -3.56 | ||||
| 2025-08-12 | 13F | Coldstream Capital Management Inc | 0 | -100.00 | 0 | |||||
| 2025-08-12 | 13F | BlackRock, Inc. | 2,846 | 314.26 | 26 | 316.67 | ||||
| 2025-07-18 | 13F/A | MJT & Associates Financial Advisory Group, Inc. | 100 | 0.00 | 1 | |||||
| 2025-05-14 | 13F | Orion Portfolio Solutions, LLC | 13,781 | 0.00 | 137 | 0.00 | ||||
| 2025-05-13 | 13F | Caitong International Asset Management Co., Ltd | 0 | -100.00 | 0 |