Basic Stats
Introduction
This short interest tracker provides a variety of short interest related data, sourced from a variety of partners. The data is organized by frequency of updates, with intraday data at the top (short shares availability, short borrow fee rate), daily data (short volume, fails-to-deliver) in the middle, and the slowest updated data (short interest) at the bottom. Note that short interest is published twice-monthly, on a schedule set by FINRA.
Short Squeeze Score
The Short Squeeze Score is the result of a sophisticated, multi-factor quantitative model that identifies companies that have the highest risk of experiencing a short squeeze. The scoring model uses a combination of short interest, float, short borrow fee rates, and other metrics. The number ranges from 0 to 100, with higher numbers indicating a higher risk of a short squeeze relative to its peers, and 50 being the average.
Update Frequency: Intraday
See our Short Squeeze Leaderboards for US, Canada, Australia and Hong Kong
Short Borrow Fee Rates
NIMU / Non-Invasive Monitoring Systems, Inc. short borrow fee rates are shown in the following table. This table shows the interest rate that must be paid by a short seller of US:NIMU to the lender of that security. This fee is shown as an annual percentage rate (APR). Lenders are funds or individuals that own the security that have indicated to the broker that they are willing to lend it out. Dividends paid to a shorted security go to the owner/lender of the security, not to the borrower.
- Start, Min, Max, Latest (Borrow Rates)
- These represent borrow rates for the day, with the rate at the start of the day, the end of the day (or the latest for the current day), the minimum rate in the day, and the maximum rate for the day. Unlike the Options Implied Borrow Rates, our source for this data always presents them as positive numbers, and they represent an annualized interest rate that is paid by the borrower for the shares.
Update Frequency: Intraday every 30 minutes.
Last update
: 2 minutes ago
| Date | Start | Min | Max | Latest |
|---|---|---|---|---|
| 2025-09-05 | 0.25 | 0.25 | 0.25 | 0.25 |
| 2025-09-04 | 0.25 | 0.25 | 0.25 | 0.25 |
| 2025-09-03 | 0.25 | 0.25 | 0.25 | 0.25 |
| 2025-09-02 | 0.25 | 0.25 | 0.25 | 0.25 |
| 2025-09-01 | 0.25 | 0.25 | 0.25 | 0.25 |
| 2025-08-29 | 0.25 | 0.25 | 0.25 | 0.25 |
| 2025-08-28 | 0.25 | 0.25 | 0.25 | 0.25 |
| 2025-08-27 | 0.25 | 0.25 | 0.25 | 0.25 |
| 2025-08-26 | 0.25 | 0.25 | 0.25 | 0.25 |
| 2025-08-25 | 0.25 | 0.25 | 0.25 | 0.25 |
Fails-To-Deliver
The values of total fails-to-deliver shares represent the aggregate net balance of shares that failed to be delivered as of a particular settlement date. Fails to deliver on a given day are a cumulative number of all fails outstanding until that day, plus new fails that occur that day, less fails that settle that day. The figure is not a daily amount of fails, but a combined figure that includes both new fails on the reporting day as well as existing fails. In other words, these numbers reflect aggregate fails as of a specific point in time, and may have little or no relationship to yesterday’s aggregate fails. Thus, it is important to note that the age of fails cannot be determined by looking at these numbers.If all shares were delivered on a particular day, then there will be no entry in the table.
Update Frequency: SEC publishes daily data in batches that are delivered twice monthly and lagged about two weeks. So, for example, daily data for the month of March would arrive around mid April.
This data is NOT split-adjusted - it reflects the raw data provided by the SEC.
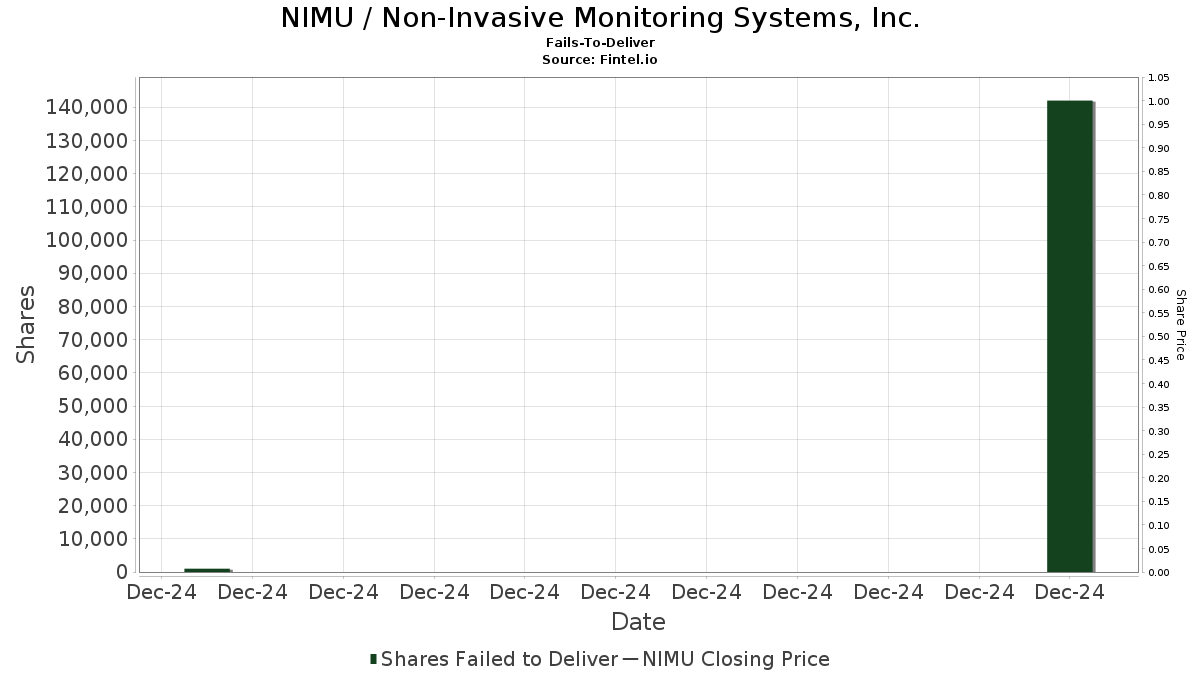
| Date | Price | Quantity | Value |
|---|---|---|---|
| 2024-12-30 | 142,000 | ||
| 2024-12-11 | 1,000 |
Short Interest
Short Interest is the total number of open short positions of a security. A Short Squeeze is when a company with a high degree of short interest increases in price, which forces short sellers to "cover" their short interest by purchasing actual shares, which in turn drives the price up even further.
Update Frequency: Twice Monthly
| Date | Short Interest | Days to Cover |
|---|---|---|
| 2025-07-15 | 2 | 1.00 |
| 2025-06-30 | 2 | 1.00 |