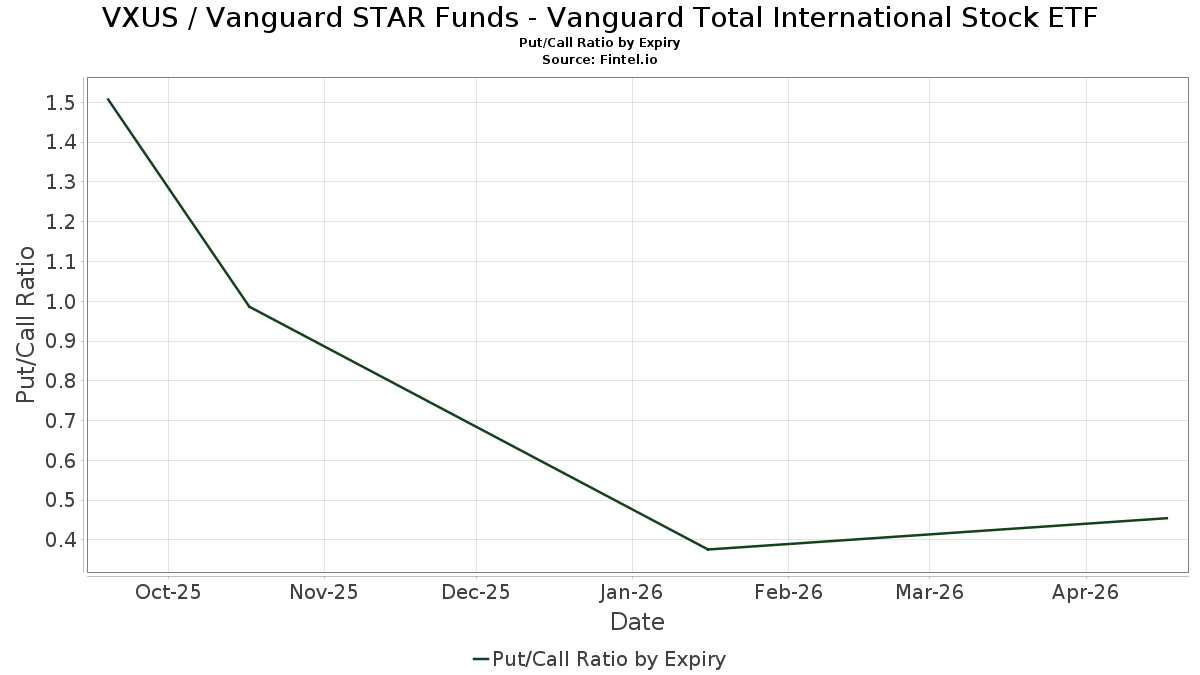
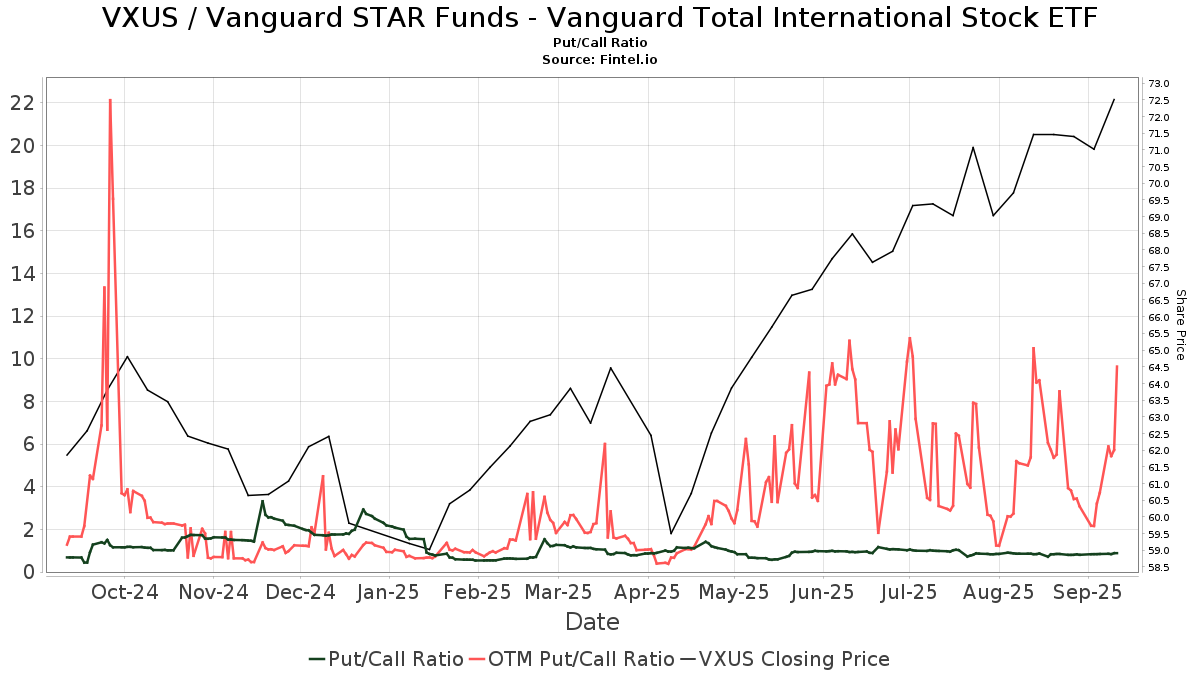
Put/Call Ratios - Forward Looking and Historical
The OI Put/Call Ratio for VXUS / Vanguard STAR Funds - Vanguard Total International Stock ETF is 0.84. The Put/Call Ratio shows the total number of disclosed open put option positions divided by the number of open call options. Since puts are generally a bearish bet and calls are a bullish bet, put/call ratios greater than 1 indicate a bearish sentiment, and ratios less than one indicate a bullish sentiment.
Update Frequency: Daily
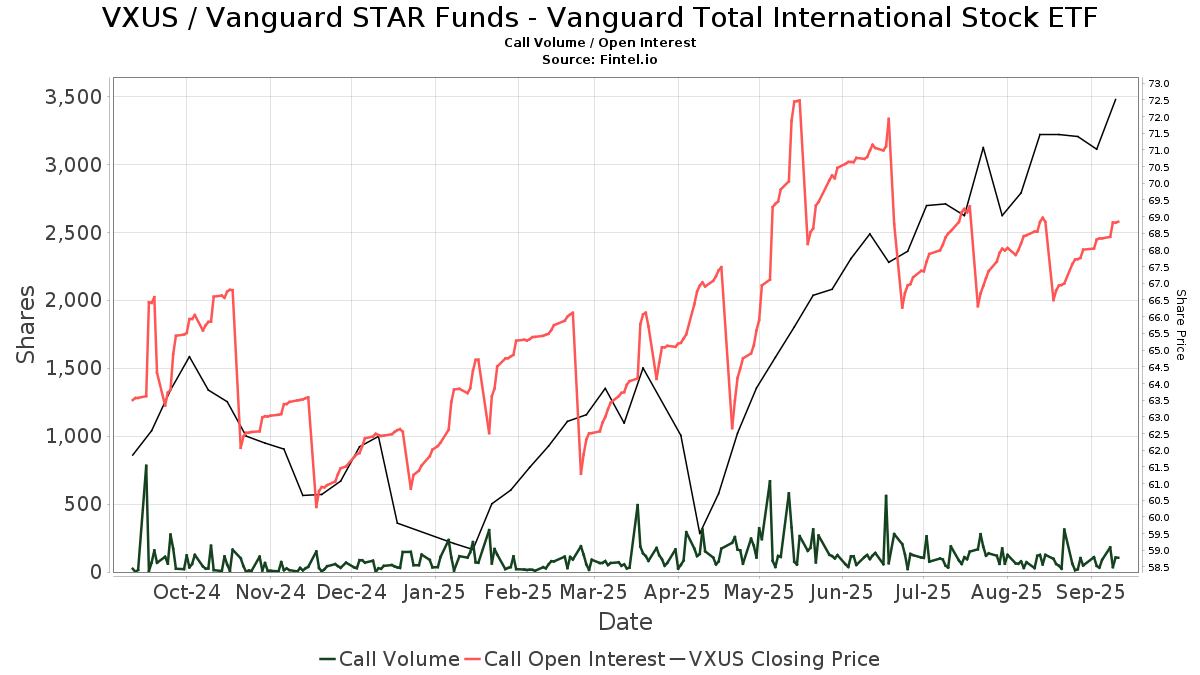
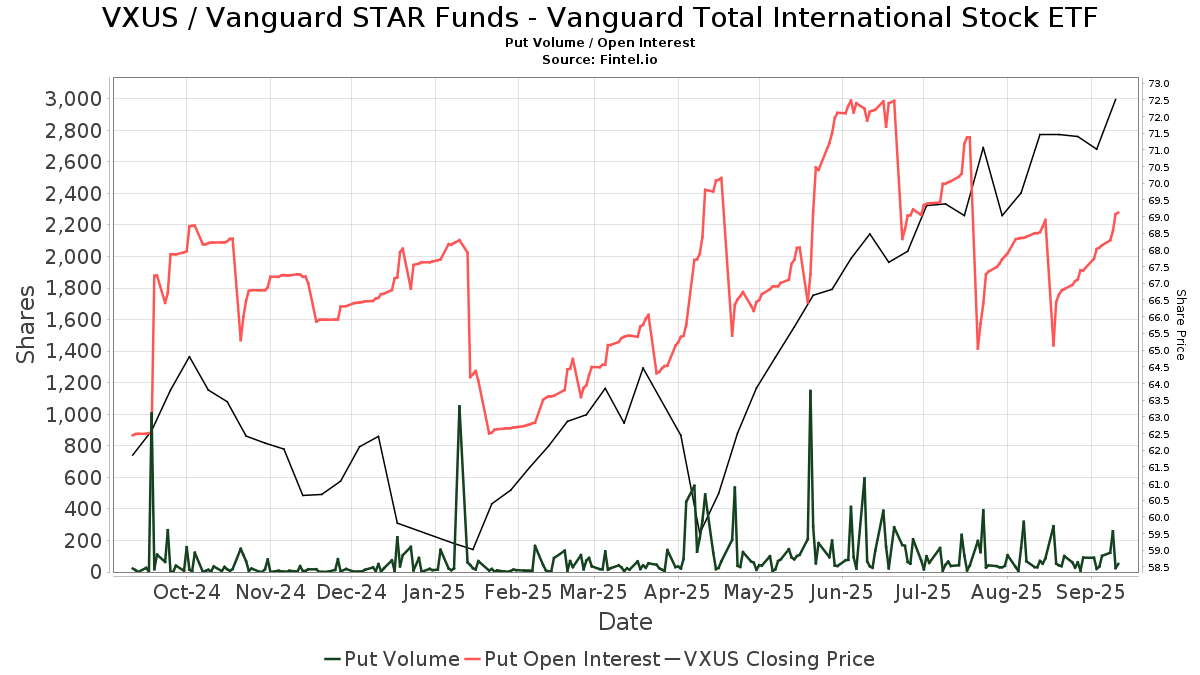
Unusual Options Activity - Trade Volume
The Put/Call Ratio shows the total number of disclosed open put option positions divided by the number of open call option options. Since puts are generally a bearish bet and calls are a bullish bet, put/call ratios greater than 1 indicate a bearish sentiment, and ratios less than one indicate a bullish sentiment.
Unusual options activity (UOA) is generally considered a strong signal for a directional price movement. One metric of unusual options activity is the total volume of put or call options divided by the open interest in the same option type. If the total volume of call or put options exceeds the current open interest, then that is considered unusual and indicates a strong directional signal. In the table below, any date on which the volume of an option exceeds the current open interest is highlighted in green (for call options) or red (for put options).
For example, if, on any trading day, the call volume exceeds the current call open interest, then the Call Volume/Call OI ratio will be greater than one and that cell in the able will be highlighted in green. This would indicate a significant purchase of call options, which is a bullish signal. Likewise, if the opposite is true - the put volume exceeds the put open interest, then the table cell would be highlighted in red and represent a strong bearish signal.
Update Frequency: Daily
Option Greeks - Delta, Gamma, Theta
Update Frequency: Daily
Option Trading Volume - Total Market
Update Frequency: Daily
Option Trading Volume - Exchange
Update Frequency: Daily
| Date | CBOE | C2 | EDGX | BZX | PHLX | NASDAQ | BX | GEMX | ISE | MRX | AMEX | ARCA | MIAX | PEARL | EMLD | BOX | Total |
|---|---|---|---|---|---|---|---|---|---|---|---|---|---|---|---|---|---|
| 2025-09-04 | 5 | 1 | 0 | 13 | 0 | 0 | 0 | 0 | 18 | 2 | 0 | 5 | 5 | 0 | 0 | 3 | 67 |
| 2025-09-03 | 7 | 1 | 1 | 0 | 0 | 0 | 0 | 0 | 7 | 15 | 0 | 1 | 21 | 0 | 4 | 1 | 65 |
| 2025-09-02 | 36 | 2 | 8 | 27 | 0 | 0 | 0 | 1 | 34 | 15 | 0 | 3 | 26 | 0 | 0 | 3 | 199 |
| 2025-08-29 | 58 | 0 | 2 | 1 | 0 | 0 | 0 | 0 | 30 | 2 | 0 | 0 | 13 | 3 | 1 | 7 | 139 |
| 2025-08-28 | 6 | 0 | 40 | 2 | 0 | 0 | 0 | 0 | 5 | 2 | 0 | 0 | 18 | 0 | 16 | 16 | 111 |
| 2025-08-27 | 9 | 0 | 2 | 10 | 0 | 0 | 0 | 0 | 30 | 1 | 0 | 0 | 7 | 1 | 0 | 0 | 81 |
| 2025-08-26 | 8 | 0 | 0 | 1 | 0 | 0 | 0 | 0 | 17 | 1 | 0 | 0 | 13 | 0 | 1 | 0 | 41 |
| 2025-08-25 | 32 | 1 | 0 | 6 | 0 | 0 | 0 | 5 | 43 | 2 | 0 | 5 | 14 | 0 | 0 | 1 | 121 |
| 2025-08-22 | 198 | 4 | 21 | 1 | 0 | 0 | 0 | 0 | 123 | 4 | 0 | 3 | 16 | 0 | 0 | 32 | 413 |
| 2025-08-21 | 44 | 0 | 0 | 0 | 0 | 0 | 0 | 0 | 6 | 0 | 0 | 1 | 10 | 0 | 0 | 0 | 61 |
| 2025-08-20 | 18 | 0 | 1 | 10 | 0 | 0 | 0 | 1 | 21 | 1 | 0 | 1 | 5 | 0 | 17 | 1 | 88 |
| 2025-08-19 | 27 | 2 | 3 | 0 | 0 | 0 | 0 | 0 | 45 | 0 | 0 | 1 | 23 | 2 | 0 | 0 | 112 |
| 2025-08-18 | 56 | 7 | 17 | 4 | 0 | 0 | 0 | 1 | 107 | 7 | 0 | 2 | 29 | 2 | 11 | 87 | 387 |
| 2025-08-15 | 31 | 1 | 5 | 4 | 0 | 0 | 0 | 0 | 35 | 0 | 0 | 2 | 111 | 0 | 4 | 10 | 212 |
| 2025-08-14 | 34 | 0 | 1 | 3 | 0 | 0 | 0 | 2 | 34 | 11 | 0 | 0 | 20 | 0 | 0 | 4 | 109 |
| 2025-08-13 | 39 | 0 | 3 | 4 | 0 | 0 | 0 | 2 | 87 | 10 | 0 | 0 | 40 | 0 | 0 | 5 | 196 |
| 2025-08-12 | 38 | 0 | 10 | 68 | 0 | 0 | 0 | 0 | 21 | 2 | 0 | 0 | 5 | 0 | 0 | 3 | 149 |
| 2025-08-11 | 19 | 0 | 0 | 2 | 0 | 0 | 0 | 0 | 21 | 2 | 0 | 0 | 13 | 0 | 0 | 1 | 60 |
| 2025-08-08 | 3 | 1 | 2 | 7 | 0 | 0 | 0 | 0 | 81 | 0 | 0 | 0 | 5 | 0 | 0 | 12 | 140 |
| 2025-08-07 | 17 | 0 | 5 | 0 | 0 | 0 | 0 | 1 | 309 | 4 | 0 | 0 | 1 | 0 | 3 | 4 | 348 |


