Basic Stats
| Institutional Shares (Long) | 7,970,214 - 1.67% (ex 13D/G) - change of 1.60MM shares 25.13% MRQ |
| Institutional Value (Long) | $ 8,856 USD ($1000) |
Institutional Ownership and Shareholders
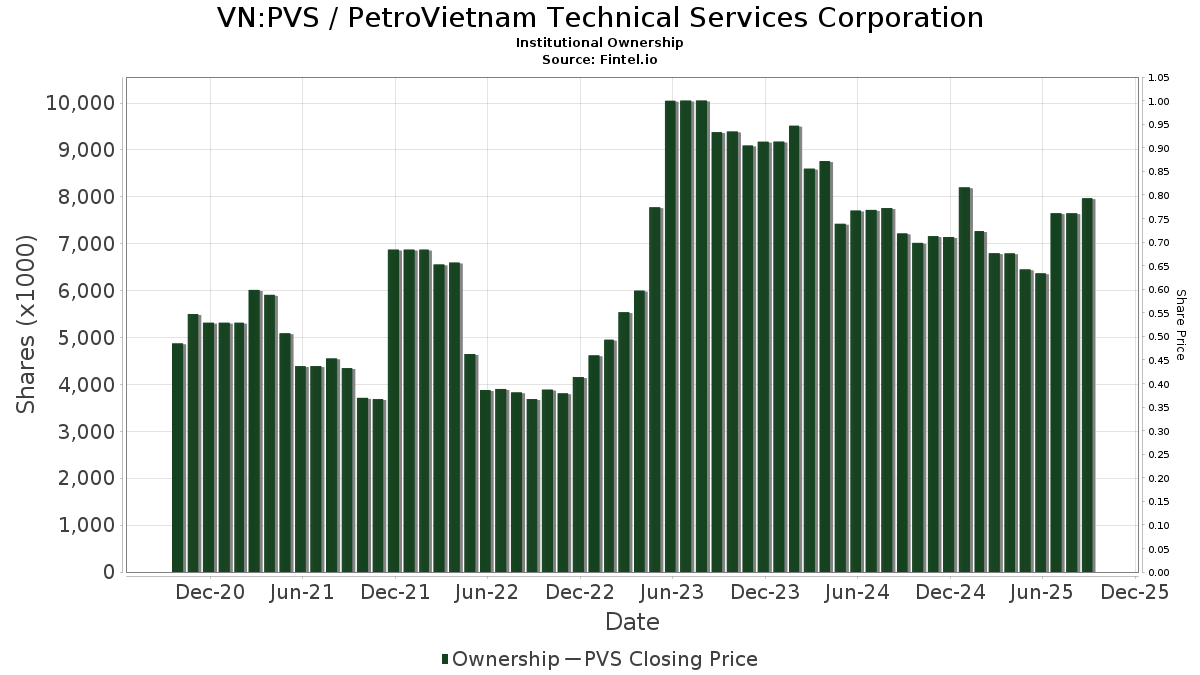
PetroVietnam Technical Services Corporation (VN:PVS) has 7 institutional owners and shareholders that have filed 13D/G or 13F forms with the Securities Exchange Commission (SEC). These institutions hold a total of 7,970,214 shares. Largest shareholders include VNM - VanEck Vectors Vietnam ETF, Global Macro Capital Opportunities Portfolio - Global Macro Capital Opportunities Portfolio, SFVLX - Seafarer Overseas Value Fund Investor Class, Stanley-Laman Group, Ltd., EITEX - Parametric Tax-Managed Emerging Markets Fund Institutional Class, VNAM - Global X MSCI Vietnam ETF, and EAEMX - Parametric Emerging Markets Fund Investor Class .
PetroVietnam Technical Services Corporation (HNX:PVS) institutional ownership structure shows current positions in the company by institutions and funds, as well as latest changes in position size. Major shareholders can include individual investors, mutual funds, hedge funds, or institutions. The Schedule 13D indicates that the investor holds (or held) more than 5% of the company and intends (or intended) to actively pursue a change in business strategy. Schedule 13G indicates a passive investment of over 5%.
Fund Sentiment Score
The Fund Sentiment Score (fka Ownership Accumulation Score) finds the stocks that are being most bought by funds. It is the result of a sophisticated, multi-factor quantitative model that identifies companies with the highest levels of institutional accumulation. The scoring model uses a combination of the total increase in disclosed owners, the changes in portfolio allocations in those owners and other metrics. The number ranges from 0 to 100, with higher numbers indicating a higher level of accumulation to its peers, and 50 being the average.
Update Frequency: Daily
See Ownership Explorer, which provides a list of highest-ranking companies.
13F and NPORT Filings
Detail on 13F filings are free. Detail on NP filings require a premium membership. Green rows indicate new positions. Red rows indicate closed positions. Click the link icon to see the full transaction history.
Upgrade
to unlock premium data and export to Excel ![]() .
.
| File Date | Source | Investor | Type | Avg Price (Est) |
Shares | Δ Shares (%) |
Reported Value ($1000) |
Δ Value (%) |
Port Alloc (%) |
|
|---|---|---|---|---|---|---|---|---|---|---|
| 2025-08-21 | NP | VNM - VanEck Vectors Vietnam ETF | 3,143,500 | 11.33 | 3,959 | 16.30 | ||||
| 2025-06-23 | NP | Global Macro Capital Opportunities Portfolio - Global Macro Capital Opportunities Portfolio | 2,500,762 | 105.52 | 2,460 | 54.14 | ||||
| 2025-07-29 | 13F | Stanley-Laman Group, Ltd. | 450,000 | 0.00 | 567 | 4.43 | ||||
| 2025-06-30 | NP | VNAM - Global X MSCI Vietnam ETF This fund is a listed as child fund of Mirae Asset Global Investments Co., Ltd. and if that institution has disclosed ownership in this security, then these positions will not be double counted when calculating total shares and total value | 82,600 | -3.50 | 81 | -27.68 | ||||
| 2025-06-27 | NP | EAEMX - Parametric Emerging Markets Fund Investor Class | 27,400 | 0.00 | 27 | -25.71 | ||||
| 2025-06-25 | NP | SFVLX - Seafarer Overseas Value Fund Investor Class | 1,673,080 | 0.00 | 1,647 | -25.17 | ||||
| 2025-08-25 | NP | EITEX - Parametric Tax-Managed Emerging Markets Fund Institutional Class | 92,872 | 0.00 | 117 | 5.41 |