Basic Stats
| Institutional Owners | 93 total, 93 long only, 0 short only, 0 long/short - change of 3.33% MRQ |
| Average Portfolio Allocation | 0.2603 % - change of -10.98% MRQ |
| Institutional Shares (Long) | 791,368 (ex 13D/G) - change of 0.02MM shares 2.69% MRQ |
| Institutional Value (Long) | $ 84,391 USD ($1000) |
Institutional Ownership and Shareholders
SPDR Series Trust - SPDR SSGA US Small Cap Low Volatility Index ETF (US:SMLV) has 93 institutional owners and shareholders that have filed 13D/G or 13F forms with the Securities Exchange Commission (SEC). These institutions hold a total of 791,368 shares. Largest shareholders include Congress Wealth Management LLC / DE /, LPL Financial LLC, DORVAL Corp, Cambridge Investment Research Advisors, Inc., Ieq Capital, Llc, Aqr Capital Management Llc, Ameriprise Financial Inc, Commonwealth Equity Services, Llc, McNaughton Wealth Management, LLC, and Susquehanna International Group, Llp .
SPDR Series Trust - SPDR SSGA US Small Cap Low Volatility Index ETF (ARCA:SMLV) institutional ownership structure shows current positions in the company by institutions and funds, as well as latest changes in position size. Major shareholders can include individual investors, mutual funds, hedge funds, or institutions. The Schedule 13D indicates that the investor holds (or held) more than 5% of the company and intends (or intended) to actively pursue a change in business strategy. Schedule 13G indicates a passive investment of over 5%.
The share price as of September 9, 2025 is 131.76 / share. Previously, on September 10, 2024, the share price was 121.31 / share. This represents an increase of 8.61% over that period.

Fund Sentiment Score
The Fund Sentiment Score (fka Ownership Accumulation Score) finds the stocks that are being most bought by funds. It is the result of a sophisticated, multi-factor quantitative model that identifies companies with the highest levels of institutional accumulation. The scoring model uses a combination of the total increase in disclosed owners, the changes in portfolio allocations in those owners and other metrics. The number ranges from 0 to 100, with higher numbers indicating a higher level of accumulation to its peers, and 50 being the average.
Update Frequency: Daily
See Ownership Explorer, which provides a list of highest-ranking companies.
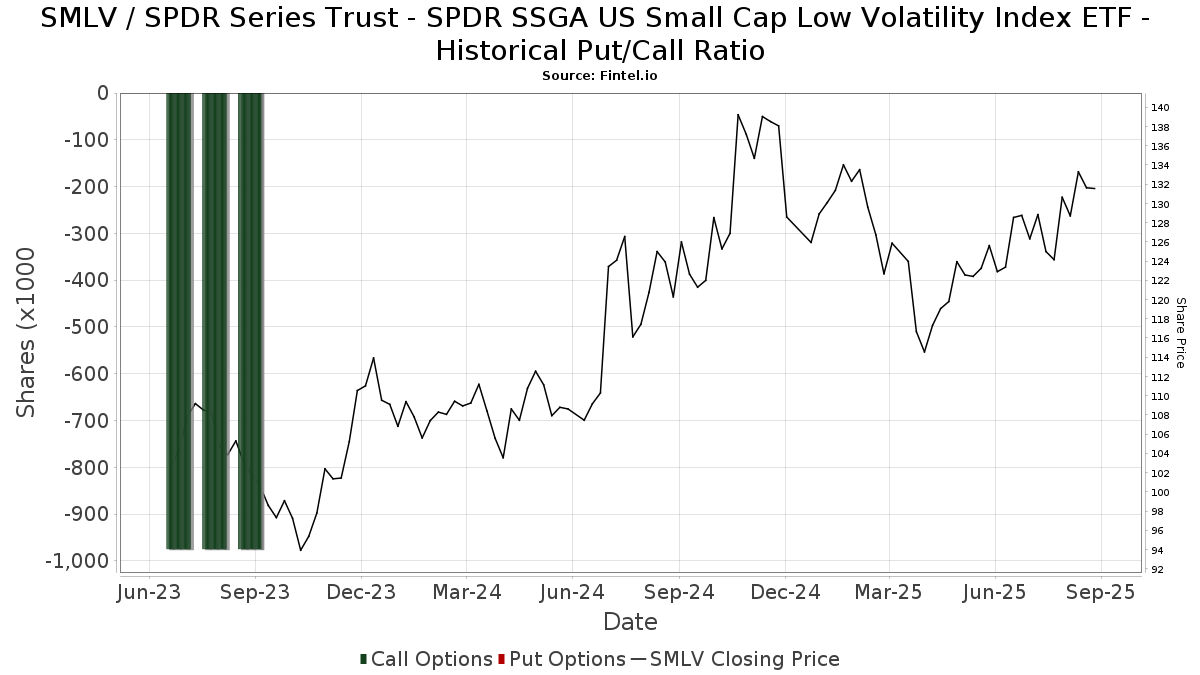
Institutional Put/Call Ratio
In addition to reporting standard equity and debt issues, institutions with more than 100MM assets under management must also disclose their put and call option holdings. Since put options generally indicate negative sentiment, and call options indicate positive sentiment, we can get a sense of the overall institutional sentiment by plotting the ratio of puts to calls. The chart to the right plots the historical put/call ratio for this instrument.
Using Put/Call Ratio as an indicator of investor sentiment overcomes one of the key deficiencies of using total institutional ownership, which is that a significant amount of assets under management are invested passively to track indices. Passively-managed funds do not typically buy options, so the put/call ratio indicator more closely tracks the sentiment of actively-managed funds.
13F and NPORT Filings
Detail on 13F filings are free. Detail on NP filings require a premium membership. Green rows indicate new positions. Red rows indicate closed positions. Click the link icon to see the full transaction history.
Upgrade
to unlock premium data and export to Excel ![]() .
.
| File Date | Source | Investor | Type | Avg Price (Est) |
Shares | Δ Shares (%) |
Reported Value ($1000) |
Δ Value (%) |
Port Alloc (%) |
|
|---|---|---|---|---|---|---|---|---|---|---|
| 2025-07-31 | 13F | Sage Mountain Advisors LLC | 452 | 0.00 | 57 | 1.82 | ||||
| 2025-08-15 | 13F | Equitable Holdings, Inc. | 0 | -100.00 | 0 | |||||
| 2025-08-06 | 13F | Commonwealth Equity Services, Llc | 24,821 | -21.58 | 3 | 0.00 | ||||
| 2025-05-12 | 13F | Jpmorgan Chase & Co | 0 | -100.00 | 0 | -100.00 | ||||
| 2025-08-14 | 13F | Bank Of America Corp /de/ | 13,562 | 10.05 | 1,697 | 12.02 | ||||
| 2025-07-10 | 13F | High Net Worth Advisory Group LLC | 1,870 | -1.84 | 234 | -0.43 | ||||
| 2025-08-07 | 13F | Winthrop Capital Management, LLC | 142 | -4.70 | 0 | |||||
| 2025-04-21 | 13F | PSI Advisors, LLC | 0 | -100.00 | 0 | |||||
| 2025-08-12 | 13F | Proequities, Inc. | 0 | 0 | ||||||
| 2025-07-29 | 13F | Portland Financial Advisors Inc | 4,215 | 0.00 | 527 | 1.93 | ||||
| 2025-08-01 | 13F | Envestnet Asset Management Inc | 17,287 | -6.19 | 2,163 | -4.51 | ||||
| 2025-08-11 | 13F | United Capital Financial Advisers, Llc | 5,786 | -1.93 | 724 | -0.14 | ||||
| 2025-05-08 | 13F | Plante Moran Financial Advisors, LLC | 0 | -100.00 | 0 | |||||
| 2025-07-30 | 13F | Insight Advisors, LLC/ PA | 8,480 | -3.89 | 1,061 | -2.21 | ||||
| 2025-08-14 | 13F | Ieq Capital, Llc | 56,025 | 0.00 | 7,009 | 1.82 | ||||
| 2025-08-14 | 13F | Sunbelt Securities, Inc. | 10 | 0.00 | 1 | 0.00 | ||||
| 2025-08-14 | 13F | UBS Group AG | 10,285 | 1.50 | 1,287 | 3.29 | ||||
| 2025-07-29 | 13F | Stratos Wealth Partners, LTD. | 4,056 | 2.81 | 508 | 4.75 | ||||
| 2025-07-25 | 13F | Cwm, Llc | 0 | -100.00 | 0 | |||||
| 2025-08-14 | 13F | Ausdal Financial Partners, Inc. | 3,985 | 0.66 | 499 | 2.47 | ||||
| 2025-07-31 | 13F | Cambridge Investment Research Advisors, Inc. | 64,889 | 4.75 | 8 | 14.29 | ||||
| 2025-08-12 | 13F | Jaffetilchin Investment Partners, LLC | 2,979 | 0.27 | 373 | 1.92 | ||||
| 2025-07-14 | 13F | Painted Porch Advisors LLC | 115 | 0.88 | 14 | 0.00 | ||||
| 2025-08-13 | 13F | Summit Wealth Group Llc / Co | 4,493 | 562 | ||||||
| 2025-06-24 | NP | TNQIX - 1290 Retirement 2055 Fund Class I | 744 | 0.00 | 89 | -9.28 | ||||
| 2025-08-14 | 13F | Ameriprise Financial Inc | 36,642 | 1.82 | 4,584 | 3.69 | ||||
| 2025-08-08 | 13F | Avantax Advisory Services, Inc. | 11,001 | -2.14 | 1,376 | -0.36 | ||||
| 2025-08-18 | 13F | N.E.W. Advisory Services LLC | 113 | 0.89 | 14 | 7.69 | ||||
| 2025-08-04 | 13F | Spire Wealth Management | 37 | -77.16 | 5 | -78.95 | ||||
| 2025-07-09 | 13F | Fragasso Group Inc. | 2,909 | 364 | ||||||
| 2025-08-06 | 13F | AE Wealth Management LLC | 69 | 0.00 | 9 | 0.00 | ||||
| 2025-08-11 | 13F | Citigroup Inc | 6,100 | 0.15 | 763 | 2.01 | ||||
| 2025-07-16 | 13F | Swisher Financial Concepts, Inc. | 2,541 | 7.90 | 318 | 9.69 | ||||
| 2025-07-30 | 13F | Pacific Sun Financial Corp | 6,194 | -6.77 | 775 | -5.15 | ||||
| 2025-08-14 | 13F | Goldman Sachs Group Inc | 7,702 | 0.00 | 964 | 1.80 | ||||
| 2025-07-24 | 13F | Us Bancorp \de\ | 8 | 0.00 | 1 | |||||
| 2025-06-24 | NP | TNWIX - 1290 Retirement 2050 Fund Class I | 726 | 0.00 | 86 | -9.47 | ||||
| 2025-08-15 | 13F | Morgan Stanley | 10,664 | 6.45 | 1,334 | 8.46 | ||||
| 2025-08-12 | 13F | Steward Partners Investment Advisory, Llc | 720 | 0.00 | 90 | 2.27 | ||||
| 2025-08-11 | 13F | Western Wealth Management, LLC | 2,015 | 0.05 | 252 | 2.02 | ||||
| 2025-08-13 | 13F | Jones Financial Companies Lllp | 5,513 | 86.00 | 690 | 89.29 | ||||
| 2025-08-12 | 13F | CIBC Private Wealth Group, LLC | 1,400 | 0.00 | 175 | 13.64 | ||||
| 2025-09-04 | 13F/A | Advisor Group Holdings, Inc. | 5,118 | 16.93 | 641 | 19.14 | ||||
| 2025-07-22 | 13F | Valley National Advisers Inc | 191 | 0.00 | 0 | |||||
| 2025-06-24 | NP | TNIIX - 1290 Retirement 2020 Fund Class I | 85 | 0.00 | 10 | -9.09 | ||||
| 2025-05-15 | 13F | Capstone Investment Advisors, Llc | 0 | -100.00 | 0 | |||||
| 2025-07-24 | 13F | IFP Advisors, Inc | 1,052 | 0.00 | 132 | 1.55 | ||||
| 2025-07-17 | 13F | Johnson & White Wealth Management, LLC | 13,361 | 3.29 | 2 | 0.00 | ||||
| 2025-08-14 | 13F | IHT Wealth Management, LLC | 1,991 | 0.61 | 249 | 2.47 | ||||
| 2025-07-10 | 13F | HF Advisory Group, LLC | 7,289 | -1.21 | 912 | 0.55 | ||||
| 2025-07-28 | 13F | DORVAL Corp | 74,202 | 4.19 | 9,284 | -0.42 | ||||
| 2025-06-24 | NP | TNLIX - 1290 Retirement 2035 Fund Class I | 270 | 0.00 | 32 | -8.57 | ||||
| 2025-08-04 | 13F | Assetmark, Inc | 165 | 21 | ||||||
| 2025-08-14 | 13F | Warren Averett Asset Management, LLC | 2,545 | -9.53 | 318 | -7.83 | ||||
| 2025-07-29 | 13F | Signature Estate & Investment Advisors Llc | 1,602 | 200 | ||||||
| 2025-08-06 | 13F | Savant Capital, LLC | 6,255 | -6.88 | 783 | -5.21 | ||||
| 2025-07-23 | 13F | Dohj, Llc | 2,555 | -0.04 | 300 | -4.78 | ||||
| 2025-08-12 | 13F | O'shaughnessy Asset Management, Llc | 480 | 0.00 | 60 | 3.45 | ||||
| 2025-07-09 | 13F | Reyes Financial Architecture, Inc. | 100 | 0.00 | 13 | 0.00 | ||||
| 2025-07-17 | 13F | Vermillion Wealth Management, Inc. | 112 | 0.90 | 14 | 0.00 | ||||
| 2025-07-08 | 13F | Nbc Securities, Inc. | 110 | 0.00 | 0 | |||||
| 2025-08-11 | 13F | Principal Securities, Inc. | 629 | 1.94 | 79 | 0.00 | ||||
| 2025-08-13 | 13F | Capital Analysts, Inc. | 2,974 | -41.88 | 0 | |||||
| 2025-07-28 | 13F | Harbour Investments, Inc. | 66 | 0.00 | 8 | 0.00 | ||||
| 2025-08-14 | 13F | Aqr Capital Management Llc | 46,571 | 0.00 | 5,827 | 1.82 | ||||
| 2025-08-12 | 13F | Cowa, Llc | 7,387 | 4.51 | 924 | 6.45 | ||||
| 2025-07-22 | 13F | McNaughton Wealth Management, LLC | 23,417 | 1.96 | 2,930 | 3.79 | ||||
| 2025-08-08 | 13F | Cornerstone Advisors Asset Management, Inc | 0 | -100.00 | 0 | |||||
| 2025-07-14 | 13F | AdvisorNet Financial, Inc | 383 | 0.79 | 48 | 2.17 | ||||
| 2025-08-13 | 13F | Navis Wealth Advisors, LLC | 6,050 | 0.67 | 757 | 2.44 | ||||
| 2025-08-13 | 13F | Beacon Pointe Advisors, LLC | 4,391 | -12.95 | 549 | -11.31 | ||||
| 2025-08-13 | 13F | IAG Wealth Partners, LLC | 13,280 | -5.05 | 1,662 | -3.32 | ||||
| 2025-08-13 | 13F | Continuum Advisory, LLC | 2,272 | 0.53 | 284 | 2.53 | ||||
| 2025-08-11 | 13F | HighTower Advisors, LLC | 3,846 | 0.65 | 481 | 2.56 | ||||
| 2025-08-11 | 13F | Tidemark, LLC | 162 | 0.00 | 20 | 5.26 | ||||
| 2025-06-24 | NP | TNKIX - 1290 Retirement 2030 Fund Class I | 227 | 0.00 | 27 | -6.90 | ||||
| 2025-08-14 | 13F | GWM Advisors LLC | 5,762 | 16.08 | 721 | 18.23 | ||||
| 2025-07-15 | 13F | McAdam, LLC | 2,988 | 5.55 | 374 | 7.49 | ||||
| 2025-06-24 | NP | TNJIX - 1290 Retirement 2025 Fund Class I | 19 | -5.00 | 2 | 0.00 | ||||
| 2025-08-11 | 13F | Private Advisor Group, LLC | 1,924 | -48.36 | 241 | -47.48 | ||||
| 2025-08-08 | 13F | Capital Investment Advisory Services, LLC | 67 | 0.00 | 8 | 0.00 | ||||
| 2025-06-24 | NP | TNOIX - 1290 Retirement 2045 Fund Class I | 654 | 0.00 | 78 | -9.41 | ||||
| 2025-08-14 | 13F | Two Sigma Investments, Lp | 7,400 | -28.85 | 926 | -27.56 | ||||
| 2025-08-14 | 13F | Wells Fargo & Company/mn | 89 | -31.01 | 11 | -26.67 | ||||
| 2025-08-08 | 13F | Cetera Investment Advisers | 8,225 | 44.81 | 1,029 | 47.49 | ||||
| 2025-08-12 | 13F | LPL Financial LLC | 75,092 | 25.27 | 9,395 | 27.55 | ||||
| 2025-07-30 | 13F | Strategic Blueprint, LLC | 3,110 | 0.00 | 389 | 1.83 | ||||
| 2025-08-05 | 13F | Roffman Miller Associates Inc /pa/ | 2,932 | 0.55 | 367 | 2.23 | ||||
| 2025-08-14 | 13F | Royal Bank Of Canada | 1,346 | 62.17 | 169 | 65.69 | ||||
| 2025-08-14 | 13F | Susquehanna International Group, Llp | 19,694 | 2,464 | ||||||
| 2025-04-08 | 13F | J2 Capital Management Inc | 0 | -100.00 | 0 | |||||
| 2025-05-14 | 13F | Kestra Advisory Services, LLC | 0 | -100.00 | 0 | -100.00 | ||||
| 2025-07-30 | 13F | Bogart Wealth, LLC | 74 | 0.00 | 9 | 0.00 | ||||
| 2025-03-28 | 13F/A | Berkeley, Inc | 0 | -100.00 | 0 | -100.00 | ||||
| 2025-07-14 | 13F | Park Avenue Securities Llc | 9,798 | 41.30 | 1 | |||||
| 2025-05-14 | 13F | Northwestern Mutual Wealth Management Co | 0 | -100.00 | 0 | |||||
| 2025-08-08 | 13F | Pnc Financial Services Group, Inc. | 9,328 | -9.71 | 1,167 | -8.12 | ||||
| 2025-08-14 | 13F | Raymond James Financial Inc | 3,062 | 1.36 | 383 | 3.23 | ||||
| 2025-06-24 | NP | TNNIX - 1290 Retirement 2040 Fund Class I | 577 | 0.00 | 69 | -9.33 | ||||
| 2025-08-14 | 13F | Fmr Llc | 157 | -12.78 | 20 | -13.64 | ||||
| 2025-07-18 | 13F | SOA Wealth Advisors, LLC. | 668 | 0.60 | 84 | 2.47 | ||||
| 2025-07-16 | 13F | ORG Partners LLC | 0 | -100.00 | 0 | |||||
| 2025-07-11 | 13F | Farther Finance Advisors, LLC | 59 | 1.72 | 7 | 0.00 | ||||
| 2025-08-13 | 13F | Congress Wealth Management LLC / DE / | 85,695 | -19.27 | 10,722 | -17.80 | ||||
| 2025-08-14 | 13F | Atomi Financial Group, Inc. | 2,235 | -1.97 | 280 | -0.36 | ||||
| 2025-07-22 | 13F | Miracle Mile Advisors, LLC | 2,725 | 341 | ||||||
| 2025-04-29 | 13F | Resources Investment Advisors, LLC. | 0 | -100.00 | 0 | -100.00 |