Basic Stats
| Institutional Owners | 117 total, 117 long only, 0 short only, 0 long/short - change of 0.85% MRQ |
| Average Portfolio Allocation | 0.3439 % - change of 8.43% MRQ |
| Institutional Shares (Long) | 20,146,367 (ex 13D/G) - change of 0.64MM shares 3.26% MRQ |
| Institutional Value (Long) | $ 190,813 USD ($1000) |
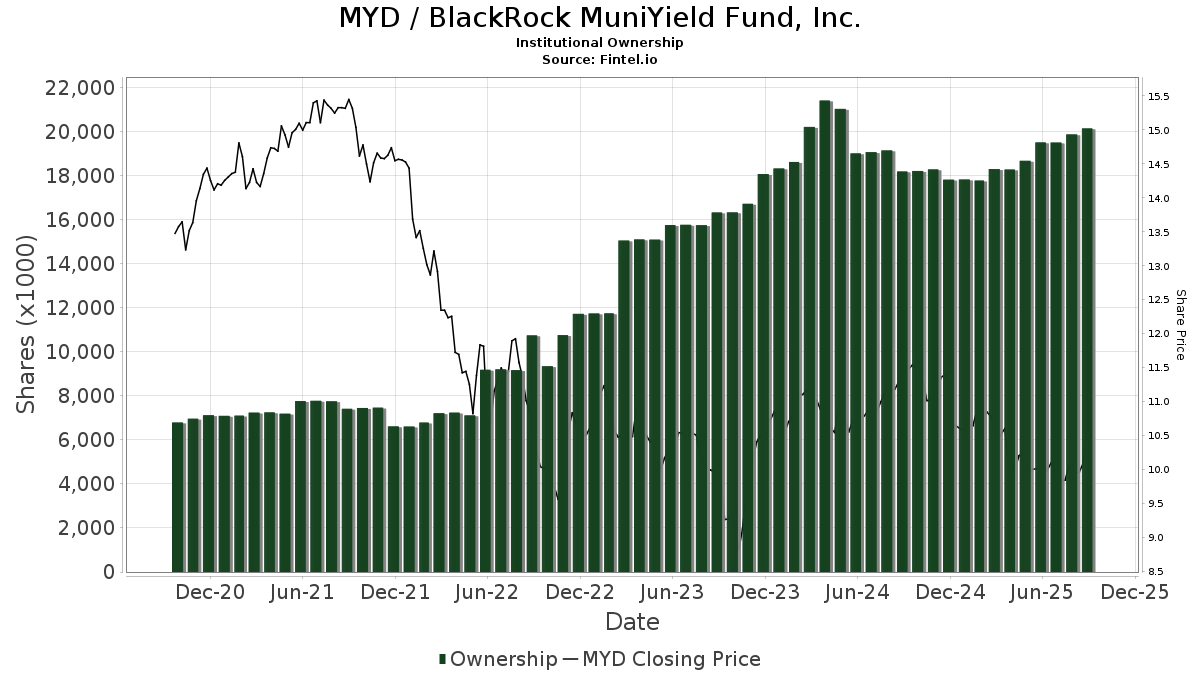
Institutional Ownership and Shareholders
BlackRock MuniYield Fund, Inc. (US:MYD) has 117 institutional owners and shareholders that have filed 13D/G or 13F forms with the Securities Exchange Commission (SEC). These institutions hold a total of 20,146,367 shares. Largest shareholders include Rivernorth Capital Management, Llc, Morgan Stanley, RiverNorth Flexible Municipal Income Fund II, Inc., Guggenheim Capital Llc, RiverNorth Managed Duration Municipal Income Fund, Inc., Mackay Shields Llc, Congress Park Capital LLC, Pathstone Holdings, LLC, RiverNorth Managed Duration Municipal Income Fund II, Inc., and HCIMX - The Intermediate Term Municipal Bond Portfolio HC Strategic Shares .
BlackRock MuniYield Fund, Inc. (NYSE:MYD) institutional ownership structure shows current positions in the company by institutions and funds, as well as latest changes in position size. Major shareholders can include individual investors, mutual funds, hedge funds, or institutions. The Schedule 13D indicates that the investor holds (or held) more than 5% of the company and intends (or intended) to actively pursue a change in business strategy. Schedule 13G indicates a passive investment of over 5%.
The share price as of September 8, 2025 is 10.40 / share. Previously, on September 9, 2024, the share price was 11.31 / share. This represents a decline of 8.05% over that period.
Fund Sentiment Score
The Fund Sentiment Score (fka Ownership Accumulation Score) finds the stocks that are being most bought by funds. It is the result of a sophisticated, multi-factor quantitative model that identifies companies with the highest levels of institutional accumulation. The scoring model uses a combination of the total increase in disclosed owners, the changes in portfolio allocations in those owners and other metrics. The number ranges from 0 to 100, with higher numbers indicating a higher level of accumulation to its peers, and 50 being the average.
Update Frequency: Daily
See Ownership Explorer, which provides a list of highest-ranking companies.
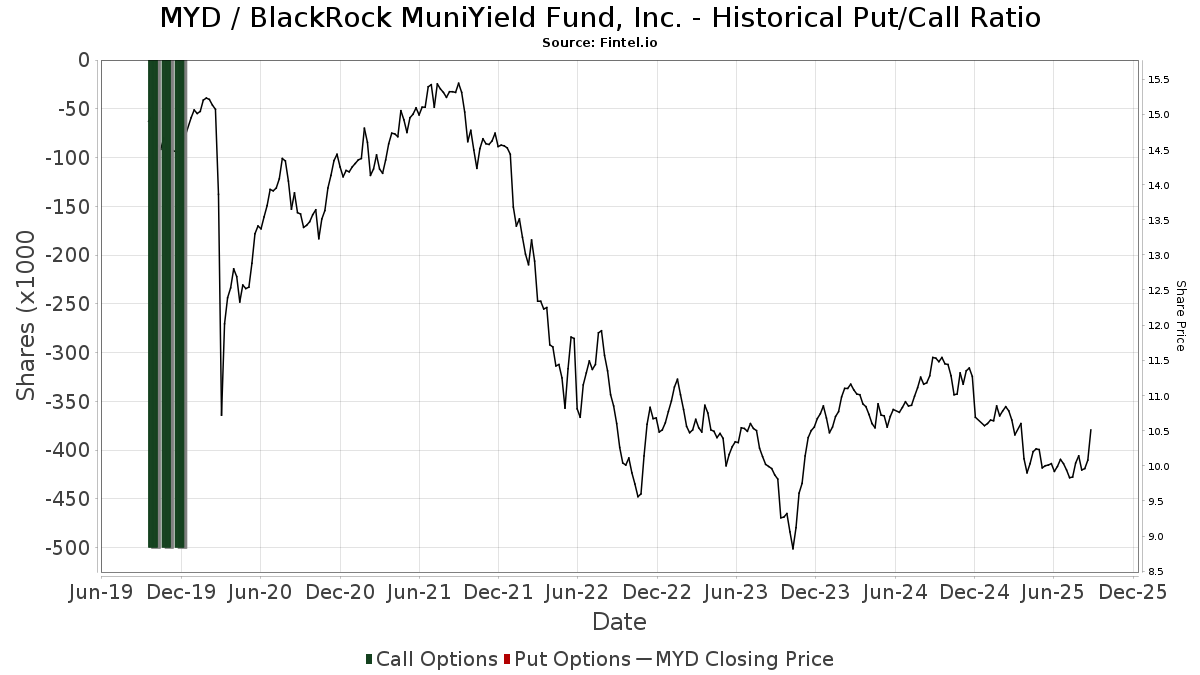
Institutional Put/Call Ratio
In addition to reporting standard equity and debt issues, institutions with more than 100MM assets under management must also disclose their put and call option holdings. Since put options generally indicate negative sentiment, and call options indicate positive sentiment, we can get a sense of the overall institutional sentiment by plotting the ratio of puts to calls. The chart to the right plots the historical put/call ratio for this instrument.
Using Put/Call Ratio as an indicator of investor sentiment overcomes one of the key deficiencies of using total institutional ownership, which is that a significant amount of assets under management are invested passively to track indices. Passively-managed funds do not typically buy options, so the put/call ratio indicator more closely tracks the sentiment of actively-managed funds.
13D/G Filings
We present 13D/G filings separately from the 13F filings because of the different treatement by the SEC. 13D/G filings can be filed by groups of investors (with one leading), whereas 13F filings cannot. This results in situations where an investor may file a 13D/G reporting one value for the total shares (representing all the shares owned by the investor group), but then file a 13F reporting a different value for the total shares (representing strictly their own ownership). This means that share ownership of 13D/G filings and 13F filings are oftentimes not directly comparable, so we present them separately.
Note: As of May 16, 2021, we no longer show owners that have not filed a 13D/G within the last year. Previously, we were showing the full history of 13D/G filings. In general, entities that are required to file 13D/G filings must file at least annually before submitting a closing filing. However, funds sometimes exit positions without submitting a closing filing (ie, they wind down), so displaying the full history sometimes resulted in confusion about the current ownership. To prevent confusion, we now only show ’current’ owners - that is - owners that have filed within the last year.
Upgrade to unlock premium data.
| File Date | Form | Investor | Prev Shares |
Latest Shares |
Δ Shares (Percent) |
Ownership (Percent) |
Δ Ownership (Percent) |
|
|---|---|---|---|---|---|---|---|---|
| 2025-01-10 | RIVERNORTH CAPITAL MANAGEMENT, LLC | 4,490,529 | 4,586,833 | 2.14 | 10.03 | 4.81 | ||
| 2024-12-13 | BANK OF AMERICA CORP /DE/ | 0 | 0 | 0.00 |
13F and NPORT Filings
Detail on 13F filings are free. Detail on NP filings require a premium membership. Green rows indicate new positions. Red rows indicate closed positions. Click the link icon to see the full transaction history.
Upgrade
to unlock premium data and export to Excel ![]() .
.
| File Date | Source | Investor | Type | Avg Price (Est) |
Shares | Δ Shares (%) |
Reported Value ($1000) |
Δ Value (%) |
Port Alloc (%) |
|
|---|---|---|---|---|---|---|---|---|---|---|
| 2025-07-31 | 13F | 180 Wealth Advisors, Llc | 47,795 | -0.10 | 480 | -4.96 | ||||
| 2025-08-14 | 13F | Summit Trail Advisors, Llc | 0 | -100.00 | 0 | |||||
| 2025-05-15 | 13F | Logan Stone Capital, LLC | 0 | -100.00 | 0 | |||||
| 2025-07-17 | 13F | Nelson, Van Denburg & Campbell Wealth Management Group, LLC | 0 | -100.00 | 0 | |||||
| 2025-08-01 | 13F | Envestnet Asset Management Inc | 171,423 | 1,721 | ||||||
| 2025-07-11 | 13F | Farther Finance Advisors, LLC | 1,173 | 0.00 | 12 | -8.33 | ||||
| 2025-08-14 | 13F | Toronto Dominion Bank | 3,490 | 35 | ||||||
| 2025-07-28 | 13F | RFG Advisory, LLC | 27,800 | 1.83 | 279 | -3.12 | ||||
| 2025-08-14 | 13F | Comerica Bank | 2,309 | -89.66 | 23 | -90.21 | ||||
| 2025-07-29 | NP | TAMBX - John Hancock Tax-Free Bond Fund Class A | 125,000 | 0.00 | 1,248 | -8.31 | ||||
| 2025-09-04 | 13F/A | Advisor Group Holdings, Inc. | 58,827 | -4.33 | 591 | -8.95 | ||||
| 2025-08-12 | 13F | Sfmg, Llc | 14,213 | 0.00 | 143 | -4.70 | ||||
| 2025-08-14 | 13F | Karpus Management, Inc. | 186,298 | 44.98 | 1,870 | 38.01 | ||||
| 2025-08-27 | NP | HCIMX - The Intermediate Term Municipal Bond Portfolio HC Strategic Shares | 413,320 | 9.46 | 4,150 | 4.17 | ||||
| 2025-08-14 | 13F | Goldman Sachs Group Inc | 11,655 | 0.00 | 117 | -4.10 | ||||
| 2025-05-05 | 13F | Mariner Investment Group Llc | 0 | -100.00 | 0 | -100.00 | ||||
| 2025-08-12 | 13F | LPL Financial LLC | 251,306 | -4.86 | 2,523 | -9.44 | ||||
| 2025-08-28 | NP | RiverNorth Flexible Municipal Income Fund, Inc. | 253,601 | 0.00 | 2,546 | -4.82 | ||||
| 2025-08-11 | 13F | Blue Bell Private Wealth Management, Llc | 400 | 0.00 | 4 | 0.00 | ||||
| 2025-08-05 | 13F | Bank Of Montreal /can/ | 22,663 | 5.32 | 228 | 0.00 | ||||
| 2025-08-14 | 13F/A | Rockefeller Capital Management L.P. | 59,802 | -11.50 | 600 | -15.73 | ||||
| 2025-08-14 | 13F | Main Street Financial Solutions, LLC | 17,733 | 0.00 | 178 | -4.81 | ||||
| 2025-08-28 | NP | RiverNorth Managed Duration Municipal Income Fund II, Inc. | 646,871 | 0.00 | 6,495 | -4.84 | ||||
| 2025-08-08 | 13F | Cetera Investment Advisers | 36,576 | -2.72 | 367 | -7.32 | ||||
| 2025-05-12 | 13F | Independent Advisor Alliance | 0 | -100.00 | 0 | |||||
| 2025-07-10 | 13F | Wealth Enhancement Advisory Services, Llc | 14,533 | -39.25 | 147 | -42.06 | ||||
| 2025-08-14 | 13F | Hrt Financial Lp | 21,269 | 0 | ||||||
| 2025-08-05 | 13F | Bank of New York Mellon Corp | 47,012 | 43.20 | 472 | 36.42 | ||||
| 2025-06-25 | NP | XMPT - VanEck Vectors CEF Municipal Income ETF | 283,218 | -0.20 | 2,889 | -4.69 | ||||
| 2025-07-25 | 13F | Integrated Capital Management, Inc. | 31,252 | 314 | ||||||
| 2025-08-11 | 13F | Kim, Llc | 117,349 | 1.08 | 1,178 | -3.76 | ||||
| 2025-07-24 | 13F | Us Bancorp \de\ | 1,000 | 0.00 | 10 | 0.00 | ||||
| 2025-07-16 | 13F | Perigon Wealth Management, LLC | 10,306 | 0.00 | 103 | -4.63 | ||||
| 2025-08-14 | 13F | UBS Group AG | 186,061 | 33.99 | 1,868 | 27.51 | ||||
| 2025-08-08 | 13F | Pnc Financial Services Group, Inc. | 10,022 | 0.00 | 101 | -4.76 | ||||
| 2025-08-28 | NP | RiverNorth Opportunistic Municipal Income Fund, Inc. | 254,870 | 0.00 | 2,559 | -4.84 | ||||
| 2025-07-11 | 13F | Congress Park Capital LLC | 727,500 | -10.07 | 7,304 | -14.41 | ||||
| 2025-08-13 | 13F | EverSource Wealth Advisors, LLC | 109 | 0.00 | 1 | 0.00 | ||||
| 2025-07-31 | 13F | Cambridge Investment Research Advisors, Inc. | 82,310 | -30.70 | 1 | -100.00 | ||||
| 2025-08-28 | NP | Rivernorth Opportunities Fund, Inc. | 187,151 | 0.00 | 1,879 | -4.86 | ||||
| 2025-08-12 | 13F | J.w. Cole Advisors, Inc. | 24,224 | 243 | ||||||
| 2025-08-01 | 13F | Transcend Wealth Collective, Llc | 0 | -100.00 | 0 | |||||
| 2025-07-31 | 13F | CNB Bank | 361 | 0.00 | 4 | 0.00 | ||||
| 2025-08-06 | 13F | Prospera Financial Services Inc | 16,780 | 168 | ||||||
| 2025-08-05 | 13F | Intellectus Partners, LLC | 129,500 | 2.37 | 1,307 | -2.54 | ||||
| 2025-08-13 | 13F | Rsm Us Wealth Management Llc | 10,648 | -15.56 | 108 | -19.55 | ||||
| 2025-08-05 | 13F | Huntington National Bank | 46 | -6.25 | ||||||
| 2025-08-14 | 13F | Royal Bank Of Canada | 77,485 | 8.57 | 778 | 3.32 | ||||
| 2025-08-04 | 13F | Wolverine Asset Management Llc | 95,997 | 243.99 | 964 | 227.55 | ||||
| 2025-04-22 | 13F | Tanglewood Legacy Advisors, LLC | 0 | -100.00 | 0 | |||||
| 2025-07-28 | 13F | Pettinga Financial Advisors, LLC | 30,060 | 85.78 | 302 | 77.06 | ||||
| 2025-05-14 | 13F | Jane Street Group, Llc | 0 | -100.00 | 0 | |||||
| 2025-07-17 | 13F/A | Capital Investment Advisors, LLC | 10,525 | 0.00 | 106 | -5.41 | ||||
| 2025-07-22 | 13F | Mascoma Wealth Management LLC | 421 | 0.00 | 4 | 0.00 | ||||
| 2025-08-12 | 13F | Coldstream Capital Management Inc | 0 | -100.00 | 0 | |||||
| 2025-08-14 | 13F | Sit Investment Associates Inc | 293,195 | 21.42 | 3 | 0.00 | ||||
| 2025-08-12 | 13F | Landscape Capital Management, L.l.c. | 27,447 | -30.80 | 276 | -34.21 | ||||
| 2025-08-15 | 13F | CI Private Wealth, LLC | 41,374 | 58.56 | 415 | 50.91 | ||||
| 2025-07-24 | 13F | Mackay Shields Llc | 744,760 | 33.42 | 7,477 | 26.97 | ||||
| 2025-07-25 | 13F | Atria Wealth Solutions, Inc. | 13,418 | 6.66 | 136 | 2.27 | ||||
| 2025-08-07 | 13F | Hennion & Walsh Asset Management, Inc. | 319,983 | 89.58 | 3,213 | 80.45 | ||||
| 2025-08-07 | 13F | Readystate Asset Management Lp | 47,885 | 481 | ||||||
| 2025-08-14 | 13F | Cohen & Steers, Inc. | 83,315 | 0.00 | 1 | |||||
| 2025-08-11 | 13F | Rothschild Investment Llc | 124,300 | -4.68 | 1,248 | -9.31 | ||||
| 2025-08-25 | NP | QWVQX - Clearwater Tax-Exempt Bond Fund | 25,000 | 0.00 | 251 | -4.56 | ||||
| 2025-08-13 | 13F | Northwestern Mutual Wealth Management Co | 63,963 | -1.36 | 642 | -6.14 | ||||
| 2025-05-14 | 13F | Walleye Capital LLC | 0 | -100.00 | 0 | |||||
| 2025-07-18 | 13F | Truist Financial Corp | 10,138 | -18.66 | 102 | -22.90 | ||||
| 2025-08-12 | 13F | Franklin Resources Inc | 24,530 | 246 | ||||||
| 2025-08-07 | 13F | McClarren Financial Advisors, Inc. | 0 | -100.00 | 0 | |||||
| 2025-05-29 | 13F/A | Modern Wealth Management, LLC | 40,000 | 434 | ||||||
| 2025-05-15 | 13F | Family Management Corp | 0 | -100.00 | 0 | |||||
| 2025-08-12 | 13F | XTX Topco Ltd | 11,871 | 119 | ||||||
| 2025-08-19 | 13F | Newbridge Financial Services Group, Inc. | 1,000 | 10 | ||||||
| 2025-07-14 | 13F | Park Avenue Securities Llc | 159,924 | 2 | ||||||
| 2025-07-22 | 13F | Fortitude Advisory Group L.L.C. | 32,076 | 0.00 | 322 | 1.58 | ||||
| 2025-07-23 | 13F | Wheelhouse Advisory Group LLC | 30,158 | -29.38 | 303 | -32.89 | ||||
| 2025-08-05 | 13F | Rareview Capital LLC | 199,334 | 98.47 | 2,001 | 88.95 | ||||
| 2025-08-13 | 13F | Invesco Ltd. | 41,710 | -47.23 | 419 | -49.82 | ||||
| 2025-05-13 | 13F | Steward Partners Investment Advisory, Llc | 0 | -100.00 | 0 | |||||
| 2025-08-14 | 13F | Raymond James Financial Inc | 131,943 | -9.53 | 1,325 | -13.91 | ||||
| 2025-08-14 | 13F | Rivernorth Capital Management, Llc | 4,572,204 | 0.80 | 45,905 | -4.08 | ||||
| 2025-08-04 | 13F | Simon Quick Advisors, Llc | 11,494 | 4.66 | 115 | 0.00 | ||||
| 2025-08-27 | NP | RYMSX - Guggenheim Multi-Hedge Strategies Fund Class P | 185 | -24.80 | 2 | -50.00 | ||||
| 2025-05-15 | 13F | Nomura Holdings Inc | 0 | -100.00 | 0 | |||||
| 2025-07-24 | 13F | Brandywine Oak Private Wealth Llc | 30,000 | 0.00 | 301 | -4.75 | ||||
| 2025-08-14 | 13F | Bramshill Investments, LLC | 15,134 | 37.32 | 152 | 30.17 | ||||
| 2025-08-11 | 13F | WPG Advisers, LLC | 407 | -46.38 | 4 | -50.00 | ||||
| 2025-08-28 | NP | RiverNorth Flexible Municipal Income Fund II, Inc. | 1,373,865 | 0.00 | 13,794 | -4.84 | ||||
| 2025-07-17 | 13F | Camelot Portfolios, LLC | 10,000 | 0.00 | 100 | -4.76 | ||||
| 2025-08-29 | 13F | Centaurus Financial, Inc. | 17,420 | -6.70 | 0 | |||||
| 2025-08-12 | 13F | MAI Capital Management | 33,800 | 0.05 | 339 | -4.78 | ||||
| 2025-08-08 | 13F | Fiera Capital Corp | 283,143 | -0.58 | 2,843 | -5.39 | ||||
| 2025-05-12 | 13F | Sandy Spring Bank | 5,000 | 0.00 | 53 | 1.96 | ||||
| 2025-08-14 | 13F | Robinson Capital Management, Llc | 248,548 | 5.63 | 2,495 | 0.52 | ||||
| 2025-08-12 | 13F | AlphaCore Capital LLC | 0 | -100.00 | 0 | |||||
| 2025-08-14 | 13F | Ameriprise Financial Inc | 53,798 | -1.56 | 540 | -6.25 | ||||
| 2025-08-27 | NP | RYDEX VARIABLE TRUST - Multi-Hedge Strategies Fund Variable Annuity | 312 | -3.11 | 3 | 0.00 | ||||
| 2025-08-13 | 13F | Jones Financial Companies Lllp | 0 | -100.00 | 0 | |||||
| 2025-08-15 | 13F | Morgan Stanley | 1,396,532 | -2.12 | 14,021 | -6.85 | ||||
| 2025-08-11 | 13F | Principal Securities, Inc. | 3,215 | -3.02 | 32 | -5.88 | ||||
| 2025-07-30 | 13F | Avidian Wealth Solutions, LLC | 10,367 | 1.61 | 104 | -2.80 | ||||
| 2025-08-14 | 13F | Wells Fargo & Company/mn | 191,726 | 16.09 | 1,925 | 10.45 | ||||
| 2025-08-06 | 13F | Commonwealth Equity Services, Llc | 150,791 | 28.64 | 2 | 0.00 | ||||
| 2025-08-14 | 13F | GWM Advisors LLC | 42,741 | 16.70 | 429 | 11.14 | ||||
| 2025-06-24 | NP | MMHVX - MainStay MacKay High Yield Municipal Bond Fund Investor Class | 200,504 | 0.00 | 2,045 | -4.48 | ||||
| 2025-08-28 | NP | RiverNorth Managed Duration Municipal Income Fund, Inc. | 756,782 | 0.00 | 7,598 | -4.83 | ||||
| 2025-08-13 | 13F | West Chester Capital Advisors, Inc | 22,375 | 0.00 | 225 | -5.08 | ||||
| 2025-05-13 | 13F | Elequin Capital Lp | 0 | -100.00 | 0 | |||||
| 2025-08-12 | 13F | Proequities, Inc. | 0 | 0 | ||||||
| 2025-07-08 | 13F | Lowe Wealth Advisors, LLC | 1,005 | 0.00 | 10 | 0.00 | ||||
| 2025-08-28 | NP | Cohen & Steers Closed-end Opportunity Fund, Inc. | 48,315 | 0.00 | 485 | -4.72 | ||||
| 2025-08-06 | 13F | Atlantic Union Bankshares Corp | 5,000 | 50 | ||||||
| 2025-08-11 | 13F | Brown Brothers Harriman & Co | 235,344 | 0.00 | 2,363 | -4.83 | ||||
| 2025-08-14 | 13F | Mml Investors Services, Llc | 12,617 | 0 | ||||||
| 2025-08-07 | 13F | Atala Financial Inc | 59,480 | -34.03 | 597 | -37.22 | ||||
| 2025-07-29 | 13F | Chicago Partners Investment Group LLC | 93,401 | 0.00 | 918 | -3.97 | ||||
| 2025-08-12 | 13F | Virtu Financial LLC | 38,302 | 0 | ||||||
| 2025-08-04 | 13F | Hantz Financial Services, Inc. | 110 | 1.85 | 0 | |||||
| 2025-08-07 | 13F | Montag A & Associates Inc | 0 | -100.00 | 0 | |||||
| 2025-08-18 | 13F | Geneos Wealth Management Inc. | 4,896 | -17.76 | 49 | -20.97 | ||||
| 2025-08-18 | 13F | Hollencrest Capital Management | 16,985 | 0.00 | 171 | -5.03 | ||||
| 2025-07-30 | 13F | FNY Investment Advisers, LLC | 500 | 0.00 | 0 | |||||
| 2025-08-11 | 13F | Advisor Resource Council | 0 | -100.00 | 0 | |||||
| 2025-08-28 | NP | RDFI - RAREVIEW DYNAMIC FIXED INCOME ETF | 97,080 | 92.24 | 975 | 83.08 | ||||
| 2025-08-08 | 13F | City Of London Investment Management Co Ltd | 413,320 | -12.79 | 4,150 | -17.02 | ||||
| 2025-08-14 | 13F | Van Eck Associates Corp | 286,869 | 1.91 | 3 | 0.00 | ||||
| 2025-08-14 | 13F | Mariner, LLC | 11,000 | 0.00 | 110 | -5.17 | ||||
| 2025-08-27 | NP | ROBAX - Robinson Tax Advantaged Income Fund Class A Shares | 248,548 | 5.63 | 2,495 | 0.52 | ||||
| 2025-08-11 | 13F | HighTower Advisors, LLC | 17,296 | 4.85 | 174 | -0.57 | ||||
| 2025-08-12 | 13F | Pathstone Holdings, LLC | 671,410 | -13.47 | 6,741 | -18.44 | ||||
| 2025-08-28 | NP | RTAI - RAREVIEW TAX ADVANTAGED INCOME ETF | 99,336 | 108.94 | 997 | 99.00 | ||||
| 2025-08-11 | 13F | Private Advisor Group, LLC | 10,236 | -20.12 | 103 | -24.44 | ||||
| 2025-08-14 | 13F | Susquehanna International Group, Llp | 0 | -100.00 | 0 | |||||
| 2025-07-22 | 13F | Merit Financial Group, LLC | 10,597 | 106 | ||||||
| 2025-08-13 | 13F | Guggenheim Capital Llc | 843,948 | -18.11 | 8,473 | -22.07 | ||||
| 2025-07-17 | 13F | Nova R Wealth, Inc. | 86,694 | -7.58 | 870 | -12.03 | ||||
| 2025-07-31 | 13F | Pacitti Group Inc. | 16,428 | -12.84 | 165 | -17.17 | ||||
| 2025-08-14 | 13F | Bank Of America Corp /de/ | 197,765 | -26.18 | 1,986 | -29.76 |