Basic Stats
| Institutional Owners | 42 total, 42 long only, 0 short only, 0 long/short - change of 2.44% MRQ |
| Average Portfolio Allocation | 0.5114 % - change of 8.85% MRQ |
| Institutional Shares (Long) | 66,448,514 (ex 13D/G) - change of 58.71MM shares 758.46% MRQ |
| Institutional Value (Long) | $ 638,065 USD ($1000) |
Institutional Ownership and Shareholders
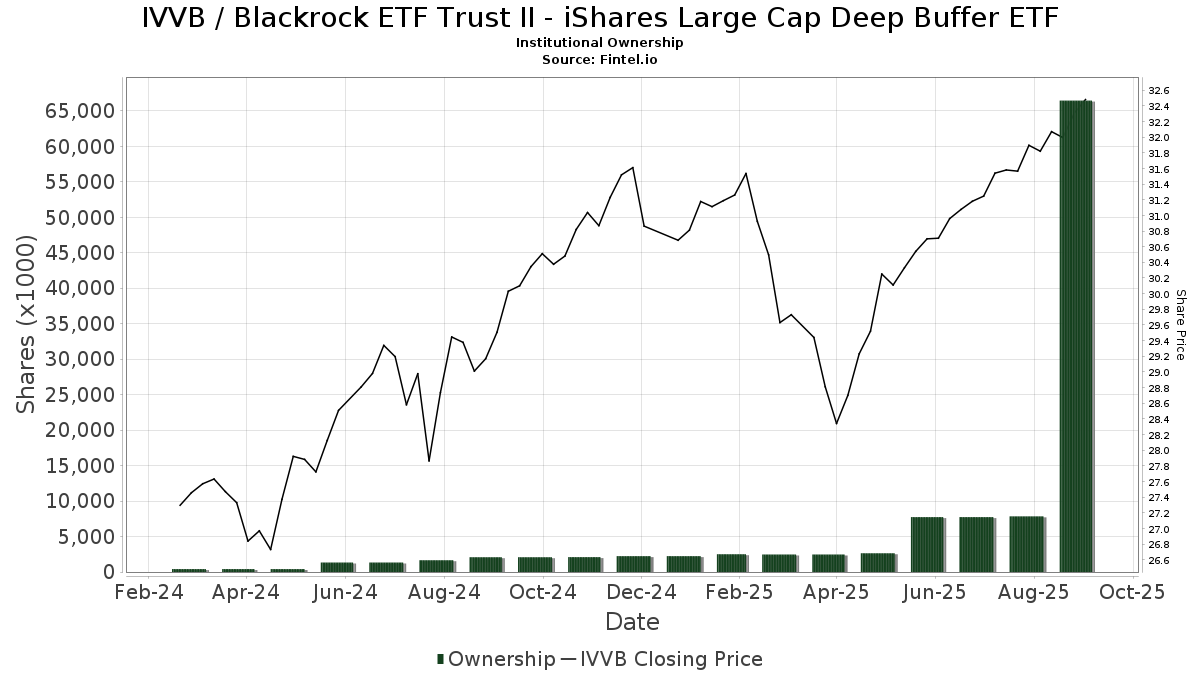
Blackrock ETF Trust II - iShares Large Cap Deep Buffer ETF (US:IVVB) has 42 institutional owners and shareholders that have filed 13D/G or 13F forms with the Securities Exchange Commission (SEC). These institutions hold a total of 66,448,514 shares. Largest shareholders include Brevan Howard Capital Management LP, 3EDGE Asset Management, LP, BlackRock, Inc., Captrust Financial Advisors, Cambridge Investment Research Advisors, Inc., Americana Partners, LLC, Planned Solutions, Inc., Alliance Wealth Advisors, LLC /UT, Vantage Financial Partners, LLC, and Portside Wealth Group, LLC .
Blackrock ETF Trust II - iShares Large Cap Deep Buffer ETF (BATS:IVVB) institutional ownership structure shows current positions in the company by institutions and funds, as well as latest changes in position size. Major shareholders can include individual investors, mutual funds, hedge funds, or institutions. The Schedule 13D indicates that the investor holds (or held) more than 5% of the company and intends (or intended) to actively pursue a change in business strategy. Schedule 13G indicates a passive investment of over 5%.
The share price as of September 8, 2025 is 32.19 / share. Previously, on September 9, 2024, the share price was 28.77 / share. This represents an increase of 11.88% over that period.
Fund Sentiment Score
The Fund Sentiment Score (fka Ownership Accumulation Score) finds the stocks that are being most bought by funds. It is the result of a sophisticated, multi-factor quantitative model that identifies companies with the highest levels of institutional accumulation. The scoring model uses a combination of the total increase in disclosed owners, the changes in portfolio allocations in those owners and other metrics. The number ranges from 0 to 100, with higher numbers indicating a higher level of accumulation to its peers, and 50 being the average.
Update Frequency: Daily
See Ownership Explorer, which provides a list of highest-ranking companies.
Institutional Put/Call Ratio
In addition to reporting standard equity and debt issues, institutions with more than 100MM assets under management must also disclose their put and call option holdings. Since put options generally indicate negative sentiment, and call options indicate positive sentiment, we can get a sense of the overall institutional sentiment by plotting the ratio of puts to calls. The chart to the right plots the historical put/call ratio for this instrument.
Using Put/Call Ratio as an indicator of investor sentiment overcomes one of the key deficiencies of using total institutional ownership, which is that a significant amount of assets under management are invested passively to track indices. Passively-managed funds do not typically buy options, so the put/call ratio indicator more closely tracks the sentiment of actively-managed funds.
13D/G Filings
We present 13D/G filings separately from the 13F filings because of the different treatement by the SEC. 13D/G filings can be filed by groups of investors (with one leading), whereas 13F filings cannot. This results in situations where an investor may file a 13D/G reporting one value for the total shares (representing all the shares owned by the investor group), but then file a 13F reporting a different value for the total shares (representing strictly their own ownership). This means that share ownership of 13D/G filings and 13F filings are oftentimes not directly comparable, so we present them separately.
Note: As of May 16, 2021, we no longer show owners that have not filed a 13D/G within the last year. Previously, we were showing the full history of 13D/G filings. In general, entities that are required to file 13D/G filings must file at least annually before submitting a closing filing. However, funds sometimes exit positions without submitting a closing filing (ie, they wind down), so displaying the full history sometimes resulted in confusion about the current ownership. To prevent confusion, we now only show ’current’ owners - that is - owners that have filed within the last year.
Upgrade to unlock premium data.
| File Date | Form | Investor | Prev Shares |
Latest Shares |
Δ Shares (Percent) |
Ownership (Percent) |
Δ Ownership (Percent) |
|
|---|---|---|---|---|---|---|---|---|
| 2025-09-05 | BlackRock Portfolio Management LLC | 590,000 | 470,000 | -20.34 | 12.90 | 89.71 | ||
| 2025-02-07 | BlackRock, Inc. | 0 | 0.00 |
13F and NPORT Filings
Detail on 13F filings are free. Detail on NP filings require a premium membership. Green rows indicate new positions. Red rows indicate closed positions. Click the link icon to see the full transaction history.
Upgrade
to unlock premium data and export to Excel ![]() .
.
| File Date | Source | Investor | Type | Avg Price (Est) |
Shares | Δ Shares (%) |
Reported Value ($1000) |
Δ Value (%) |
Port Alloc (%) |
|
|---|---|---|---|---|---|---|---|---|---|---|
| 2025-07-14 | 13F | Matrix Trust Co | 42,028 | 21.24 | 1 | 0.00 | ||||
| 2025-08-13 | 13F | Certior Financial Group, Llc | 85,061 | 0.06 | 2,638 | 5.82 | ||||
| 2025-08-14 | 13F | Diversify Wealth Management, Llc | 7,829 | -7.13 | 250 | 1.22 | ||||
| 2025-08-14 | 13F | UBS Group AG | 0 | -100.00 | 0 | |||||
| 2025-08-05 | 13F | Prosperity Consulting Group, LLC | 33,277 | 0.00 | 1,032 | 5.74 | ||||
| 2025-07-30 | 13F | Wallace Advisory Group, LLC | 48,060 | 1,409 | ||||||
| 2025-07-21 | 13F | Ameritas Advisory Services, LLC | 0 | -100.00 | 0 | |||||
| 2025-07-29 | 13F | Planned Solutions, Inc. | 186,318 | 1.15 | 5,778 | 6.98 | ||||
| 2025-07-15 | 13F | Mather Group, Llc. | 0 | -100.00 | 0 | |||||
| 2025-07-18 | 13F | PFG Investments, LLC | 45,073 | -0.77 | 1,398 | 4.96 | ||||
| 2025-07-10 | 13F | Wealth Enhancement Advisory Services, Llc | 23,485 | 0.00 | 733 | 6.54 | ||||
| 2025-08-14 | 13F | Arete Wealth Advisors, LLC | 59,663 | 2 | ||||||
| 2025-08-14 | 13F | Wick Capital Partners, LLC | 3,281 | -99.03 | 11,241 | 12.96 | ||||
| 2025-08-14 | 13F | GWM Advisors LLC | 14,688 | 15.19 | 455 | 21.98 | ||||
| 2025-07-24 | 13F | IFP Advisors, Inc | 280 | 9 | ||||||
| 2025-08-12 | 13F | Jpmorgan Chase & Co | 54 | -96.62 | 2 | -97.83 | ||||
| 2025-08-11 | 13F | Principal Securities, Inc. | 1,600 | 0.00 | 50 | 2.08 | ||||
| 2025-08-14 | 13F | Brevan Howard Capital Management LP | 60,706,457 | 460,526 | ||||||
| 2025-08-04 | 13F | Savvy Advisors, Inc. | 0 | -100.00 | 0 | |||||
| 2025-08-14 | 13F | Alliance Wealth Advisors, LLC /UT | 152,930 | 5.75 | 4,742 | 11.84 | ||||
| 2025-07-15 | 13F | Norden Group Llc | 28,782 | 33.26 | 893 | 40.92 | ||||
| 2025-08-08 | 13F | KM Capital Management Ltd. | 14,800 | 0.00 | 459 | 5.77 | ||||
| 2025-08-06 | 13F | Regimen Wealth, Llc | 8,948 | 0.00 | 277 | 5.73 | ||||
| 2025-07-17 | 13F | Financial Designs Corp | 0 | -100.00 | 0 | |||||
| 2025-08-14 | 13F | Diversify Advisory Services, LLC | 12,708 | 2.26 | 405 | 11.57 | ||||
| 2025-08-18 | 13F | Geneos Wealth Management Inc. | 65 | 0.00 | 2 | 100.00 | ||||
| 2025-08-15 | 13F | Captrust Financial Advisors | 378,347 | 14.33 | 11,733 | 20.92 | ||||
| 2025-08-13 | 13F | Continuum Advisory, LLC | 0 | -100.00 | 0 | |||||
| 2025-07-30 | 13F | Strategic Blueprint, LLC | 32,418 | -4.56 | 1,005 | 1.01 | ||||
| 2025-07-17 | 13F | ERn Financial, LLC | 60,184 | 1,866 | ||||||
| 2025-08-07 | 13F | Americana Partners, LLC | 270,457 | -79.79 | 8,387 | -78.62 | ||||
| 2025-08-14 | 13F | Modern Wealth Management, LLC | 6,502 | 202 | ||||||
| 2025-08-13 | 13F | Gibbs Wealth Management | 10,877 | 337 | ||||||
| 2025-07-28 | 13F | Harbour Investments, Inc. | 1,668 | 0.00 | 52 | 6.25 | ||||
| 2025-08-06 | 13F | Csenge Advisory Group | 15,163 | 10.08 | 461 | 17.35 | ||||
| 2025-08-14 | 13F | Financial Network Wealth Advisors LLC | 16,022 | 4.72 | 497 | 10.71 | ||||
| 2025-05-15 | 13F | Old Mission Capital Llc | 0 | -100.00 | 0 | |||||
| 2025-09-04 | 13F/A | Advisor Group Holdings, Inc. | 31 | -87.60 | 1 | -100.00 | ||||
| 2025-05-14 | 13F | Jane Street Group, Llc | 0 | -100.00 | 0 | |||||
| 2025-07-31 | 13F | 3EDGE Asset Management, LP | 2,960,255 | -0.13 | 91,798 | 5.63 | ||||
| 2025-08-14 | 13F | Susquehanna International Group, Llp | 39,324 | -41.61 | 1,219 | -38.25 | ||||
| 2025-07-31 | 13F | Cambridge Investment Research Advisors, Inc. | 271,787 | 4.20 | 8 | 14.29 | ||||
| 2025-08-12 | 13F | Proequities, Inc. | 0 | 0 | ||||||
| 2025-07-23 | 13F | Valmark Advisers, Inc. | 29,050 | 18.89 | 901 | 25.70 | ||||
| 2025-08-13 | 13F | Townsquare Capital Llc | 14,018 | -96.79 | 435 | -96.61 | ||||
| 2025-08-14 | 13F | Mercer Global Advisors Inc /adv | 8,277 | 0.00 | 257 | 5.79 | ||||
| 2025-08-06 | 13F | Vantage Financial Partners, LLC | 104,335 | -11.49 | 3,235 | -6.39 | ||||
| 2025-08-11 | 13F | Portside Wealth Group, LLC | 90,638 | 4.89 | 2,811 | 10.94 | ||||
| 2025-08-12 | 13F | BlackRock, Inc. | 590,000 | -37.89 | 18,296 | -34.32 | ||||
| 2025-08-13 | 13F | Cerity Partners LLC | 73,774 | 0.00 | 2,288 | 5.73 |