Basic Stats
| Institutional Owners | 89 total, 89 long only, 0 short only, 0 long/short - change of 15.38% MRQ |
| Average Portfolio Allocation | 0.4077 % - change of -8.52% MRQ |
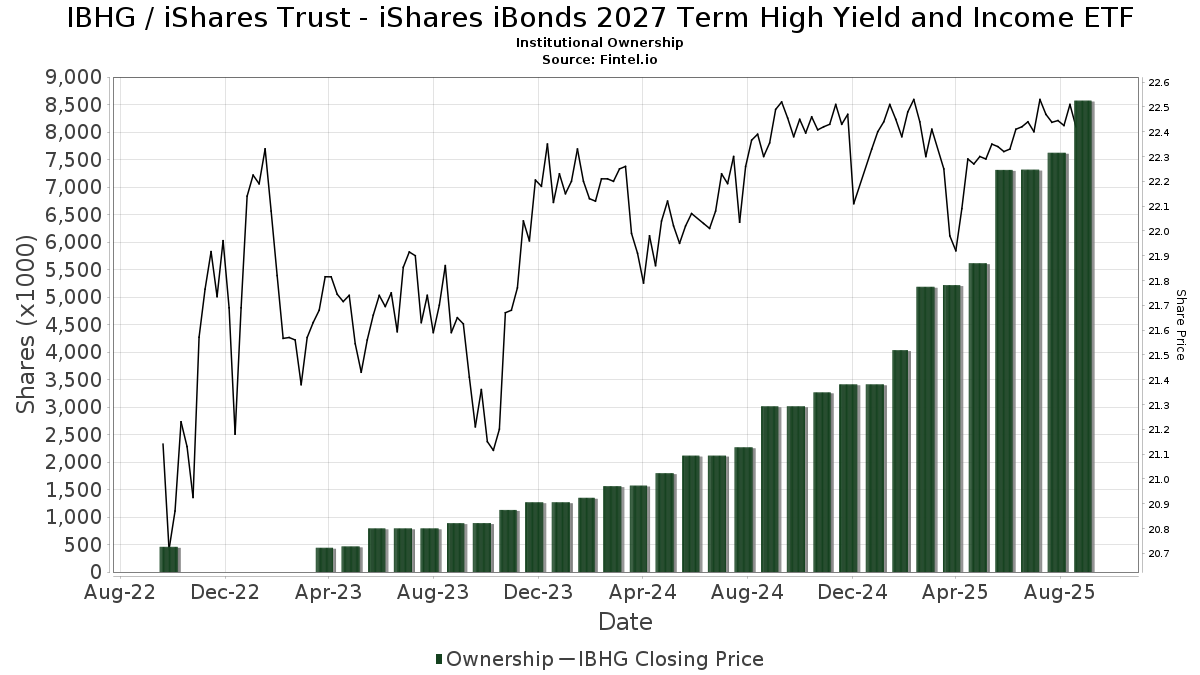
| Institutional Shares (Long) | 8,575,645 (ex 13D/G) - change of 1.26MM shares 17.24% MRQ |
| Institutional Value (Long) | $ 182,646 USD ($1000) |
Institutional Ownership and Shareholders
iShares Trust - iShares iBonds 2027 Term High Yield and Income ETF (US:IBHG) has 89 institutional owners and shareholders that have filed 13D/G or 13F forms with the Securities Exchange Commission (SEC). These institutions hold a total of 8,575,645 shares. Largest shareholders include Lbmc Investment Advisors, Llc, Advisor Group Holdings, Inc., Northwestern Mutual Wealth Management Co, Wells Fargo & Company/mn, Keeler THomas Management LLC, LPL Financial LLC, Commonwealth Equity Services, Llc, HighTower Advisors, LLC, Commonwealth Financial Services, LLC, and Mutual Advisors, LLC .
iShares Trust - iShares iBonds 2027 Term High Yield and Income ETF (BATS:IBHG) institutional ownership structure shows current positions in the company by institutions and funds, as well as latest changes in position size. Major shareholders can include individual investors, mutual funds, hedge funds, or institutions. The Schedule 13D indicates that the investor holds (or held) more than 5% of the company and intends (or intended) to actively pursue a change in business strategy. Schedule 13G indicates a passive investment of over 5%.
The share price as of September 5, 2025 is 22.45 / share. Previously, on September 9, 2024, the share price was 22.34 / share. This represents an increase of 0.49% over that period.
Fund Sentiment Score
The Fund Sentiment Score (fka Ownership Accumulation Score) finds the stocks that are being most bought by funds. It is the result of a sophisticated, multi-factor quantitative model that identifies companies with the highest levels of institutional accumulation. The scoring model uses a combination of the total increase in disclosed owners, the changes in portfolio allocations in those owners and other metrics. The number ranges from 0 to 100, with higher numbers indicating a higher level of accumulation to its peers, and 50 being the average.
Update Frequency: Daily
See Ownership Explorer, which provides a list of highest-ranking companies.
Institutional Put/Call Ratio
In addition to reporting standard equity and debt issues, institutions with more than 100MM assets under management must also disclose their put and call option holdings. Since put options generally indicate negative sentiment, and call options indicate positive sentiment, we can get a sense of the overall institutional sentiment by plotting the ratio of puts to calls. The chart to the right plots the historical put/call ratio for this instrument.
Using Put/Call Ratio as an indicator of investor sentiment overcomes one of the key deficiencies of using total institutional ownership, which is that a significant amount of assets under management are invested passively to track indices. Passively-managed funds do not typically buy options, so the put/call ratio indicator more closely tracks the sentiment of actively-managed funds.
13F and NPORT Filings
Detail on 13F filings are free. Detail on NP filings require a premium membership. Green rows indicate new positions. Red rows indicate closed positions. Click the link icon to see the full transaction history.
Upgrade
to unlock premium data and export to Excel ![]() .
.
| File Date | Source | Investor | Type | Avg Price (Est) |
Shares | Δ Shares (%) |
Reported Value ($1000) |
Δ Value (%) |
Port Alloc (%) |
|
|---|---|---|---|---|---|---|---|---|---|---|
| 2025-08-08 | 13F | Wrapmanager Inc | 50,879 | 1.53 | 1,147 | 2.50 | ||||
| 2025-07-29 | 13F | Stratos Wealth Partners, LTD. | 24,690 | 1.53 | 557 | 2.58 | ||||
| 2025-08-13 | 13F | Lido Advisors, LLC | 97,198 | -4.58 | 2,191 | -3.69 | ||||
| 2025-07-11 | 13F | Windsor Capital Management, LLC | 12,041 | -3.59 | 271 | -2.52 | ||||
| 2025-08-08 | 13F | Marble Harbor Investment Counsel, LLC | 17,730 | -10.01 | 400 | -9.11 | ||||
| 2025-08-11 | 13F | VSM Wealth Advisory, LLC | 398 | 0.00 | 9 | 0.00 | ||||
| 2025-07-24 | 13F | Robertson Stephens Wealth Management, LLC | 0 | -100.00 | 0 | |||||
| 2025-08-14 | 13F | Wells Fargo & Company/mn | 491,462 | 0.44 | 11,078 | 1.41 | ||||
| 2025-08-06 | 13F | Commonwealth Equity Services, Llc | 384,009 | -1.29 | 9 | 0.00 | ||||
| 2025-08-14 | 13F | Jane Street Group, Llc | 21,816 | -83.08 | 492 | -82.94 | ||||
| 2025-07-28 | 13F | Harbour Investments, Inc. | 570 | 2.15 | 13 | 0.00 | ||||
| 2025-08-14 | 13F | GWM Advisors LLC | 132,171 | -20.80 | 2,979 | -20.03 | ||||
| 2025-08-14 | 13F | Headinvest, Llc | 36,300 | -2.68 | 818 | -1.68 | ||||
| 2025-08-12 | 13F | Landing Point Financial Group, LLC | 22,271 | -51.39 | 502 | -50.98 | ||||
| 2025-07-22 | 13F | BridgePort Financial Solutions, LLC | 61,498 | -1.97 | 1,386 | -1.00 | ||||
| 2025-08-05 | 13F | Sigma Planning Corp | 35,007 | 5.92 | 789 | 7.06 | ||||
| 2025-08-11 | 13F | Principal Securities, Inc. | 902 | 0.00 | 20 | 0.00 | ||||
| 2025-08-15 | 13F | Captrust Financial Advisors | 11,921 | -28.15 | 269 | -27.57 | ||||
| 2025-08-19 | 13F | Advisory Services Network, LLC | 78,384 | 0.20 | 1,763 | 0.97 | ||||
| 2025-07-24 | 13F | Ronald Blue Trust, Inc. | 840 | 1.69 | 19 | 0.00 | ||||
| 2025-07-25 | 13F | Cwm, Llc | 1,840 | -11.62 | 0 | |||||
| 2025-08-11 | 13F | Summit Wealth Partners, LLC | 0 | -100.00 | 0 | |||||
| 2025-08-14 | 13F | Comerica Bank | 4,257 | -1.87 | 96 | -1.04 | ||||
| 2025-08-27 | 13F/A | Brinker Capital Investments, LLC | 54,572 | 6.48 | 1,230 | 7.52 | ||||
| 2025-08-06 | 13F | AE Wealth Management LLC | 37,928 | 5.55 | 855 | 6.48 | ||||
| 2025-07-24 | 13F/A | TFR Capital, LLC. | 11,086 | 250 | ||||||
| 2025-07-25 | 13F | Commonwealth Financial Services, LLC | 342,134 | 0.09 | 7,712 | 1.06 | ||||
| 2025-09-04 | 13F/A | Advisor Group Holdings, Inc. | 799,946 | 908.53 | 18,031 | 918.13 | ||||
| 2025-08-12 | 13F | Global Retirement Partners, LLC | 21,557 | 0.99 | 486 | 2.32 | ||||
| 2025-08-14 | 13F | UBS Group AG | 28,072 | -60.43 | 633 | -60.08 | ||||
| 2025-08-08 | 13F | Avantax Advisory Services, Inc. | 104,281 | 14.37 | 2,351 | 15.48 | ||||
| 2025-07-16 | 13F | Littlejohn Financial Services, Inc. | 12,239 | -9.49 | 276 | -8.64 | ||||
| 2025-08-05 | 13F | Cherry Tree Wealth Management, LLC | 225 | 0.00 | 5 | 0.00 | ||||
| 2025-08-14 | 13F | Fmr Llc | 65 | 1 | ||||||
| 2025-08-06 | 13F | Rialto Wealth Management, LLC | 9,038 | 12.72 | 204 | 13.41 | ||||
| 2025-08-13 | 13F | Beacon Pointe Advisors, LLC | 9,537 | -37.21 | 215 | -36.87 | ||||
| 2025-07-30 | 13F | Mid-American Wealth Advisory Group, Inc. | 1,120 | 25 | ||||||
| 2025-07-16 | 13F | Moisand Fitzgerald Tamayo, LLC | 800 | 0.00 | 18 | 5.88 | ||||
| 2025-08-01 | 13F | Envestnet Asset Management Inc | 13,016 | 293 | ||||||
| 2025-08-07 | 13F | Kestra Private Wealth Services, Llc | 87,051 | 9.05 | 1,962 | 10.10 | ||||
| 2025-07-17 | 13F | Baron Silver Stevens Financial Advisors, Llc | 12,739 | -15.81 | 287 | -14.84 | ||||
| 2025-08-12 | 13F | BlackRock, Inc. | 35,536 | -0.45 | 801 | 0.50 | ||||
| 2025-08-04 | 13F | Spire Wealth Management | 0 | -100.00 | 0 | |||||
| 2025-07-28 | 13F | Mutual Advisors, LLC | 299,434 | 1.72 | 6,733 | 2.61 | ||||
| 2025-08-13 | 13F | Northwestern Mutual Wealth Management Co | 778,916 | 1.06 | 17,557 | 2.03 | ||||
| 2025-05-14 | 13F | Van Hulzen Asset Management, LLC | 0 | -100.00 | 0 | |||||
| 2025-07-14 | 13F | GAMMA Investing LLC | 58,339 | -74.80 | 1,315 | -74.57 | ||||
| 2025-07-29 | 13F | Straight Path Wealth Management | 90,923 | 14.38 | 2,049 | 15.50 | ||||
| 2025-08-14 | 13F | Integrated Wealth Concepts LLC | 56,381 | 1.85 | 1,271 | 2.83 | ||||
| 2025-05-02 | 13F | Whittier Trust Co | 0 | -100.00 | 0 | |||||
| 2025-08-14 | 13F | 10Elms LLP | 4,757 | 0.00 | 107 | 0.94 | ||||
| 2025-07-23 | 13F | Ironwood Financial, llc | 54,159 | 0.00 | 1,209 | 0.00 | ||||
| 2025-08-14 | 13F | Stifel Financial Corp | 12,242 | 29.72 | 276 | 30.95 | ||||
| 2025-07-24 | 13F | IFP Advisors, Inc | 51,682 | -22.51 | 1,165 | -21.77 | ||||
| 2025-05-12 | 13F | C2P Capital Advisory Group, LLC d.b.a. Prosperity Capital Advisors | 0 | -100.00 | 0 | -100.00 | ||||
| 2025-08-26 | 13F/A | Thrivent Financial For Lutherans | 0 | -100.00 | 0 | |||||
| 2025-07-22 | 13F | Penobscot Investment Management Company, Inc. | 39,150 | 882 | ||||||
| 2025-08-01 | 13F | Austin Private Wealth, LLC | 23,347 | 29.52 | 526 | 30.85 | ||||
| 2025-07-31 | 13F | Keeler THomas Management LLC | 429,332 | 15.53 | 9,677 | 16.65 | ||||
| 2025-08-11 | 13F | Private Advisor Group, LLC | 19,173 | 38.76 | 432 | 40.26 | ||||
| 2025-08-08 | 13F | Thoroughbred Financial Services, Llc | 34,883 | -7.24 | 1 | |||||
| 2025-07-10 | 13F | Wealth Enhancement Advisory Services, Llc | 10,851 | 0.00 | 243 | 0.41 | ||||
| 2025-08-12 | 13F | Tableaux Llc | 3,185 | 426 | ||||||
| 2025-08-14 | 13F | EP Wealth Advisors, Inc. | 4,500 | 0.00 | 101 | 1.00 | ||||
| 2025-08-14 | 13F | Old Mission Capital Llc | 17,050 | 9.52 | 384 | 10.66 | ||||
| 2025-07-16 | 13F | Rebalance, Llc | 45,317 | 1.36 | 1,021 | 2.30 | ||||
| 2025-08-12 | 13F | Proequities, Inc. | 0 | 0 | ||||||
| 2025-08-14 | 13F | Bank Of America Corp /de/ | 219,592 | 1.05 | 4,950 | 2.02 | ||||
| 2025-08-06 | 13F | Summit Investment Advisors, Inc. | 97,610 | 8.05 | 2,185 | 8.87 | ||||
| 2025-08-12 | 13F | Boreal Capital Management LLC | 0 | 370 | ||||||
| 2025-05-15 | 13F/A | Orion Portfolio Solutions, LLC | 51,253 | 1,144 | ||||||
| 2025-08-14 | 13F | Hurley Capital, LLC | 27,990 | 261.58 | 631 | 266.28 | ||||
| 2025-06-23 | NP | LDRH - iShares iBonds 1-5 Year High Yield and Income Ladder ETF | 35,697 | 14.29 | 796 | 13.25 | ||||
| 2025-08-15 | 13F | Tower Research Capital LLC (TRC) | 35 | 1 | ||||||
| 2025-07-17 | 13F | Tempus Wealth Planning, LLC | 8,948 | 202 | ||||||
| 2025-08-19 | 13F | Newbridge Financial Services Group, Inc. | 1,580 | 0.00 | 36 | 0.00 | ||||
| 2025-08-12 | 13F | Steward Partners Investment Advisory, Llc | 888 | 20 | ||||||
| 2025-07-25 | 13F | Heartland Bank & Trust Co | 24,753 | 69.66 | 558 | 71.38 | ||||
| 2025-08-08 | 13F | Cetera Investment Advisers | 69,941 | -6.68 | 1,576 | -5.80 | ||||
| 2025-07-23 | 13F | High Note Wealth, LLC | 2,750 | 62 | ||||||
| 2025-04-22 | 13F | M3 Advisory Group, LLC | 0 | -100.00 | 0 | |||||
| 2025-08-12 | 13F | LPL Financial LLC | 406,036 | 44.73 | 9,152 | 46.13 | ||||
| 2025-08-13 | 13F | Baird Financial Group, Inc. | 14,436 | -0.50 | 325 | 0.62 | ||||
| 2025-08-14 | 13F | Royal Bank Of Canada | 50,503 | 5.92 | 1,138 | 6.95 | ||||
| 2025-07-10 | 13F | Klaas Financial Asset Advisors, LLC | 23,746 | -5.59 | 535 | -4.63 | ||||
| 2025-07-15 | 13F | Sightline Wealth Advisors, LLC | 69,284 | 2.37 | 1,562 | 3.38 | ||||
| 2025-08-12 | 13F | Jpmorgan Chase & Co | 2,085 | -20.63 | 47 | -20.69 | ||||
| 2025-08-14 | 13F | Mercer Global Advisors Inc /adv | 10,662 | 240 | ||||||
| 2025-08-11 | 13F | HighTower Advisors, LLC | 359,543 | -26.11 | 8,104 | -25.40 | ||||
| 2025-07-09 | 13F | Lbmc Investment Advisors, Llc | 1,165,621 | 35.99 | 26,273 | 37.30 | ||||
| 2025-07-31 | 13F | Cambridge Investment Research Advisors, Inc. | 62,926 | 6.56 | 1 | 0.00 | ||||
| 2025-07-08 | 13F | Parallel Advisors, LLC | 15,000 | 3.45 | 338 | 4.64 | ||||
| 2025-07-31 | 13F | Orion Capital Management LLC | 11,000 | 48.65 | 248 | 49.70 | ||||
| 2025-08-14 | 13F | Raymond James Financial Inc | 199,177 | 17.03 | 4,489 | 18.16 | ||||
| 2025-07-18 | 13F | Consolidated Portfolio Review Corp | 21,796 | 8.65 | 491 | 9.84 | ||||
| 2025-08-15 | 13F | Morgan Stanley | 239,382 | 56.17 | 5,396 | 57.66 | ||||
| 2025-08-05 | 13F | Bank Of Montreal /can/ | 1,794 | 40 | ||||||
| 2025-08-05 | 13F | Summit Investment Advisory Services, LLC | 93,176 | 2,100 | ||||||
| 2025-08-12 | 13F | J.w. Cole Advisors, Inc. | 187,694 | 4,231 |