Basic Stats
| Institutional Owners | 86 total, 86 long only, 0 short only, 0 long/short - change of 4.88% MRQ |
| Average Portfolio Allocation | 0.2793 % - change of -8.49% MRQ |
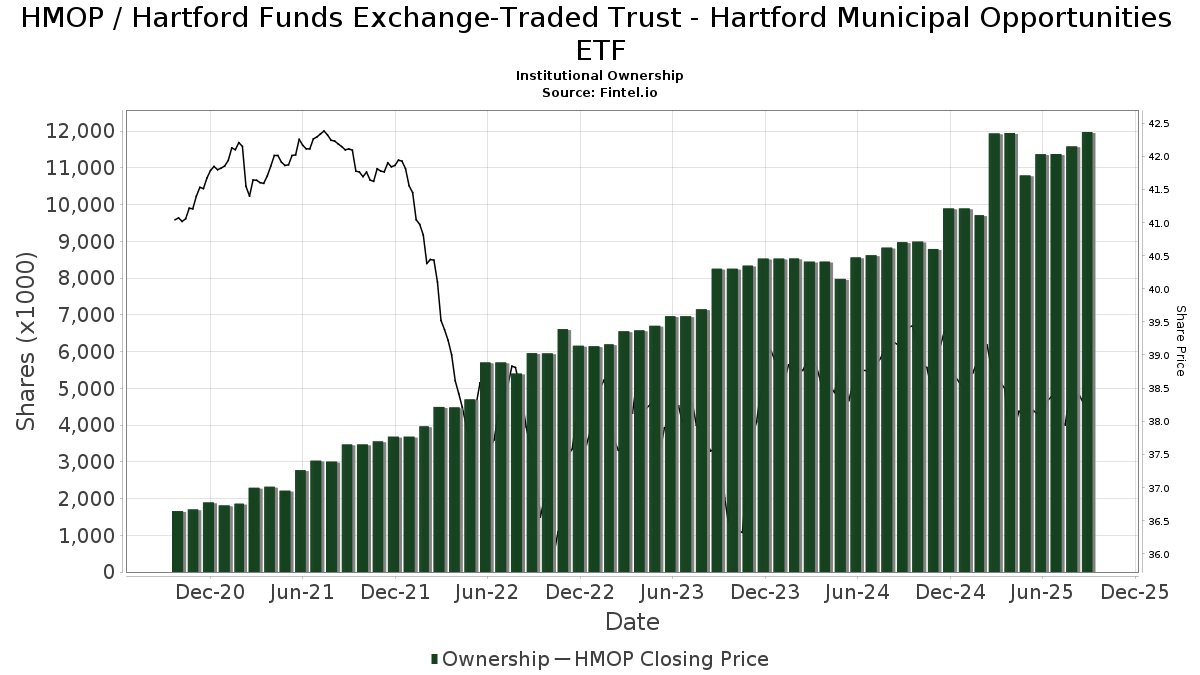
| Institutional Shares (Long) | 11,974,476 (ex 13D/G) - change of 0.60MM shares 5.30% MRQ |
| Institutional Value (Long) | $ 426,979 USD ($1000) |
Institutional Ownership and Shareholders
Hartford Funds Exchange-Traded Trust - Hartford Municipal Opportunities ETF (US:HMOP) has 86 institutional owners and shareholders that have filed 13D/G or 13F forms with the Securities Exchange Commission (SEC). These institutions hold a total of 11,974,476 shares. Largest shareholders include Northwestern Mutual Wealth Management Co, HighTower Advisors, LLC, Raymond James Financial Inc, Bank Of America Corp /de/, Steward Partners Investment Advisory, Llc, LPL Financial LLC, Goldstein Advisors, LLC, Legacy Wealth Management, Inc, Apollon Wealth Management, LLC, and Colony Group, LLC .
Hartford Funds Exchange-Traded Trust - Hartford Municipal Opportunities ETF (ARCA:HMOP) institutional ownership structure shows current positions in the company by institutions and funds, as well as latest changes in position size. Major shareholders can include individual investors, mutual funds, hedge funds, or institutions. The Schedule 13D indicates that the investor holds (or held) more than 5% of the company and intends (or intended) to actively pursue a change in business strategy. Schedule 13G indicates a passive investment of over 5%.
The share price as of September 5, 2025 is 38.57 / share. Previously, on September 9, 2024, the share price was 39.26 / share. This represents a decline of 1.76% over that period.
Fund Sentiment Score
The Fund Sentiment Score (fka Ownership Accumulation Score) finds the stocks that are being most bought by funds. It is the result of a sophisticated, multi-factor quantitative model that identifies companies with the highest levels of institutional accumulation. The scoring model uses a combination of the total increase in disclosed owners, the changes in portfolio allocations in those owners and other metrics. The number ranges from 0 to 100, with higher numbers indicating a higher level of accumulation to its peers, and 50 being the average.
Update Frequency: Daily
See Ownership Explorer, which provides a list of highest-ranking companies.
Institutional Put/Call Ratio
In addition to reporting standard equity and debt issues, institutions with more than 100MM assets under management must also disclose their put and call option holdings. Since put options generally indicate negative sentiment, and call options indicate positive sentiment, we can get a sense of the overall institutional sentiment by plotting the ratio of puts to calls. The chart to the right plots the historical put/call ratio for this instrument.
Using Put/Call Ratio as an indicator of investor sentiment overcomes one of the key deficiencies of using total institutional ownership, which is that a significant amount of assets under management are invested passively to track indices. Passively-managed funds do not typically buy options, so the put/call ratio indicator more closely tracks the sentiment of actively-managed funds.
13F and NPORT Filings
Detail on 13F filings are free. Detail on NP filings require a premium membership. Green rows indicate new positions. Red rows indicate closed positions. Click the link icon to see the full transaction history.
Upgrade
to unlock premium data and export to Excel ![]() .
.
| File Date | Source | Investor | Type | Avg Price (Est) |
Shares | Δ Shares (%) |
Reported Value ($1000) |
Δ Value (%) |
Port Alloc (%) |
|
|---|---|---|---|---|---|---|---|---|---|---|
| 2025-07-08 | 13F | Richard P Slaughter Associates Inc | 35,827 | 159.58 | 1,371 | 158.68 | ||||
| 2025-04-15 | 13F | Central Valley Advisors, Llc | 0 | -100.00 | 0 | |||||
| 2025-07-28 | 13F | Naviter Wealth, LLC | 0 | -100.00 | 0 | |||||
| 2025-08-01 | 13F | Envestnet Asset Management Inc | 139,916 | 39.53 | 5,356 | 38.91 | ||||
| 2025-08-04 | 13F | Amplius Wealth Advisors, LLC | 25,055 | -29.28 | 959 | -29.59 | ||||
| 2025-08-12 | 13F | OneAscent Financial Services LLC | 8,422 | 0.00 | 0 | |||||
| 2025-08-12 | 13F | Putnam Fl Investment Management Co | 5,601 | 0.00 | 214 | -0.47 | ||||
| 2025-08-11 | 13F | Avantax Planning Partners, Inc. | 157,679 | 563.21 | 6,036 | 560.28 | ||||
| 2025-08-05 | 13F | Sigma Planning Corp | 14,190 | 53.31 | 543 | 52.96 | ||||
| 2025-07-18 | 13F | Vicus Capital | 10,813 | -11.59 | 414 | -12.13 | ||||
| 2025-08-14 | 13F | Abound Financial, Llc | 0 | -100.00 | 0 | |||||
| 2025-07-31 | 13F | West Michigan Advisors, Llc | 5,856 | -2.04 | 225 | -2.61 | ||||
| 2025-08-14 | 13F | Comerica Bank | 3,802 | -58.00 | 146 | -58.33 | ||||
| 2025-08-14 | 13F | UBS Group AG | 282 | 11 | ||||||
| 2025-07-01 | 13F | Stonehearth Capital Management, LLC | 27,120 | 14.01 | 1,038 | 13.57 | ||||
| 2025-07-17 | 13F | Fifth Third Securities, Inc. | 33,266 | 32.61 | 1,273 | 32.05 | ||||
| 2025-08-07 | 13F | Verus Capital Partners, Llc | 9,498 | 364 | ||||||
| 2025-08-12 | 13F | RiverFront Investment Group, LLC | 81,341 | 14.24 | 3,114 | 13.74 | ||||
| 2025-07-25 | 13F | Landmark Wealth Management, LLC | 58,517 | -1.09 | 2 | 0.00 | ||||
| 2025-07-30 | 13F | Retirement Planning Group | 49,381 | 310.14 | 1,890 | 309.09 | ||||
| 2025-08-08 | 13F | Avantax Advisory Services, Inc. | 67,049 | -3.03 | 2,567 | -3.46 | ||||
| 2025-08-01 | 13F/A | GGM Financials LLC | 92,069 | 461.50 | 3,524 | 459.37 | ||||
| 2025-08-13 | 13F | Cresset Asset Management, LLC | 0 | -100.00 | 0 | |||||
| 2025-07-14 | 13F | Friday Financial | 6,443 | 0.00 | 247 | -0.40 | ||||
| 2025-08-12 | 13F | J.w. Cole Advisors, Inc. | 39,675 | 1,519 | ||||||
| 2025-04-24 | 13F | Legacy CG, LLC | 0 | -100.00 | 0 | -100.00 | ||||
| 2025-07-17 | 13F | HB Wealth Management, LLC | 5,645 | -11.52 | 216 | -11.84 | ||||
| 2025-08-12 | 13F | Steward Partners Investment Advisory, Llc | 721,130 | 2.62 | 27,605 | 2.17 | ||||
| 2025-07-21 | 13F | Sterling Investment Counsel, LLC | 40,701 | -75.08 | 1,558 | -75.18 | ||||
| 2025-08-07 | 13F | Donaldson Capital Management, Llc | 19,138 | 0.00 | 733 | -0.41 | ||||
| 2025-07-16 | 13F | Magnus Financial Group LLC | 31,762 | -3.24 | 1,216 | -3.72 | ||||
| 2025-07-09 | 13F | Thrive Wealth Management, LLC | 46,227 | 78.81 | 1,770 | 77.97 | ||||
| 2025-07-22 | 13F | Wealthcare Advisory Partners LLC | 159,290 | -40.52 | 6,098 | -40.78 | ||||
| 2025-07-29 | 13F | Stratos Wealth Partners, LTD. | 25,707 | 6.30 | 984 | 5.92 | ||||
| 2025-08-13 | 13F | Jones Financial Companies Lllp | 91,943 | 77.17 | 3,517 | 76.59 | ||||
| 2025-07-17 | 13F | Janney Montgomery Scott LLC | 149,650 | 2.51 | 6 | 0.00 | ||||
| 2025-07-17 | 13F | Johnson & White Wealth Management, LLC | 215,286 | 5.60 | 8 | 14.29 | ||||
| 2025-08-11 | 13F | Private Advisor Group, LLC | 30,978 | 78.28 | 1,186 | 77.40 | ||||
| 2025-08-12 | 13F | LPL Financial LLC | 546,833 | 45.96 | 20,933 | 45.32 | ||||
| 2025-07-17 | 13F | Montis Financial, LLC | 110,161 | -27.08 | 4,217 | -27.41 | ||||
| 2025-08-14 | 13F | Bank Of America Corp /de/ | 790,665 | 8.33 | 30,267 | 7.85 | ||||
| 2025-07-29 | 13F | Madison Wealth Partners, Inc | 7,411 | 0.00 | 284 | -0.35 | ||||
| 2025-07-22 | 13F | Strid Group, LLC | 89,403 | 1.28 | 3,422 | 0.85 | ||||
| 2025-08-14 | 13F | GWM Advisors LLC | 48,748 | -8.65 | 1,866 | -9.02 | ||||
| 2025-07-14 | 13F | Armstrong Advisory Group, Inc | 10,500 | 0.00 | 402 | -0.99 | ||||
| 2025-08-12 | 13F | Cornerstone Wealth Management, LLC | 36,549 | 18.03 | 1,399 | 17.56 | ||||
| 2025-07-31 | 13F | Cambridge Investment Research Advisors, Inc. | 32,214 | 3.39 | 1 | 0.00 | ||||
| 2025-07-17 | 13F | ERn Financial, LLC | 205,122 | -1.26 | 7,852 | -1.69 | ||||
| 2025-07-29 | 13F | Consilio Wealth Advisors, Llc | 115,349 | -6.36 | 4,412 | -6.84 | ||||
| 2025-05-15 | 13F | Creative Planning | 0 | -100.00 | 0 | |||||
| 2025-07-29 | 13F | Crux Wealth Advisors | 73,411 | -2.51 | 2,810 | -2.94 | ||||
| 2025-08-13 | 13F | Northwestern Mutual Wealth Management Co | 1,513,178 | 22.31 | 57,924 | 21.77 | ||||
| 2025-08-15 | 13F | Captrust Financial Advisors | 30,537 | -39.33 | 1,169 | -39.64 | ||||
| 2025-08-12 | 13F | Proequities, Inc. | 0 | 0 | ||||||
| 2025-08-15 | 13F | Kestra Advisory Services, LLC | 116,443 | -25.49 | 4,457 | -25.83 | ||||
| 2025-07-30 | 13F | Bleakley Financial Group, LLC | 32,895 | -35.69 | 1,259 | -35.96 | ||||
| 2025-08-13 | 13F | Sepio Capital, LP | 109,274 | -1.63 | 4,183 | -2.06 | ||||
| 2025-08-14 | 13F | Mariner, LLC | 128,551 | -2.92 | 4,921 | -3.36 | ||||
| 2025-07-14 | 13F | GAMMA Investing LLC | 28,917 | -21.71 | 1,107 | -22.11 | ||||
| 2025-07-29 | 13F | Goldstein Advisors, LLC | 505,155 | -5.99 | 19,337 | -6.41 | ||||
| 2025-08-14 | 13F | Jane Street Group, Llc | 51,923 | 25.10 | 1,988 | 24.58 | ||||
| 2025-08-04 | 13F | Pensionmark Financial Group, Llc | 94,893 | -29.17 | 3,633 | -29.49 | ||||
| 2025-07-15 | 13F | Signet Financial Management, Llc | 21,953 | -11.32 | 840 | -11.67 | ||||
| 2025-07-31 | 13F | Buckingham Strategic Partners | 9,291 | -0.04 | 356 | -0.56 | ||||
| 2025-08-14 | 13F | Colony Group, LLC | 369,887 | 2.14 | 14,159 | 1.69 | ||||
| 2025-05-15 | 13F | Tower Research Capital LLC (TRC) | 0 | -100.00 | 0 | |||||
| 2025-08-13 | 13F | Bernardo Wealth Planning LLC | 121,210 | -7.15 | 5 | -20.00 | ||||
| 2025-07-14 | 13F | Masso Torrence Wealth Management Inc. | 26,390 | 6.67 | 1,010 | 6.20 | ||||
| 2025-08-08 | 13F | Advyzon Investment Management, LLC | 18,764 | -11.98 | 718 | -12.33 | ||||
| 2025-09-04 | 13F/A | Advisor Group Holdings, Inc. | 116,127 | 9.65 | 4,446 | 9.18 | ||||
| 2025-07-30 | 13F | Princeton Global Asset Management LLC | 6,043 | 80.93 | 231 | 80.47 | ||||
| 2025-08-12 | 13F | Argent Trust Co | 8,387 | 321 | ||||||
| 2025-07-17 | 13F | Legacy Wealth Management, Inc | 501,436 | -2.23 | 19,195 | -2.67 | ||||
| 2025-04-30 | 13F | Axxcess Wealth Management, Llc | 0 | -100.00 | 0 | |||||
| 2025-07-25 | 13F | Apollon Financial, LLC | 41,411 | 1,585 | ||||||
| 2025-07-28 | 13F | Cornerstone Wealth Group, LLC | 32,322 | 1,237 | ||||||
| 2025-08-06 | 13F | Commonwealth Equity Services, Llc | 136,533 | -14.33 | 5 | -16.67 | ||||
| 2025-08-14 | 13F | Royal Bank Of Canada | 86,124 | -32.14 | 3,297 | -32.44 | ||||
| 2025-08-06 | 13F | Longview Financial Advisors LLC | 3,030 | 0.00 | 116 | -0.86 | ||||
| 2025-08-14 | 13F | Wells Fargo & Company/mn | 621 | 24 | ||||||
| 2025-04-22 | 13F | Hill Island Financial Llc | 0 | -100.00 | 0 | |||||
| 2025-07-22 | 13F | Merit Financial Group, LLC | 81,514 | -11.13 | 3,120 | -11.51 | ||||
| 2025-08-11 | 13F | HighTower Advisors, LLC | 1,358,488 | -18.12 | 52,003 | -18.48 | ||||
| 2025-07-25 | 13F | Apollon Wealth Management, LLC | 413,669 | 15,835 | ||||||
| 2025-08-13 | 13F | Flow Traders U.s. Llc | 22,529 | 287.23 | 1 | |||||
| 2025-08-14 | 13F | Old Mission Capital Llc | 14,586 | 558 | ||||||
| 2025-07-18 | 13F | Truist Financial Corp | 0 | -100.00 | 0 | |||||
| 2025-08-05 | 13F | Westside Investment Management, Inc. | 27,679 | -9.42 | 1,060 | -9.87 | ||||
| 2025-08-12 | 13F | Jpmorgan Chase & Co | 100,724 | 39.67 | 3,856 | 39.07 | ||||
| 2025-08-15 | 13F | Morgan Stanley | 882 | 3.16 | 34 | 3.13 | ||||
| 2025-08-08 | 13F | Cetera Investment Advisers | 70,535 | -2.17 | 2,700 | -2.60 | ||||
| 2025-05-12 | 13F | Fmr Llc | 0 | -100.00 | 0 | |||||
| 2025-08-13 | 13F | Capital Analysts, Inc. | 18,226 | 0.09 | 1 | |||||
| 2025-07-28 | 13F | Harbour Investments, Inc. | 4,442 | 3.04 | 170 | 3.03 | ||||
| 2025-08-14 | 13F | Raymond James Financial Inc | 1,186,316 | 3.66 | 45,412 | 3.20 | ||||
| 2025-08-04 | 13F | Savvy Advisors, Inc. | 23,817 | 912 | ||||||
| 2025-07-14 | 13F | AdvisorNet Financial, Inc | 6,759 | 0.06 | 259 | -0.39 | ||||
| 2025-08-14 | 13F | Mml Investors Services, Llc | 57,390 | 4.80 | 2 | 0.00 |