Basic Stats
| Institutional Owners | 37 total, 37 long only, 0 short only, 0 long/short - change of 19.35% MRQ |
| Average Portfolio Allocation | 0.4436 % - change of -19.99% MRQ |
| Institutional Shares (Long) | 5,722,920 (ex 13D/G) - change of 0.43MM shares 8.17% MRQ |
| Institutional Value (Long) | $ 78,217 USD ($1000) |
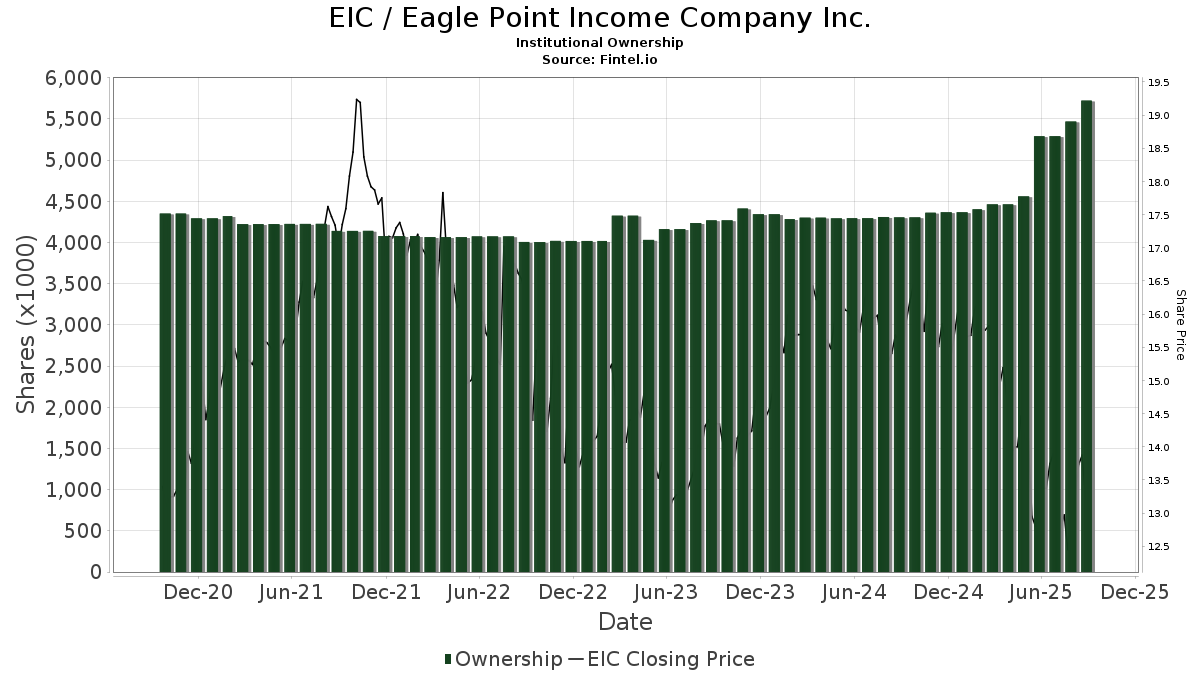
Institutional Ownership and Shareholders
Eagle Point Income Company Inc. (US:EIC) has 37 institutional owners and shareholders that have filed 13D/G or 13F forms with the Securities Exchange Commission (SEC). These institutions hold a total of 5,722,920 shares. Largest shareholders include Enstar Group LTD, Baillie Gifford & Co, Morgan Stanley, Graypoint LLC, Whipplewood Advisors, LLC, Envestnet Asset Management Inc, Principal Securities, Inc., UBS Group AG, Rsm Us Wealth Management Llc, and Mariner, LLC .
Eagle Point Income Company Inc. (NYSE:EIC) institutional ownership structure shows current positions in the company by institutions and funds, as well as latest changes in position size. Major shareholders can include individual investors, mutual funds, hedge funds, or institutions. The Schedule 13D indicates that the investor holds (or held) more than 5% of the company and intends (or intended) to actively pursue a change in business strategy. Schedule 13G indicates a passive investment of over 5%.
The share price as of September 5, 2025 is 13.78 / share. Previously, on September 9, 2024, the share price was 15.94 / share. This represents a decline of 13.55% over that period.
Fund Sentiment Score
The Fund Sentiment Score (fka Ownership Accumulation Score) finds the stocks that are being most bought by funds. It is the result of a sophisticated, multi-factor quantitative model that identifies companies with the highest levels of institutional accumulation. The scoring model uses a combination of the total increase in disclosed owners, the changes in portfolio allocations in those owners and other metrics. The number ranges from 0 to 100, with higher numbers indicating a higher level of accumulation to its peers, and 50 being the average.
Update Frequency: Daily
See Ownership Explorer, which provides a list of highest-ranking companies.
Institutional Put/Call Ratio
In addition to reporting standard equity and debt issues, institutions with more than 100MM assets under management must also disclose their put and call option holdings. Since put options generally indicate negative sentiment, and call options indicate positive sentiment, we can get a sense of the overall institutional sentiment by plotting the ratio of puts to calls. The chart to the right plots the historical put/call ratio for this instrument.
Using Put/Call Ratio as an indicator of investor sentiment overcomes one of the key deficiencies of using total institutional ownership, which is that a significant amount of assets under management are invested passively to track indices. Passively-managed funds do not typically buy options, so the put/call ratio indicator more closely tracks the sentiment of actively-managed funds.
13F and NPORT Filings
Detail on 13F filings are free. Detail on NP filings require a premium membership. Green rows indicate new positions. Red rows indicate closed positions. Click the link icon to see the full transaction history.
Upgrade
to unlock premium data and export to Excel ![]() .
.
| File Date | Source | Investor | Type | Avg Price (Est) |
Shares | Δ Shares (%) |
Reported Value ($1000) |
Δ Value (%) |
Port Alloc (%) |
|
|---|---|---|---|---|---|---|---|---|---|---|
| 2025-05-15 | 13F | Royal Bank Of Canada | 0 | -100.00 | 0 | |||||
| 2025-08-13 | 13F | Thomas J. Herzfeld Advisors, Inc. | 23,784 | 325 | ||||||
| 2025-08-07 | 13F | Parkside Financial Bank & Trust | 0 | -100.00 | 0 | |||||
| 2025-08-14 | 13F | Comerica Bank | 55 | 1 | ||||||
| 2025-05-12 | 13F | Virtu Financial LLC | 0 | -100.00 | 0 | |||||
| 2025-08-11 | 13F | Pin Oak Investment Advisors Inc | 50 | 0.00 | 0 | |||||
| 2025-08-14 | 13F | SWAN Capital LLC | 100 | 0.00 | 1 | 0.00 | ||||
| 2025-08-14 | 13F | Mariner, LLC | 68,729 | 83.36 | 940 | 67.68 | ||||
| 2025-07-23 | 13F | Friedenthal Financial | 5,744 | 79 | ||||||
| 2025-08-14 | 13F | Wells Fargo & Company/mn | 1 | 0.00 | 0 | |||||
| 2025-05-14 | 13F | Northwestern Mutual Wealth Management Co | 0 | -100.00 | 0 | |||||
| 2025-05-05 | 13F | Lindbrook Capital, Llc | 2,400 | 20.00 | 36 | 12.90 | ||||
| 2025-08-14 | 13F | Susquehanna International Group, Llp | 14,043 | 192 | ||||||
| 2025-08-13 | 13F | M&t Bank Corp | 11,726 | 0.00 | 160 | -8.57 | ||||
| 2025-07-28 | 13F | Naviter Wealth, LLC | 10,500 | -10.61 | 144 | -19.66 | ||||
| 2025-08-18 | 13F | Geneos Wealth Management Inc. | 572 | 8 | ||||||
| 2025-08-05 | 13F | Verity Asset Management, Inc. | 37,890 | -50.69 | 518 | -54.97 | ||||
| 2025-08-12 | 13F | TCTC Holdings, LLC | 2,600 | 36 | ||||||
| 2025-09-04 | 13F/A | Advisor Group Holdings, Inc. | 5,759 | 0.44 | 79 | -8.24 | ||||
| 2025-08-05 | 13F | Bard Associates Inc | 0 | -100.00 | 0 | -100.00 | ||||
| 2025-08-13 | 13F | Rsm Us Wealth Management Llc | 70,498 | 0.22 | 964 | -8.37 | ||||
| 2025-08-06 | 13F | Wedbush Securities Inc | 0 | -100.00 | 0 | |||||
| 2025-08-14 | 13F | Enstar Group LTD | 3,819,656 | 1.46 | 52,215 | -7.22 | ||||
| 2025-08-14 | 13F | Raymond James Financial Inc | 46,770 | 0.72 | 639 | -7.93 | ||||
| 2025-08-14 | 13F | UBS Group AG | 82,007 | 447.11 | 1,121 | 400.45 | ||||
| 2025-05-13 | 13F | Cresset Asset Management, LLC | 0 | -100.00 | 0 | |||||
| 2025-07-16 | 13F | Diversified Enterprises, LLC | 21,970 | 0.00 | 300 | -8.54 | ||||
| 2025-08-11 | 13F | WPG Advisers, LLC | 243 | 3 | ||||||
| 2025-07-08 | 13F | Webster Bank, N. A. | 2,739 | 0.00 | 37 | -7.50 | ||||
| 2025-08-06 | 13F | Baillie Gifford & Co | 553,305 | -2.85 | 7,564 | -11.17 | ||||
| 2025-04-21 | 13F | Nelson, Van Denburg & Campbell Wealth Management Group, LLC | 0 | -100.00 | 0 | |||||
| 2025-08-08 | 13F | Cetera Investment Advisers | 14,369 | 17.79 | 196 | 7.69 | ||||
| 2025-08-01 | 13F | Envestnet Asset Management Inc | 99,584 | 2.84 | 1,361 | -5.94 | ||||
| 2025-07-14 | 13F | AdvisorNet Financial, Inc | 3,322 | 97.39 | 45 | 80.00 | ||||
| 2025-07-15 | 13F | Ballentine Partners, LLC | 24,650 | 96.59 | 337 | 79.68 | ||||
| 2025-08-12 | 13F | LPL Financial LLC | 22,454 | -32.81 | 307 | -38.68 | ||||
| 2025-07-15 | 13F | Graypoint LLC | 208,652 | 3.86 | 2,852 | -5.03 | ||||
| 2025-07-25 | 13F | Atria Wealth Solutions, Inc. | 0 | -100.00 | 0 | |||||
| 2025-08-15 | 13F | Morgan Stanley | 267,827 | 344.14 | 3,661 | 306.33 | ||||
| 2025-07-31 | 13F | Whipplewood Advisors, LLC | 160,870 | 2,199 | ||||||
| 2025-08-12 | 13F | BlackRock, Inc. | 16,597 | 227 | ||||||
| 2025-08-13 | 13F | EverSource Wealth Advisors, LLC | 1,070 | 15 | ||||||
| 2025-08-14 | 13F | Federation des caisses Desjardins du Quebec | 12,300 | 0.00 | 168 | -8.20 | ||||
| 2025-08-11 | 13F | Principal Securities, Inc. | 99,584 | 15.97 | 1,361 | 2.02 | ||||
| 2025-08-13 | 13F | Transce3nd, LLC | 0 | -100.00 | 0 | |||||
| 2025-08-14 | 13F | CoreCap Advisors, LLC | 8,500 | 116 | ||||||
| 2025-08-18 | 13F | N.E.W. Advisory Services LLC | 2,000 | 0.00 | 27 | -6.90 | ||||
| 2025-08-12 | 13F | Proequities, Inc. | 0 | 0 |