Basic Stats
| Institutional Owners | 39 total, 39 long only, 0 short only, 0 long/short - change of 5.41% MRQ |
| Average Portfolio Allocation | 0.0391 % - change of -17.90% MRQ |
| Institutional Shares (Long) | 2,263,238 (ex 13D/G) - change of 0.13MM shares 5.99% MRQ |
| Institutional Value (Long) | $ 26,266 USD ($1000) |
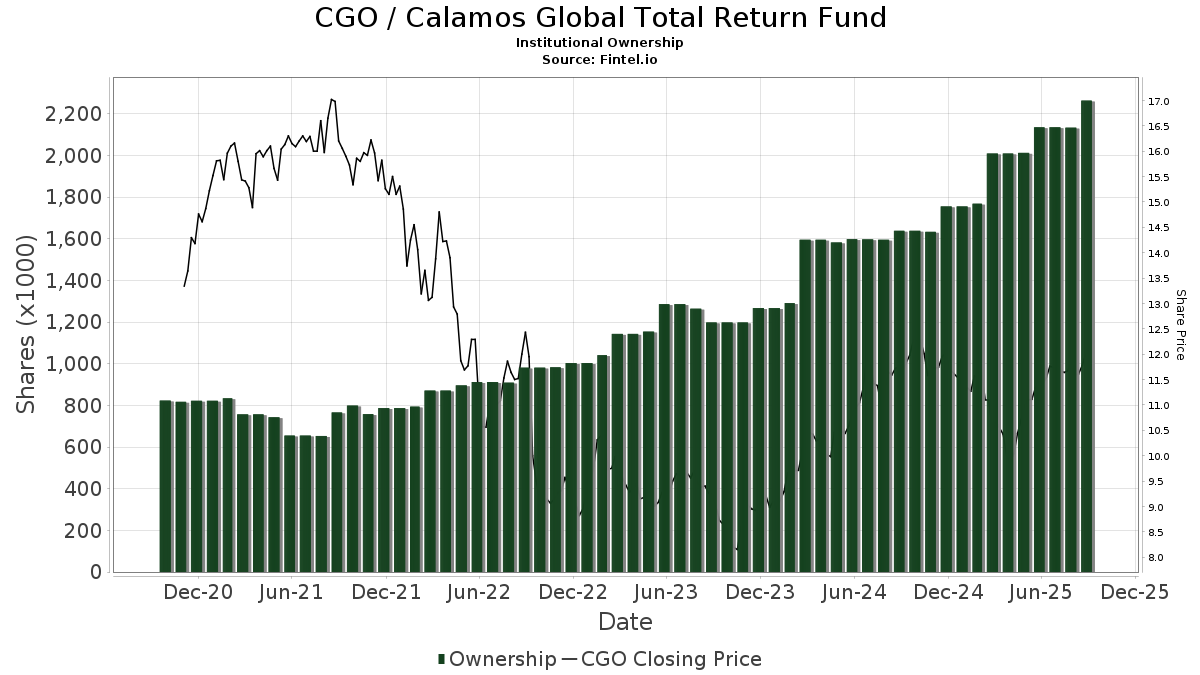
Institutional Ownership and Shareholders
Calamos Global Total Return Fund (US:CGO) has 39 institutional owners and shareholders that have filed 13D/G or 13F forms with the Securities Exchange Commission (SEC). These institutions hold a total of 2,263,238 shares. Largest shareholders include Morgan Stanley, LPL Financial LLC, Guggenheim Capital Llc, Principal Securities, Inc., Envestnet Asset Management Inc, Shaker Financial Services, LLC, Calamos Wealth Management LLC, Advisors Asset Management, Inc., UBS Group AG, and Wolverine Asset Management Llc .
Calamos Global Total Return Fund (NasdaqGS:CGO) institutional ownership structure shows current positions in the company by institutions and funds, as well as latest changes in position size. Major shareholders can include individual investors, mutual funds, hedge funds, or institutions. The Schedule 13D indicates that the investor holds (or held) more than 5% of the company and intends (or intended) to actively pursue a change in business strategy. Schedule 13G indicates a passive investment of over 5%.
The share price as of September 4, 2025 is 11.86 / share. Previously, on September 5, 2024, the share price was 11.68 / share. This represents an increase of 1.54% over that period.
Fund Sentiment Score
The Fund Sentiment Score (fka Ownership Accumulation Score) finds the stocks that are being most bought by funds. It is the result of a sophisticated, multi-factor quantitative model that identifies companies with the highest levels of institutional accumulation. The scoring model uses a combination of the total increase in disclosed owners, the changes in portfolio allocations in those owners and other metrics. The number ranges from 0 to 100, with higher numbers indicating a higher level of accumulation to its peers, and 50 being the average.
Update Frequency: Daily
See Ownership Explorer, which provides a list of highest-ranking companies.
Institutional Put/Call Ratio
In addition to reporting standard equity and debt issues, institutions with more than 100MM assets under management must also disclose their put and call option holdings. Since put options generally indicate negative sentiment, and call options indicate positive sentiment, we can get a sense of the overall institutional sentiment by plotting the ratio of puts to calls. The chart to the right plots the historical put/call ratio for this instrument.
Using Put/Call Ratio as an indicator of investor sentiment overcomes one of the key deficiencies of using total institutional ownership, which is that a significant amount of assets under management are invested passively to track indices. Passively-managed funds do not typically buy options, so the put/call ratio indicator more closely tracks the sentiment of actively-managed funds.
13F and NPORT Filings
Detail on 13F filings are free. Detail on NP filings require a premium membership. Green rows indicate new positions. Red rows indicate closed positions. Click the link icon to see the full transaction history.
Upgrade
to unlock premium data and export to Excel ![]() .
.
| File Date | Source | Investor | Type | Avg Price (Est) |
Shares | Δ Shares (%) |
Reported Value ($1000) |
Δ Value (%) |
Port Alloc (%) |
|
|---|---|---|---|---|---|---|---|---|---|---|
| 2025-08-14 | 13F | Wells Fargo & Company/mn | 6,040 | 42.99 | 71 | 62.79 | ||||
| 2025-05-12 | 13F | Fmr Llc | 0 | -100.00 | 0 | |||||
| 2025-07-28 | 13F | Harbour Investments, Inc. | 52,714 | -5.94 | 617 | 6.75 | ||||
| 2025-08-14 | 13F | Raymond James Financial Inc | 23,275 | -8.83 | 273 | 3.42 | ||||
| 2025-07-29 | 13F | Calamos Wealth Management LLC | 110,242 | 0.00 | 1,291 | 13.36 | ||||
| 2025-08-15 | 13F | Kestra Advisory Services, LLC | 22,750 | 22.60 | 266 | 39.27 | ||||
| 2025-07-08 | 13F | Nbc Securities, Inc. | 4,524 | 0.00 | 0 | |||||
| 2025-08-15 | 13F | Morgan Stanley | 399,607 | 6.63 | 4,679 | 20.87 | ||||
| 2025-08-12 | 13F | Proequities, Inc. | 0 | 0 | ||||||
| 2025-08-13 | 13F | Guggenheim Capital Llc | 185,568 | -8.76 | 2,173 | 3.43 | ||||
| 2025-07-24 | 13F | Gilliland Jeter Wealth Management LLC | 20,576 | 0.00 | 241 | 13.21 | ||||
| 2025-08-06 | 13F | Golden State Wealth Management, LLC | 52 | -98.46 | 1 | -100.00 | ||||
| 2025-08-12 | 13F | LPL Financial LLC | 241,837 | 4.34 | 2,832 | 18.25 | ||||
| 2025-08-01 | 13F | Envestnet Asset Management Inc | 161,024 | 2.63 | 1,886 | 16.36 | ||||
| 2025-08-12 | 13F | Advisors Asset Management, Inc. | 101,748 | 355.86 | 1,191 | 417.83 | ||||
| 2025-08-05 | 13F | Huntington National Bank | 1 | 0.00 | 0 | |||||
| 2025-08-07 | 13F | Allworth Financial LP | 7,001 | 82 | ||||||
| 2025-08-11 | 13F | Principal Securities, Inc. | 179,121 | 1.55 | 2,098 | 4.38 | ||||
| 2025-08-14 | 13F | Bank Of America Corp /de/ | 36,561 | -1.03 | 428 | 12.34 | ||||
| 2025-09-04 | 13F/A | Advisor Group Holdings, Inc. | 16,896 | 64.58 | 198 | 85.85 | ||||
| 2025-08-14 | 13F | CoreCap Advisors, LLC | 13,127 | 1.53 | 154 | 15.04 | ||||
| 2025-08-05 | 13F | GPS Wealth Strategies Group, LLC | 1,650 | 0.00 | 19 | 11.76 | ||||
| 2025-08-14 | 13F | UBS Group AG | 93,852 | 0.50 | 1,099 | 14.00 | ||||
| 2025-08-05 | 13F | Bard Associates Inc | 14,225 | 0.00 | 167 | 13.70 | ||||
| 2025-08-13 | 13F | Invesco Ltd. | 70,604 | -18.03 | 827 | -7.09 | ||||
| 2025-08-12 | 13F | Steward Partners Investment Advisory, Llc | 9,365 | 0.00 | 110 | 13.54 | ||||
| 2025-07-16 | 13F | ORG Partners LLC | 1,500 | 0.00 | 18 | 13.33 | ||||
| 2025-08-14 | 13F | GWM Advisors LLC | 16,200 | -3.57 | 190 | 9.25 | ||||
| 2025-07-29 | 13F | Mb, Levis & Associates, Llc | 1,982 | 2.16 | 23 | 21.05 | ||||
| 2025-07-31 | 13F | Cambridge Investment Research Advisors, Inc. | 12,270 | -5.75 | 0 | |||||
| 2025-08-04 | 13F | Prairie Wealth Advisors, Inc. | 86,925 | 4.01 | 1,018 | 17.84 | ||||
| 2025-07-21 | 13F | Ameriflex Group, Inc. | 0 | -100.00 | 0 | |||||
| 2025-08-05 | 13F | Shaker Financial Services, LLC | 159,279 | -20.27 | 1,865 | -9.60 | ||||
| 2025-08-14 | 13F | Comerica Bank | 5,643 | 0.00 | 66 | 13.79 | ||||
| 2025-08-19 | 13F | Newbridge Financial Services Group, Inc. | 608 | 7 | ||||||
| 2025-07-30 | 13F | Brookstone Capital Management | 39,634 | 10.38 | 464 | 25.41 | ||||
| 2025-07-25 | 13F | Cwm, Llc | 1,905 | 0.00 | 0 | |||||
| 2025-07-02 | 13F | Capital Market Strategies LLC | 11,168 | -32.55 | 131 | -23.98 | ||||
| 2025-08-14 | 13F | Susquehanna International Group, Llp | 15,607 | 183 | ||||||
| 2025-08-14 | 13F | Royal Bank Of Canada | 28,177 | 104.05 | 330 | 130.77 | ||||
| 2025-08-14 | 13F | Stifel Financial Corp | 18,791 | 220 | ||||||
| 2025-08-04 | 13F | Wolverine Asset Management Llc | 91,189 | 36.40 | 1,068 | 54.64 | ||||
| 2025-08-14 | 13F | Ariadne Wealth Management, LP | 0 | -100.00 | 0 |