Basic Stats
| Institutional Owners | 123 total, 122 long only, 0 short only, 1 long/short - change of 12.84% MRQ |
| Average Portfolio Allocation | 1.1381 % - change of -6.08% MRQ |
| Institutional Shares (Long) | 24,293,265 (ex 13D/G) - change of -0.56MM shares -2.24% MRQ |
| Institutional Value (Long) | $ 2,867,222 USD ($1000) |
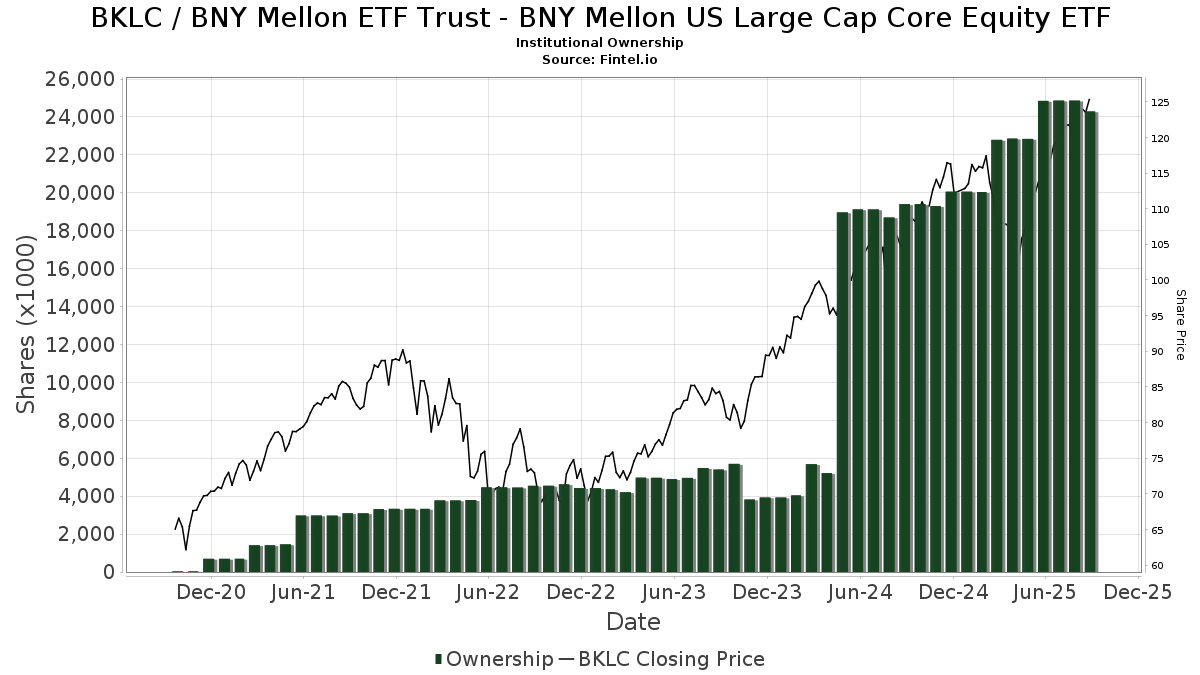
Institutional Ownership and Shareholders
BNY Mellon ETF Trust - BNY Mellon US Large Cap Core Equity ETF (US:BKLC) has 123 institutional owners and shareholders that have filed 13D/G or 13F forms with the Securities Exchange Commission (SEC). These institutions hold a total of 24,293,265 shares. Largest shareholders include RPOA Advisors, Inc., Integrated Wealth Concepts LLC, Bank of New York Mellon Corp, Sentinel Pension Advisors Inc, RAA - SMI 3Fourteen Real Asset Allocation ETF SMI 3Fourteen REAL Asset Allocation ETF, Stadion Money Management, LLC, Toroso Investments, LLC, GM Advisory Group, Inc., Ameriprise Financial Inc, and Northwestern Mutual Wealth Management Co .
BNY Mellon ETF Trust - BNY Mellon US Large Cap Core Equity ETF (ARCA:BKLC) institutional ownership structure shows current positions in the company by institutions and funds, as well as latest changes in position size. Major shareholders can include individual investors, mutual funds, hedge funds, or institutions. The Schedule 13D indicates that the investor holds (or held) more than 5% of the company and intends (or intended) to actively pursue a change in business strategy. Schedule 13G indicates a passive investment of over 5%.
The share price as of September 8, 2025 is 124.58 / share. Previously, on September 9, 2024, the share price was 103.86 / share. This represents an increase of 19.95% over that period.
Fund Sentiment Score
The Fund Sentiment Score (fka Ownership Accumulation Score) finds the stocks that are being most bought by funds. It is the result of a sophisticated, multi-factor quantitative model that identifies companies with the highest levels of institutional accumulation. The scoring model uses a combination of the total increase in disclosed owners, the changes in portfolio allocations in those owners and other metrics. The number ranges from 0 to 100, with higher numbers indicating a higher level of accumulation to its peers, and 50 being the average.
Update Frequency: Daily
See Ownership Explorer, which provides a list of highest-ranking companies.
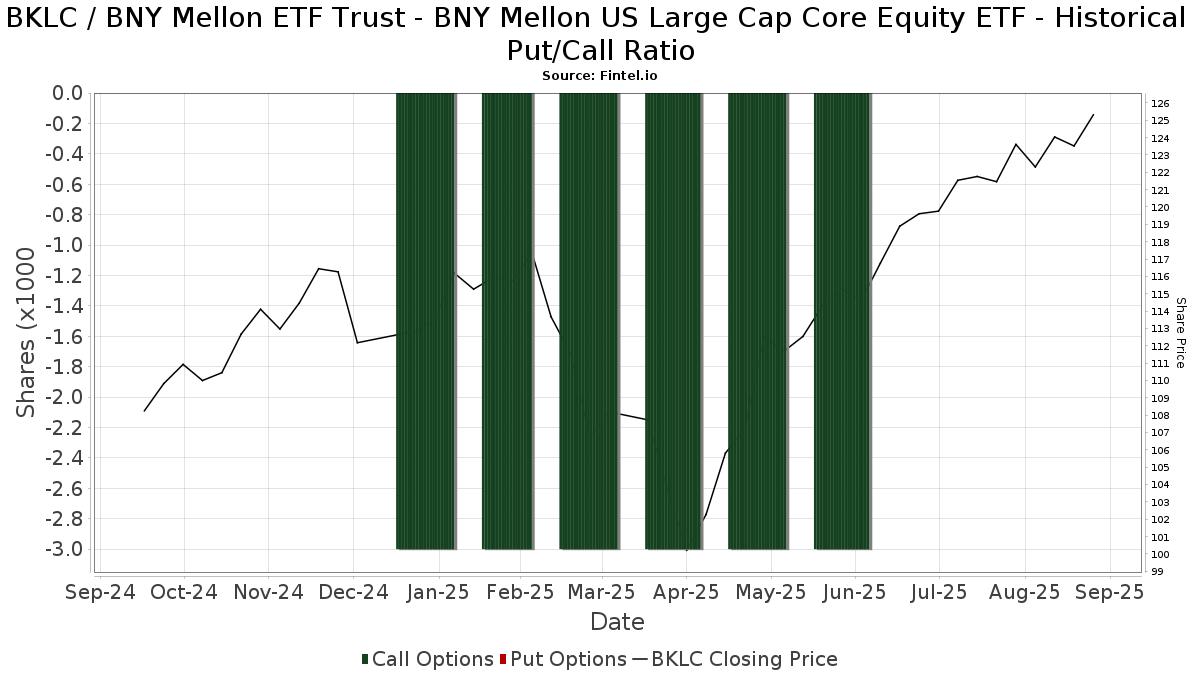
Institutional Put/Call Ratio
In addition to reporting standard equity and debt issues, institutions with more than 100MM assets under management must also disclose their put and call option holdings. Since put options generally indicate negative sentiment, and call options indicate positive sentiment, we can get a sense of the overall institutional sentiment by plotting the ratio of puts to calls. The chart to the right plots the historical put/call ratio for this instrument.
Using Put/Call Ratio as an indicator of investor sentiment overcomes one of the key deficiencies of using total institutional ownership, which is that a significant amount of assets under management are invested passively to track indices. Passively-managed funds do not typically buy options, so the put/call ratio indicator more closely tracks the sentiment of actively-managed funds.
13F and NPORT Filings
Detail on 13F filings are free. Detail on NP filings require a premium membership. Green rows indicate new positions. Red rows indicate closed positions. Click the link icon to see the full transaction history.
Upgrade
to unlock premium data and export to Excel ![]() .
.
| File Date | Source | Investor | Type | Avg Price (Est) |
Shares | Δ Shares (%) |
Reported Value ($1000) |
Δ Value (%) |
Port Alloc (%) |
|
|---|---|---|---|---|---|---|---|---|---|---|
| 2025-08-12 | 13F | Jpmorgan Chase & Co | 112,192 | 539.09 | 13,287 | 612.00 | ||||
| 2025-08-29 | NP | RAA - SMI 3Fourteen Real Asset Allocation ETF SMI 3Fourteen REAL Asset Allocation ETF | 808,422 | 8.01 | 95,741 | 20.32 | ||||
| 2025-07-09 | 13F | WealthCare Investment Partners, LLC | 2,848 | 0.00 | 342 | 22.22 | ||||
| 2025-08-12 | 13F | Quadcap Wealth Management, LLC | 5,604 | 0.11 | 664 | 11.43 | ||||
| 2025-07-25 | 13F | Concord Wealth Partners | 0 | -100.00 | 0 | |||||
| 2025-08-11 | 13F | Aptus Capital Advisors, LLC | 179,103 | 335.02 | 21,211 | 384.60 | ||||
| 2025-05-05 | 13F | Transce3nd, LLC | 0 | -100.00 | 0 | |||||
| 2025-08-14 | 13F | Mariner, LLC | 2,645 | -45.69 | 313 | -39.46 | ||||
| 2025-07-08 | 13F | Parallel Advisors, LLC | 50 | 0.00 | 6 | 0.00 | ||||
| 2025-08-04 | 13F | Assetmark, Inc | 0 | -100.00 | 0 | |||||
| 2025-08-11 | 13F | CFS Investment Advisory Services, LLC | 0 | -100.00 | 0 | |||||
| 2025-08-13 | 13F | Northwestern Mutual Wealth Management Co | 307,822 | 12.69 | 36,455 | 25.53 | ||||
| 2025-08-14 | 13F | Jane Street Group, Llc | 21,406 | 106.03 | 2,535 | 129.62 | ||||
| 2025-08-18 | 13F | Geneos Wealth Management Inc. | 1,857 | 44.51 | 220 | 61.03 | ||||
| 2025-08-08 | 13F | Cetera Investment Advisers | 56,685 | 4.20 | 6,713 | 16.08 | ||||
| 2025-08-13 | 13F | Capital Analysts, Inc. | 375 | 13.64 | 0 | |||||
| 2025-08-15 | 13F | CI Private Wealth, LLC | 2,482 | -17.46 | 294 | -8.15 | ||||
| 2025-08-05 | 13F | Bank of New York Mellon Corp | 1,798,063 | -40.91 | 212,945 | -34.18 | ||||
| 2025-08-05 | 13F | Bank Of Montreal /can/ | 5,270 | 0.00 | 624 | 11.43 | ||||
| 2025-08-12 | 13F | DiMeo Schneider & Associates, L.L.C. | 2,495 | 0.00 | 295 | 11.32 | ||||
| 2025-08-06 | 13F | Commonwealth Equity Services, Llc | 8,139 | 45.08 | 1 | |||||
| 2025-08-14 | 13F | Susquehanna International Group, Llp | 34,196 | -7.28 | 4,050 | 3.26 | ||||
| 2025-07-29 | 13F | Pinnacle Wealth Management, LLC | 4,983 | -4.65 | 590 | 6.31 | ||||
| 2025-07-16 | 13F | Wealth Group Ltd | 13,534 | 1,603 | ||||||
| 2025-07-23 | 13F | REAP Financial Group, LLC | 760 | 0.00 | 90 | 12.50 | ||||
| 2025-07-10 | 13F | Kmg Fiduciary Partners, Llc | 67,389 | 4.40 | 7,981 | 16.28 | ||||
| 2025-07-24 | 13F | Stiles Financial Services Inc | 27,469 | -22.64 | 3,254 | -13.85 | ||||
| 2025-07-29 | 13F | Crux Wealth Advisors | 60,473 | 113.31 | 7,162 | 137.59 | ||||
| 2025-07-15 | 13F | Define Financial, Llc | 1,703 | 202 | ||||||
| 2025-08-14 | 13F | Goldman Sachs Group Inc | 1,814 | 215 | ||||||
| 2025-08-01 | NP | Advisors Preferred Trust - Dynamic Alpha Macro Fund Institutional Class Shares | 89,643 | 0.00 | 10,616 | 11.40 | ||||
| 2025-08-13 | 13F | Northern Trust Corp | 1,905 | 0.00 | 226 | 11.39 | ||||
| 2025-08-11 | 13F | Goodman Financial Corp | 0 | -100.00 | 0 | |||||
| 2025-08-08 | 13F | Empower Advisory Group, LLC | 2,310 | 274 | ||||||
| 2025-08-15 | 13F | Equitable Holdings, Inc. | 56,607 | 70.43 | 6,704 | 89.83 | ||||
| 2025-08-01 | 13F | Zhang Financial LLC | 305,121 | 8.15 | 36,136 | 20.47 | ||||
| 2025-08-08 | 13F | Compass Wealth Management LLC | 0 | -100.00 | 0 | |||||
| 2025-08-14 | 13F | Raymond James Financial Inc | 4,105 | 3.45 | 486 | 15.44 | ||||
| 2025-07-10 | 13F | Wealth Enhancement Advisory Services, Llc | 2,377 | -96.94 | 285 | -96.55 | ||||
| 2025-05-13 | 13F | Neuberger Berman Group LLC | 0 | -100.00 | 0 | |||||
| 2025-07-21 | 13F | Single Point Partners, LLC | 9,037 | 1 | ||||||
| 2025-08-05 | 13F | Simplex Trading, Llc | 41 | 0 | ||||||
| 2025-07-29 | 13F | BKD Wealth Advisors, LLC | 2,079 | 246 | ||||||
| 2025-07-29 | 13F | Woodard & Co Asset Management Group Inc /adv | 230,107 | 2,868.74 | 27,252 | 3,207.16 | ||||
| 2025-08-11 | 13F | Wealthspire Advisors, LLC | 7,874 | 932 | ||||||
| 2025-04-10 | 13F | Retireful, LLC | 0 | -100.00 | 0 | |||||
| 2025-08-15 | 13F | Lantern Wealth Advisors, LLC | 5,822 | 89.52 | 690 | 100.29 | ||||
| 2025-05-15 | 13F | GWM Advisors LLC | 0 | -100.00 | 0 | |||||
| 2025-08-01 | 13F | Envestnet Asset Management Inc | 74,631 | 62.25 | 8,839 | 80.74 | ||||
| 2025-08-14 | 13F | Integrated Wealth Concepts LLC | 2,427,445 | 11.76 | 287,482 | 24.48 | ||||
| 2025-07-25 | 13F | We Are One Seven, LLC | 132,111 | -10.04 | 15,646 | 0.20 | ||||
| 2025-08-14 | 13F | Ameriprise Financial Inc | 364,511 | 5.38 | 43,169 | 17.38 | ||||
| 2025-08-12 | 13F | Proequities, Inc. | 0 | 0 | ||||||
| 2025-08-14 | 13F | CoreCap Advisors, LLC | 9 | 1 | ||||||
| 2025-04-23 | 13F | Win Advisors, Inc | 0 | -100.00 | 0 | |||||
| 2025-07-25 | 13F | Atria Wealth Solutions, Inc. | 11,060 | -16.11 | 1,327 | -5.35 | ||||
| 2025-08-12 | 13F | LPL Financial LLC | 181,577 | -45.71 | 21,504 | -39.53 | ||||
| 2025-08-14 | 13F | UBS Group AG | 78,070 | 6.25 | 9,246 | 18.36 | ||||
| 2025-08-15 | 13F | Kestra Advisory Services, LLC | 97,978 | -2.46 | 11,604 | 8.65 | ||||
| 2025-08-04 | 13F | Spire Wealth Management | 16 | 0.00 | 2 | 0.00 | ||||
| 2025-08-11 | 13F | FSA Wealth Management LLC | 316 | 37 | ||||||
| 2025-08-14 | 13F | Fort Point Capital Partners LLC | 11,735 | 0.70 | 1,390 | 12.20 | ||||
| 2025-08-13 | 13F | Flow Traders U.s. Llc | 24,868 | 58.26 | 3 | 100.00 | ||||
| 2025-07-14 | 13F | Sowell Financial Services LLC | 2,330 | 0.00 | 276 | 11.34 | ||||
| 2025-08-08 | 13F | Capital Investment Advisory Services, LLC | 3,603 | 34.79 | 427 | 50.00 | ||||
| 2025-07-03 | 13F | Collective Family Office Llc | 11,657 | 8.05 | 1,381 | 20.31 | ||||
| 2025-08-06 | 13F | First Horizon Advisors, Inc. | 364 | -11.86 | 43 | 0.00 | ||||
| 2025-08-13 | 13F | Cerity Partners LLC | 2,443 | -31.01 | 289 | -23.14 | ||||
| 2025-08-13 | 13F | First Trust Advisors Lp | 1,968 | -61.05 | 233 | -56.61 | ||||
| 2025-05-15 | 13F | DZ BANK AG Deutsche Zentral Genossenschafts Bank, Frankfurt am Main | 0 | -100.00 | 0 | |||||
| 2025-06-27 | NP | DUBS - Aptus Large Cap Enhanced Yield ETF | 57,414 | 8.79 | 6,074 | -0.30 | ||||
| 2025-09-04 | 13F/A | Advisor Group Holdings, Inc. | 163,741 | 3.74 | 19,393 | 15.55 | ||||
| 2025-07-29 | NP | EBI - Longview Advantage ETF | 0 | -100.00 | 0 | -100.00 | ||||
| 2025-08-12 | 13F | CIBC Private Wealth Group, LLC | 150 | 0.00 | 18 | 21.43 | ||||
| 2025-08-14 | 13F | Fmr Llc | 14,719 | 250.20 | 1,743 | 290.81 | ||||
| 2025-07-17 | 13F | David Kennon Inc | 18,779 | 2.96 | 2,224 | 14.65 | ||||
| 2025-07-25 | 13F | Sequoia Financial Advisors, LLC | 1,840 | 218 | ||||||
| 2025-07-15 | 13F | Retirement Income Solutions, Inc | 7,460 | 0.00 | 883 | 11.35 | ||||
| 2025-08-12 | 13F | Wealthbridge Capital Management, Llc | 140,671 | 6.33 | 16,660 | 18.43 | ||||
| 2025-05-13 | 13F | Watchman Group, Inc. | 0 | -100.00 | 0 | |||||
| 2025-08-08 | 13F | Pnc Financial Services Group, Inc. | 350 | 0.00 | 41 | 10.81 | ||||
| 2025-08-11 | 13F | Principal Securities, Inc. | 4,229 | -0.94 | 501 | 4.60 | ||||
| 2025-07-14 | 13F | Sentinel Pension Advisors Inc | 852,649 | 2.00 | 100,979 | 13.62 | ||||
| 2025-08-15 | 13F/A | Symphony Financial, Ltd. Co. | 22,164 | 2,635 | ||||||
| 2025-08-14 | 13F | Principia Wealth Advisory, LLC | 13,521 | 1,601 | ||||||
| 2025-08-27 | 13F/A | Brinker Capital Investments, LLC | 9,230 | 1,093 | ||||||
| 2025-08-14 | 13F | Toroso Investments, LLC | 553,746 | -12.73 | 65,395 | -3.06 | ||||
| 2025-08-14 | 13F | Herold Advisors, Inc. | 14,526 | -17.23 | 1,720 | -7.77 | ||||
| 2025-07-31 | 13F | Cambridge Investment Research Advisors, Inc. | 2,337 | 16.04 | 0 | |||||
| 2025-08-08 | 13F | Cornerstone Advisors Asset Management, Inc | 14,300 | 0.00 | 1,694 | 11.38 | ||||
| 2025-08-14 | 13F | Bank Of America Corp /de/ | 6,592 | -1.36 | 781 | 9.86 | ||||
| 2025-07-29 | 13F | RPOA Advisors, Inc. | 12,726,372 | -2.40 | 1,507,184 | 8.72 | ||||
| 2025-08-04 | 13F | JDM Financial Group LLC | 235,158 | 10.22 | 27,850 | 22.78 | ||||
| 2025-08-14 | 13F | Old Mission Capital Llc | 3,009 | 356 | ||||||
| 2025-06-30 | NP | SMIDX - SMI Dynamic Allocation Fund | 8,460 | 895 | ||||||
| 2025-08-15 | 13F | Morgan Stanley | 110,223 | 275.36 | 13,054 | 318.10 | ||||
| 2025-08-13 | 13F | EverSource Wealth Advisors, LLC | 195 | 0.00 | 23 | 15.00 | ||||
| 2025-08-13 | 13F | Wills Financial Group LLC | 1,700 | -15.30 | 201 | -5.63 | ||||
| 2025-08-08 | 13F | Accredited Investors Inc. | 1,946 | 230 | ||||||
| 2025-08-14 | 13F | Royal Bank Of Canada | 5,040 | 26.16 | 597 | 40.47 | ||||
| 2025-08-14 | 13F | Hrt Financial Lp | 0 | -100.00 | 0 | |||||
| 2025-08-14 | 13F | McIlrath & Eck, LLC | 8 | 0.00 | 1 | |||||
| 2025-07-29 | 13F | ShoreHaven Wealth Partners, LLC | 4,020 | -3.55 | 476 | 7.45 | ||||
| 2025-08-07 | 13F | Wealth Forward, LLC | 20,232 | -0.08 | 2,396 | 11.34 | ||||
| 2025-07-28 | 13F | Harbour Investments, Inc. | 166 | 0.00 | 20 | 11.76 | ||||
| 2025-07-25 | 13F | Envestnet Portfolio Solutions, Inc. | 0 | -100.00 | 0 | |||||
| 2025-05-13 | 13F | Prime Capital Investment Advisors, LLC | 0 | -100.00 | 0 | |||||
| 2025-07-22 | 13F | Carolina Wealth Advisors, LLC | 894 | 106 | ||||||
| 2025-08-05 | 13F | Advisors Preferred, LLC | 89,643 | 0.00 | 10,607 | 10.57 | ||||
| 2025-07-22 | 13F | Duncan Williams Asset Management, LLC | 3,152 | 373 | ||||||
| 2025-07-25 | 13F | Concurrent Investment Advisors, LLC | 16,918 | 7.36 | 2,004 | 19.58 | ||||
| 2025-08-01 | 13F | Transcend Wealth Collective, Llc | 2,010 | 0.00 | 238 | 11.74 | ||||
| 2025-05-14 | 13F | Hill Investment Group Partners, LLC | 0 | -100.00 | 0 | |||||
| 2025-08-05 | 13F | Key FInancial Inc | 139 | 0.00 | 16 | 14.29 | ||||
| 2025-08-14 | 13F | Mercer Global Advisors Inc /adv | 6,421 | 0.34 | 760 | 11.76 | ||||
| 2025-08-14 | 13F | Mml Investors Services, Llc | 12,712 | 81.70 | 2 | |||||
| 2025-08-04 | 13F | Creekmur Asset Management LLC | 276 | 33 | ||||||
| 2025-07-24 | 13F | IFP Advisors, Inc | 63,259 | 139.90 | 7,492 | 167.25 | ||||
| 2025-07-22 | 13F | Kickstand Ventures, Llc. | 3,152 | -5.15 | 373 | 5.67 | ||||
| 2025-08-11 | 13F | HighTower Advisors, LLC | 3,556 | 0.28 | 421 | 11.67 | ||||
| 2025-08-12 | 13F | Insigneo Advisory Services, Llc | 7,869 | -0.54 | 932 | 10.70 | ||||
| 2025-07-17 | 13F | One Wealth Advisors, LLC | 3,347 | 19.62 | 396 | 33.33 | ||||
| 2025-08-14 | 13F | Betterment LLC | 4,120 | -30.63 | 0 | |||||
| 2025-08-14 | 13F | Stadion Money Management, LLC | 728,410 | -6.40 | 86,027 | 3.97 | ||||
| 2025-07-29 | 13F | Stratos Wealth Partners, LTD. | 14,746 | -46.78 | 1,746 | -40.73 | ||||
| 2025-08-12 | 13F | Global Retirement Partners, LLC | 617 | 26.43 | 73 | 35.19 | ||||
| 2025-08-04 | 13F | Mayflower Financial Advisors, LLC | 4,248 | 5.78 | 503 | 18.08 | ||||
| 2025-08-07 | 13F | BOK Financial Private Wealth, Inc. | 1,905 | 0.00 | 226 | 11.39 | ||||
| 2025-06-30 | NP | SMILX - SMI 50/40/10 Fund | 2,470 | 261 | ||||||
| 2025-08-01 | 13F | Belvedere Trading LLC | Call | 3,600 | 9.09 | 426 | 21.71 | |||
| 2025-07-17 | 13F | Clear Point Advisors Inc. | 3,058 | 12.55 | 362 | 25.69 | ||||
| 2025-08-01 | 13F | Belvedere Trading LLC | Put | 100 | 12 | |||||
| 2025-04-29 | 13F | Resources Investment Advisors, LLC. | 0 | -100.00 | 0 | |||||
| 2025-08-05 | 13F | Sigma Planning Corp | 14,876 | 1,762 | ||||||
| 2025-08-13 | 13F | GM Advisory Group, Inc. | 452,842 | 8.46 | 53,630 | 20.81 | ||||
| 2025-08-14 | 13F | Dean, Jacobson Financial Services, LLC | 3,646 | 432 | ||||||
| 2025-08-12 | 13F | Steward Partners Investment Advisory, Llc | 5,323 | 4.03 | 630 | 15.81 | ||||
| 2025-08-13 | 13F | M&t Bank Corp | 2,492 | -68.12 | 295 | -64.50 | ||||
| 2025-08-14 | 13F | Wells Fargo & Company/mn | 1,958 | -53.15 | 232 | -47.97 | ||||
| 2025-08-11 | 13F | Trajan Wealth LLC | 0 | -100.00 | 0 | |||||
| 2025-05-09 | 13F | Belvedere Trading LLC | 0 | -100.00 | 0 | -100.00 | ||||
| 2025-07-31 | 13F | GenTrust, LLC | 35,370 | 842.95 | 4,189 | 952.26 | ||||
| 2025-08-19 | 13F | Advisory Services Network, LLC | 16,022 | 1,951 | ||||||
| 2025-07-14 | 13F | Park Avenue Securities Llc | 10,768 | 1 | ||||||
| 2025-08-14 | 13F | Two Sigma Investments, Lp | 90,600 | 10,730 | ||||||
| 2025-05-02 | 13F | Wealthfront Advisers Llc | 0 | -100.00 | 0 | -100.00 |