Basic Stats
| Institutional Owners | 64 total, 63 long only, 1 short only, 0 long/short - change of 3.23% MRQ |
| Average Portfolio Allocation | 0.0896 % - change of -16.26% MRQ |
| Institutional Shares (Long) | 7,247,147 (ex 13D/G) - change of 0.14MM shares 2.00% MRQ |
| Institutional Value (Long) | $ 99,318 USD ($1000) |
Institutional Ownership and Shareholders
Ares Dynamic Credit Allocation Fund, Inc. (US:ARDC) has 64 institutional owners and shareholders that have filed 13D/G or 13F forms with the Securities Exchange Commission (SEC). These institutions hold a total of 7,247,956 shares. Largest shareholders include Wells Fargo & Company/mn, Morgan Stanley, Guggenheim Capital Llc, Advisors Asset Management, Inc., Foundations Investment Advisors, LLC, United Advisor Group, LLC, Stifel Financial Corp, Invesco Ltd., Bank Of America Corp /de/, and Hennion & Walsh Asset Management, Inc. .
Ares Dynamic Credit Allocation Fund, Inc. (NYSE:ARDC) institutional ownership structure shows current positions in the company by institutions and funds, as well as latest changes in position size. Major shareholders can include individual investors, mutual funds, hedge funds, or institutions. The Schedule 13D indicates that the investor holds (or held) more than 5% of the company and intends (or intended) to actively pursue a change in business strategy. Schedule 13G indicates a passive investment of over 5%.
The share price as of September 8, 2025 is 14.87 / share. Previously, on September 9, 2024, the share price was 15.40 / share. This represents a decline of 3.44% over that period.

Fund Sentiment Score
The Fund Sentiment Score (fka Ownership Accumulation Score) finds the stocks that are being most bought by funds. It is the result of a sophisticated, multi-factor quantitative model that identifies companies with the highest levels of institutional accumulation. The scoring model uses a combination of the total increase in disclosed owners, the changes in portfolio allocations in those owners and other metrics. The number ranges from 0 to 100, with higher numbers indicating a higher level of accumulation to its peers, and 50 being the average.
Update Frequency: Daily
See Ownership Explorer, which provides a list of highest-ranking companies.
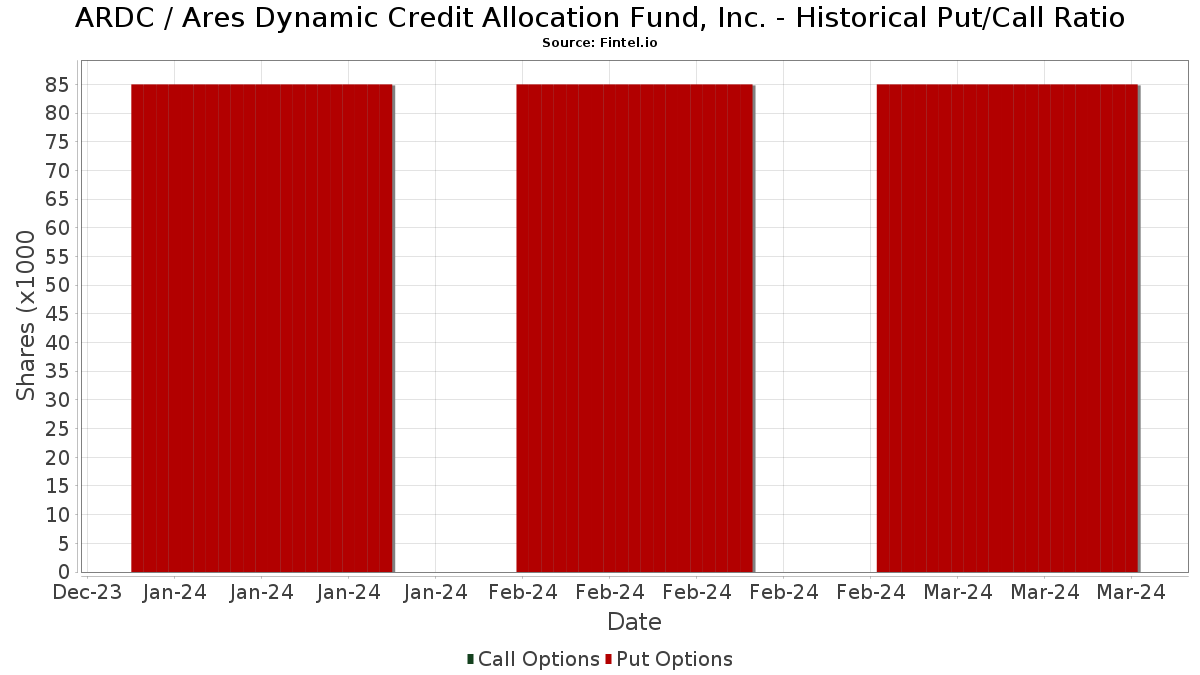
Institutional Put/Call Ratio
In addition to reporting standard equity and debt issues, institutions with more than 100MM assets under management must also disclose their put and call option holdings. Since put options generally indicate negative sentiment, and call options indicate positive sentiment, we can get a sense of the overall institutional sentiment by plotting the ratio of puts to calls. The chart to the right plots the historical put/call ratio for this instrument.
Using Put/Call Ratio as an indicator of investor sentiment overcomes one of the key deficiencies of using total institutional ownership, which is that a significant amount of assets under management are invested passively to track indices. Passively-managed funds do not typically buy options, so the put/call ratio indicator more closely tracks the sentiment of actively-managed funds.
13D/G Filings
We present 13D/G filings separately from the 13F filings because of the different treatement by the SEC. 13D/G filings can be filed by groups of investors (with one leading), whereas 13F filings cannot. This results in situations where an investor may file a 13D/G reporting one value for the total shares (representing all the shares owned by the investor group), but then file a 13F reporting a different value for the total shares (representing strictly their own ownership). This means that share ownership of 13D/G filings and 13F filings are oftentimes not directly comparable, so we present them separately.
Note: As of May 16, 2021, we no longer show owners that have not filed a 13D/G within the last year. Previously, we were showing the full history of 13D/G filings. In general, entities that are required to file 13D/G filings must file at least annually before submitting a closing filing. However, funds sometimes exit positions without submitting a closing filing (ie, they wind down), so displaying the full history sometimes resulted in confusion about the current ownership. To prevent confusion, we now only show ’current’ owners - that is - owners that have filed within the last year.
Upgrade to unlock premium data.
| File Date | Form | Investor | Prev Shares |
Latest Shares |
Δ Shares (Percent) |
Ownership (Percent) |
Δ Ownership (Percent) |
|
|---|---|---|---|---|---|---|---|---|
| 2025-08-06 | WELLS FARGO & COMPANY/MN | 1,701,820 | 1,685,930 | -0.93 | 7.30 | -1.35 | ||
| 2024-11-14 | GUARDIAN LIFE INSURANCE CO OF AMERICA | 280,000 | 280,000 | 0.00 | 7.00 | 0.00 | ||
| 2024-11-14 | Apollo Management Holdings GP, LLC |
13F and NPORT Filings
Detail on 13F filings are free. Detail on NP filings require a premium membership. Green rows indicate new positions. Red rows indicate closed positions. Click the link icon to see the full transaction history.
Upgrade
to unlock premium data and export to Excel ![]() .
.
| File Date | Source | Investor | Type | Avg Price (Est) |
Shares | Δ Shares (%) |
Reported Value ($1000) |
Δ Value (%) |
Port Alloc (%) |
|
|---|---|---|---|---|---|---|---|---|---|---|
| 2025-08-13 | 13F | Guggenheim Capital Llc | 383,564 | -11.77 | 5,454 | -11.14 | ||||
| 2025-08-13 | 13F | EverSource Wealth Advisors, LLC | 1,057 | 15 | ||||||
| 2025-08-07 | 13F | Hennion & Walsh Asset Management, Inc. | 239,104 | 16.69 | 3,400 | 17.53 | ||||
| 2025-07-07 | 13F | Thurston, Springer, Miller, Herd & Titak, Inc. | 642 | 0.00 | 9 | 0.00 | ||||
| 2025-07-21 | 13F | Future Financial Wealth Managment LLC | 1,300 | 0.00 | 18 | 0.00 | ||||
| 2025-08-12 | 13F | Landscape Capital Management, L.l.c. | 121,683 | -20.64 | 1,730 | -20.06 | ||||
| 2025-07-28 | 13F | Curated Wealth Partners LLC | 85,639 | 0.00 | 1,218 | 0.66 | ||||
| 2025-07-10 | 13F | Secure Asset Management, LLC | 177,373 | -8.61 | 2,522 | -7.96 | ||||
| 2025-08-12 | 13F | Proequities, Inc. | 0 | 0 | ||||||
| 2025-08-12 | 13F | LPL Financial LLC | 34,173 | 1.14 | 486 | 1.68 | ||||
| 2025-07-14 | 13F | AdvisorNet Financial, Inc | 235,120 | 38.89 | 3,343 | 39.87 | ||||
| 2025-08-26 | NP | MCTOX - Modern Capital Tactical Opportunities Fund Class A Shares | 0 | -100.00 | 0 | -100.00 | ||||
| 2025-04-09 | 13F | Worth Asset Management, LLC | 0 | -100.00 | 0 | |||||
| 2025-08-12 | 13F | Advisors Asset Management, Inc. | 374,456 | -7.86 | 5,325 | -7.22 | ||||
| 2025-08-04 | 13F | Assetmark, Inc | 7 | 0.00 | 0 | |||||
| 2025-08-08 | 13F | Foundations Investment Advisors, LLC | 352,598 | -13.72 | 5,014 | -12.31 | ||||
| 2025-08-19 | 13F | National Asset Management, Inc. | 0 | -100.00 | 0 | |||||
| 2025-08-14 | 13F | Wiley Bros.-aintree Capital, Llc | 35,792 | 509 | ||||||
| 2025-05-15 | 13F | WPG Advisers, LLC | 0 | -100.00 | 0 | -100.00 | ||||
| 2025-09-09 | 13F | NWF Advisory Services Inc. | 39,250 | 0.00 | 558 | 0.72 | ||||
| 2025-07-22 | 13F | Miracle Mile Advisors, LLC | 35,000 | 0.00 | 498 | 0.61 | ||||
| 2025-08-25 | 13F/A | Neuberger Berman Group LLC | 10,000 | 0.00 | 142 | 0.71 | ||||
| 2025-07-14 | 13F | E&G Advisors, LP | 16,746 | 0.00 | 238 | 0.85 | ||||
| 2025-08-07 | 13F | Readystate Asset Management Lp | 90,357 | 24.76 | 1,285 | 25.64 | ||||
| 2025-08-13 | 13F | Virtus Investment Advisers, Inc. | 51,260 | -12.49 | 729 | -11.97 | ||||
| 2025-05-29 | NP | ACEFX - Absolute Strategies Fund Institutional Shares | Short | -809 | -11 | |||||
| 2025-08-13 | 13F | Northern Trust Corp | 0 | -100.00 | 0 | |||||
| 2025-05-14 | 13F | Virtus ETF Advisers LLC | 0 | -100.00 | 0 | |||||
| 2025-08-08 | 13F | Cedar Wealth Management, LLC | 20,166 | -19.74 | 287 | -19.21 | ||||
| 2025-08-13 | 13F | Invesco Ltd. | 297,857 | 8.58 | 4,236 | 9.35 | ||||
| 2025-08-14 | 13F | Stifel Financial Corp | 303,274 | 5.35 | 4,313 | 6.10 | ||||
| 2025-08-05 | 13F | Shaker Financial Services, LLC | 106,790 | 100.36 | 1,519 | 101.86 | ||||
| 2025-08-11 | 13F | Nations Financial Group Inc, /ia/ /adv | 69,700 | -4.37 | 991 | -3.69 | ||||
| 2025-08-14 | 13F | Raymond James Financial Inc | 47,754 | -31.54 | 679 | -31.00 | ||||
| 2025-08-19 | 13F | Newbridge Financial Services Group, Inc. | 30,544 | 434 | ||||||
| 2025-06-25 | NP | VPC - Virtus Private Credit Strategy ETF | 53,502 | 2.73 | 730 | -8.30 | ||||
| 2025-08-11 | 13F | Anfield Capital Management, LLC | 8,147 | 4.83 | 116 | 5.50 | ||||
| 2025-08-04 | 13F | Spire Wealth Management | 6,500 | 0.00 | 92 | 1.10 | ||||
| 2025-08-14 | 13F | Williams Jones Wealth Management, LLC. | 15,435 | 0.00 | 219 | 0.92 | ||||
| 2025-08-01 | 13F | GoalVest Advisory LLC | 7,000 | 100 | ||||||
| 2025-07-17 | 13F/A | Capital Investment Advisors, LLC | 203,521 | -2.24 | 2,894 | -1.53 | ||||
| 2025-08-06 | 13F | Axim Planning & Wealth | 11,755 | 167 | ||||||
| 2025-08-14 | 13F | Bank Of America Corp /de/ | 247,969 | -1.88 | 3,526 | -1.18 | ||||
| 2025-08-12 | 13F | SRS Capital Advisors, Inc. | 600 | 9 | ||||||
| 2025-08-14 | 13F | Polar Asset Management Partners Inc. | 53,370 | 759 | ||||||
| 2025-08-11 | 13F | NewEdge Wealth, LLC | 132,825 | 9.40 | 1,907 | 11.26 | ||||
| 2025-08-14 | 13F | Federation des caisses Desjardins du Quebec | 7,600 | 0.00 | 108 | 0.93 | ||||
| 2025-08-14 | 13F | UBS Group AG | 46,291 | -14.82 | 658 | -14.21 | ||||
| 2025-08-11 | 13F | Elequin Capital Lp | 5,568 | 64.54 | 79 | 68.09 | ||||
| 2025-08-14 | 13F | Cohen & Steers, Inc. | 180,212 | 0.00 | 3 | 0.00 | ||||
| 2025-08-08 | 13F | Cetera Investment Advisers | 17,859 | -22.08 | 254 | -21.67 | ||||
| 2025-05-09 | 13F | Cornerstone Advisors, LLC | 0 | -100.00 | 0 | |||||
| 2025-08-15 | 13F | Morgan Stanley | 439,362 | 8.51 | 6,248 | 9.27 | ||||
| 2025-07-11 | 13F | Farther Finance Advisors, LLC | 137,190 | 10.07 | 1,951 | 11.17 | ||||
| 2025-05-09 | 13F | Pnc Financial Services Group, Inc. | 0 | -100.00 | 0 | |||||
| 2025-08-14 | 13F | Wells Fargo & Company/mn | 1,685,931 | -0.93 | 23,974 | -0.23 | ||||
| 2025-08-14 | 13F | Susquehanna International Group, Llp | 0 | -100.00 | 0 | |||||
| 2025-09-04 | 13F/A | Advisor Group Holdings, Inc. | 61,122 | 18.16 | 869 | 19.04 | ||||
| 2025-08-01 | 13F | Boyd Watterson Asset Management Llc/oh | 275 | 0.00 | 4 | 0.00 | ||||
| 2025-04-01 | NP | CVY - Invesco Zacks Multi-Asset Income ETF This fund is a listed as child fund of Invesco Ltd. and if that institution has disclosed ownership in this security, then these positions will not be double counted when calculating total shares and total value | 18,676 | 25.67 | 285 | 27.23 | ||||
| 2025-08-14 | 13F | Royal Bank Of Canada | 40,817 | -13.90 | 580 | -13.30 | ||||
| 2025-07-29 | 13F | Huntleigh Advisors, Inc. | 200,898 | 0.64 | 2,857 | 1.35 | ||||
| 2025-08-14 | 13F | GWM Advisors LLC | 19,739 | -2.95 | 281 | -2.44 | ||||
| 2025-08-11 | 13F | United Advisor Group, LLC | 336,279 | 1.64 | 4,782 | 2.35 | ||||
| 2025-08-04 | 13F | Wolverine Asset Management Llc | 67,150 | 247.26 | 955 | 249.45 | ||||
| 2025-08-14 | 13F | CoreCap Advisors, LLC | 3,381 | -22.38 | 48 | -21.31 | ||||
| 2025-08-12 | 13F | MAI Capital Management | 572 | 0.00 | 8 | 0.00 | ||||
| 2025-08-14 | 13F | Hrt Financial Lp | 10,407 | 0 | ||||||
| 2025-07-08 | 13F | Webster Bank, N. A. | 2,531 | 0.00 | 36 | 0.00 | ||||
| 2025-08-14 | 13F | Warren Averett Asset Management, LLC | 12,660 | 0.84 | 180 | 1.69 | ||||
| 2025-07-17 | 13F | Janney Montgomery Scott LLC | 25,786 | 13.26 | 0 | |||||
| 2025-08-14 | 13F | Sit Investment Associates Inc | 43,687 | 1 | ||||||
| 2025-04-23 | 13F | Tyche Wealth Partners LLC | 0 | -100.00 | 0 |