Basic Stats
| Institutional Owners | 29 total, 29 long only, 0 short only, 0 long/short - change of -1.64% MRQ |
| Average Portfolio Allocation | 0.0682 % - change of -0.17% MRQ |
| Institutional Shares (Long) | 153,173,770 (ex 13D/G) - change of 8.51MM shares 2.85% MRQ |
| Institutional Value (Long) | $ 21,132 USD ($1000) |
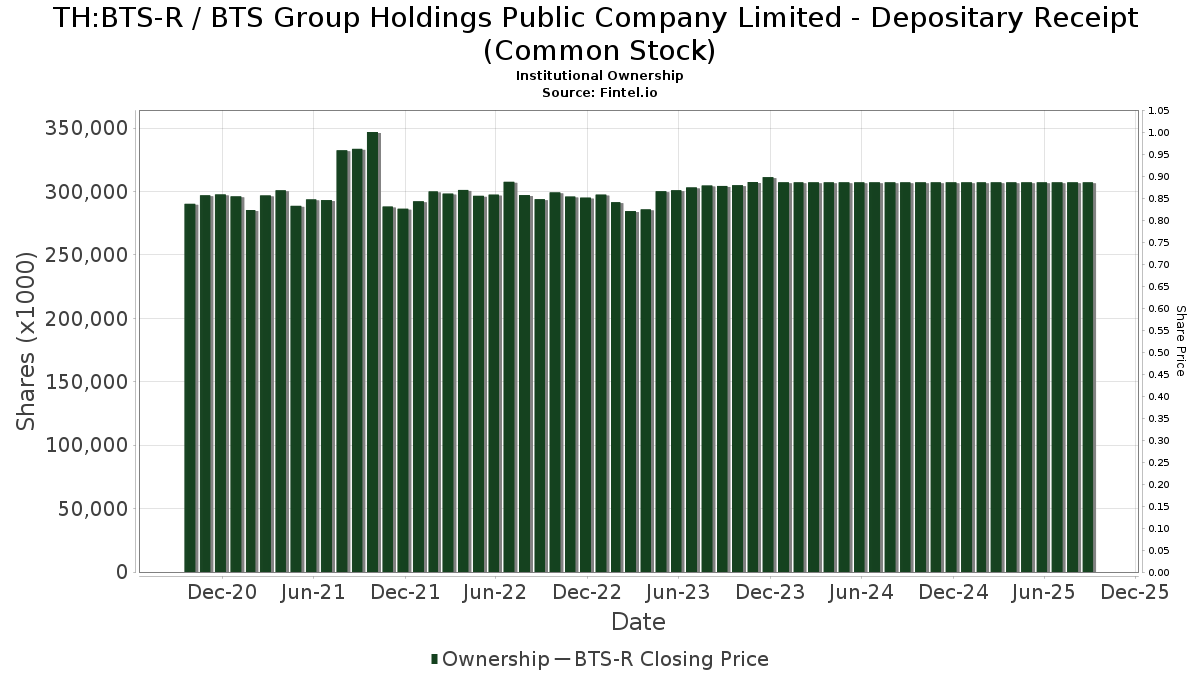
Institutional Ownership and Shareholders
BTS Group Holdings Public Company Limited - Depositary Receipt (Common Stock) (TH:BTS-R) has 29 institutional owners and shareholders that have filed 13D/G or 13F forms with the Securities Exchange Commission (SEC). These institutions hold a total of 153,173,770 shares. Largest shareholders include IEMG - iShares Core MSCI Emerging Markets ETF, IXUS - iShares Core MSCI Total International Stock ETF, THD - iShares MSCI Thailand ETF, SCHE - Schwab Emerging Markets Equity ETF, DFAE - Dimensional Emerging Core Equity Market ETF, FTIHX - Fidelity Total International Index Fund, EWX - SPDR(R) S&P(R) EMERGING MARKETS SMALL CAP ETF, AVEM - Avantis Emerging Markets Equity ETF, EEMS - iShares MSCI Emerging Markets Small-Cap ETF, and FZILX - Fidelity ZERO International Index Fund .
BTS Group Holdings Public Company Limited - Depositary Receipt (Common Stock) (SET:BTS-R) institutional ownership structure shows current positions in the company by institutions and funds, as well as latest changes in position size. Major shareholders can include individual investors, mutual funds, hedge funds, or institutions. The Schedule 13D indicates that the investor holds (or held) more than 5% of the company and intends (or intended) to actively pursue a change in business strategy. Schedule 13G indicates a passive investment of over 5%.
Fund Sentiment Score
The Fund Sentiment Score (fka Ownership Accumulation Score) finds the stocks that are being most bought by funds. It is the result of a sophisticated, multi-factor quantitative model that identifies companies with the highest levels of institutional accumulation. The scoring model uses a combination of the total increase in disclosed owners, the changes in portfolio allocations in those owners and other metrics. The number ranges from 0 to 100, with higher numbers indicating a higher level of accumulation to its peers, and 50 being the average.
Update Frequency: Daily
See Ownership Explorer, which provides a list of highest-ranking companies.
13F and NPORT Filings
Detail on 13F filings are free. Detail on NP filings require a premium membership. Green rows indicate new positions. Red rows indicate closed positions. Click the link icon to see the full transaction history.
Upgrade
to unlock premium data and export to Excel ![]() .
.