Basic Stats
| Institutional Shares (Long) | 350,267 - 0.87% (ex 13D/G) - change of 0.01MM shares 3.95% MRQ |
| Institutional Value (Long) | $ 2,767 USD ($1000) |
Institutional Ownership and Shareholders
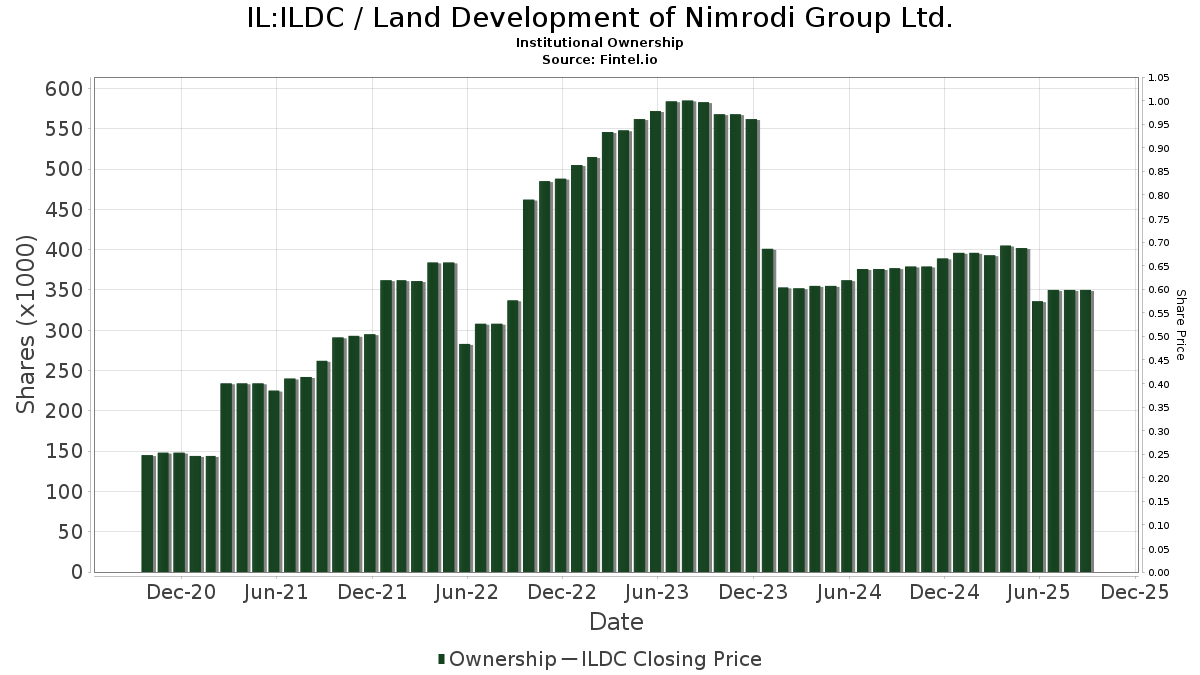
Land Development of Nimrodi Group Ltd. (IL:ILDC) has 25 institutional owners and shareholders that have filed 13D/G or 13F forms with the Securities Exchange Commission (SEC). These institutions hold a total of 350,267 shares. Largest shareholders include Dfa Investment Trust Co - The Continental Small Company Series, VGRLX - Vanguard Global ex-U.S. Real Estate Index Fund Admiral, DFIEX - International Core Equity Portfolio - Institutional Class, DFIS - Dimensional International Small Cap ETF, DFIC - Dimensional International Core Equity 2 ETF, DFAX - Dimensional World ex U.S. Core Equity 2 ETF, DISV - Dimensional International Small Cap Value ETF, DFA INVESTMENT DIMENSIONS GROUP INC - World ex U.S. Core Equity Portfolio Institutional Class Shares, DFA INVESTMENT DIMENSIONS GROUP INC - International Sustainability Core 1 Portfolio Shares, and DFA INVESTMENT DIMENSIONS GROUP INC - International Vector Equity Portfolio Shares .
Land Development of Nimrodi Group Ltd. (TASE:ILDC) institutional ownership structure shows current positions in the company by institutions and funds, as well as latest changes in position size. Major shareholders can include individual investors, mutual funds, hedge funds, or institutions. The Schedule 13D indicates that the investor holds (or held) more than 5% of the company and intends (or intended) to actively pursue a change in business strategy. Schedule 13G indicates a passive investment of over 5%.
Fund Sentiment Score
The Fund Sentiment Score (fka Ownership Accumulation Score) finds the stocks that are being most bought by funds. It is the result of a sophisticated, multi-factor quantitative model that identifies companies with the highest levels of institutional accumulation. The scoring model uses a combination of the total increase in disclosed owners, the changes in portfolio allocations in those owners and other metrics. The number ranges from 0 to 100, with higher numbers indicating a higher level of accumulation to its peers, and 50 being the average.
Update Frequency: Daily
See Ownership Explorer, which provides a list of highest-ranking companies.
13F and NPORT Filings
Detail on 13F filings are free. Detail on NP filings require a premium membership. Green rows indicate new positions. Red rows indicate closed positions. Click the link icon to see the full transaction history.
Upgrade
to unlock premium data and export to Excel ![]() .
.