Basic Stats
| Institutional Shares (Long) | 104,878 - 0.28% (ex 13D/G) - change of 0.02MM shares 24.35% MRQ |
| Institutional Value (Long) | $ 284 USD ($1000) |
Institutional Ownership and Shareholders
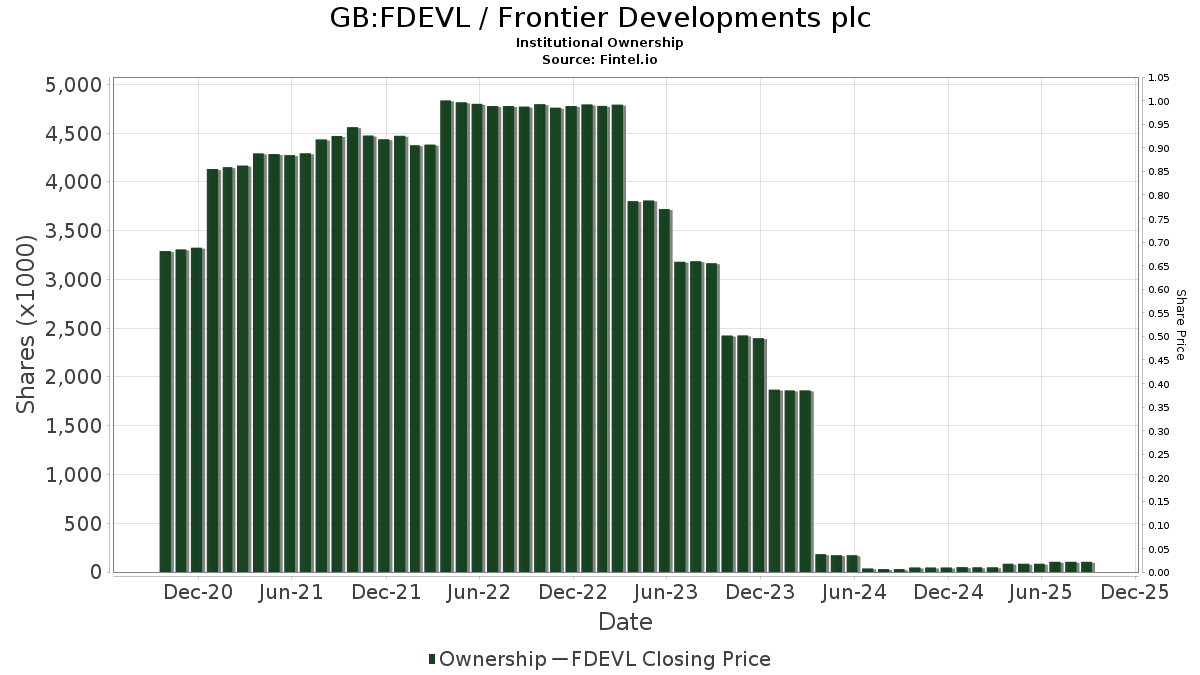
Frontier Developments plc (GB:FDEVL) has 15 institutional owners and shareholders that have filed 13D/G or 13F forms with the Securities Exchange Commission (SEC). These institutions hold a total of 104,878 shares. Largest shareholders include ISCF - iShares Edge MSCI Multifactor Intl Small-Cap ETF, OWSMX - Old Westbury Small & Mid Cap Strategies Fund, DFA INVESTMENT DIMENSIONS GROUP INC - International Vector Equity Portfolio Shares, NTKLX - Voya Multi-Manager International Small Cap Fund Class A, DFA INVESTMENT DIMENSIONS GROUP INC - World ex U.S. Targeted Value Portfolio Institutional Class, DFA INVESTMENT DIMENSIONS GROUP INC - International Social Core Equity Portfolio Institutional Class, Brighthouse Funds Trust II - Brighthouse/Dimensional International Small Company Portfolio Class A, Dfa Investment Dimensions Group Inc - Va International Small Portfolio, DFIS - Dimensional International Small Cap ETF, and JAJDX - International Small Company Trust NAV .
Frontier Developments plc (BATS-CHIXE:FDEVL) institutional ownership structure shows current positions in the company by institutions and funds, as well as latest changes in position size. Major shareholders can include individual investors, mutual funds, hedge funds, or institutions. The Schedule 13D indicates that the investor holds (or held) more than 5% of the company and intends (or intended) to actively pursue a change in business strategy. Schedule 13G indicates a passive investment of over 5%.
Fund Sentiment Score
The Fund Sentiment Score (fka Ownership Accumulation Score) finds the stocks that are being most bought by funds. It is the result of a sophisticated, multi-factor quantitative model that identifies companies with the highest levels of institutional accumulation. The scoring model uses a combination of the total increase in disclosed owners, the changes in portfolio allocations in those owners and other metrics. The number ranges from 0 to 100, with higher numbers indicating a higher level of accumulation to its peers, and 50 being the average.
Update Frequency: Daily
See Ownership Explorer, which provides a list of highest-ranking companies.
13F and NPORT Filings
Detail on 13F filings are free. Detail on NP filings require a premium membership. Green rows indicate new positions. Red rows indicate closed positions. Click the link icon to see the full transaction history.
Upgrade
to unlock premium data and export to Excel ![]() .
.