Basic Stats
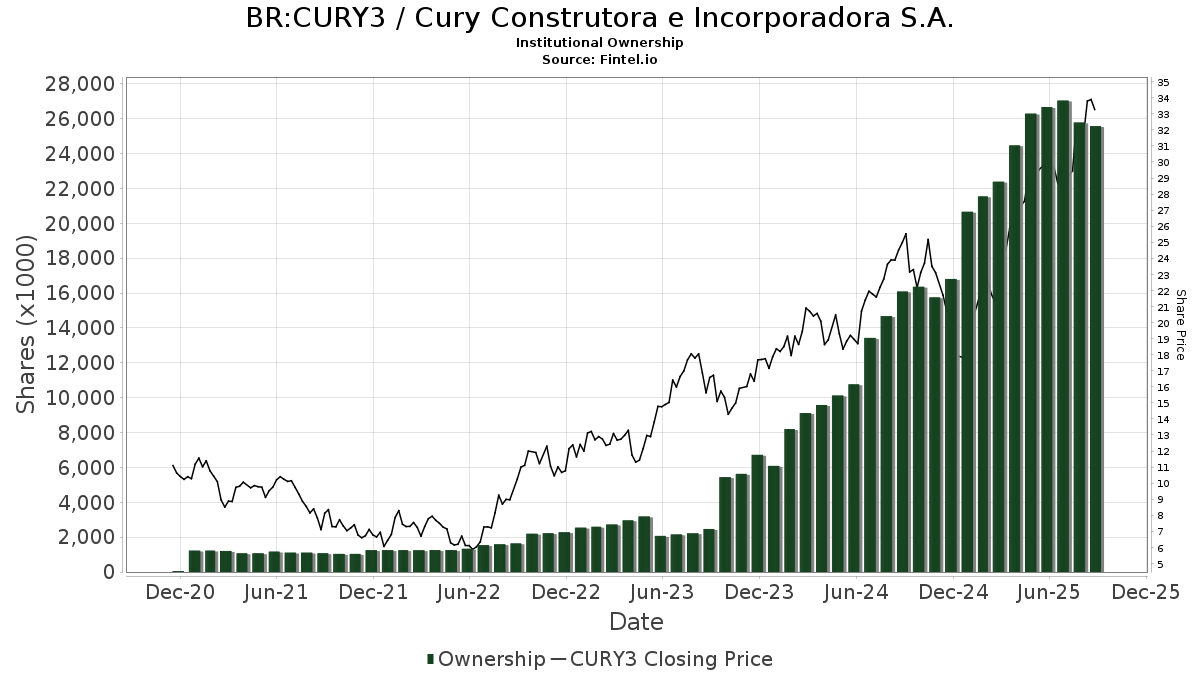
| Institutional Shares (Long) | 25,573,555 - 8.82% (ex 13D/G) - change of -1.09MM shares -4.10% MRQ |
| Institutional Value (Long) | $ 127,833 USD ($1000) |
Institutional Ownership and Shareholders
Cury Construtora e Incorporadora S.A. (BR:CURY3) has 73 institutional owners and shareholders that have filed 13D/G or 13F forms with the Securities Exchange Commission (SEC). These institutions hold a total of 25,573,555 shares. Largest shareholders include FEMSX - Fidelity Series Emerging Markets Opportunities Fund, PEAPX - International Emerging Markets Fund R-3, IEMG - iShares Core MSCI Emerging Markets ETF, VGTSX - Vanguard Total International Stock Index Fund Investor Shares, VEIEX - Vanguard Emerging Markets Stock Index Fund Investor Shares, CEMVX - Causeway Emerging Markets Fund Investor Class, FGOMX - Strategic Advisers Fidelity Emerging Markets Fund, BESIX - William Blair Emerging Markets Small Cap Growth Fund Class I, DEM - WisdomTree Emerging Markets High Dividend Fund N/A, and DFCEX - Emerging Markets Core Equity Portfolio - Institutional Class .
Cury Construtora e Incorporadora S.A. (BOVESPA:CURY3) institutional ownership structure shows current positions in the company by institutions and funds, as well as latest changes in position size. Major shareholders can include individual investors, mutual funds, hedge funds, or institutions. The Schedule 13D indicates that the investor holds (or held) more than 5% of the company and intends (or intended) to actively pursue a change in business strategy. Schedule 13G indicates a passive investment of over 5%.
The share price as of September 10, 2025 is 33.26 / share. Previously, on September 11, 2024, the share price was 24.98 / share. This represents an increase of 33.15% over that period.
Fund Sentiment Score
The Fund Sentiment Score (fka Ownership Accumulation Score) finds the stocks that are being most bought by funds. It is the result of a sophisticated, multi-factor quantitative model that identifies companies with the highest levels of institutional accumulation. The scoring model uses a combination of the total increase in disclosed owners, the changes in portfolio allocations in those owners and other metrics. The number ranges from 0 to 100, with higher numbers indicating a higher level of accumulation to its peers, and 50 being the average.
Update Frequency: Daily
See Ownership Explorer, which provides a list of highest-ranking companies.
13F and NPORT Filings
Detail on 13F filings are free. Detail on NP filings require a premium membership. Green rows indicate new positions. Red rows indicate closed positions. Click the link icon to see the full transaction history.
Upgrade
to unlock premium data and export to Excel ![]() .
.