Basic Stats
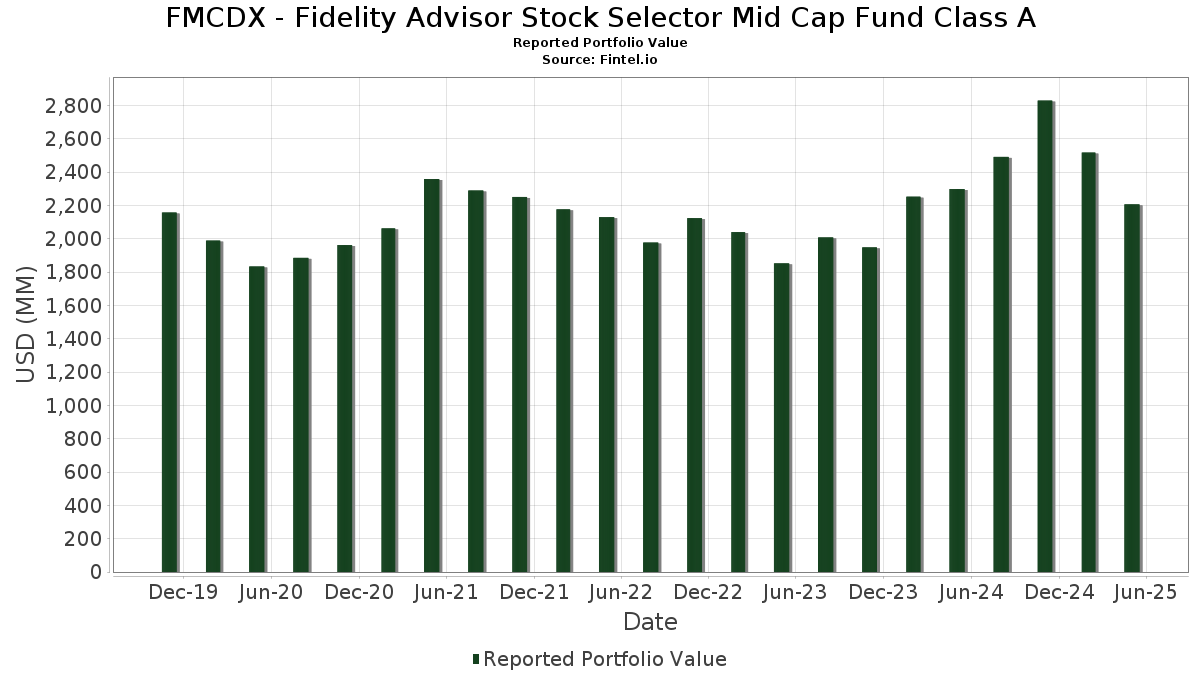
| Portfolio Value | $ 2,207,019,316 |
| Current Positions | 207 |
Latest Holdings, Performance, AUM (from 13F, 13D)
FMCDX - Fidelity Advisor Stock Selector Mid Cap Fund Class A has disclosed 207 total holdings in their latest SEC filings. Most recent portfolio value is calculated to be $ 2,207,019,316 USD. Actual Assets Under Management (AUM) is this value plus cash (which is not disclosed). FMCDX - Fidelity Advisor Stock Selector Mid Cap Fund Class A’s top holdings are Fidelity Cash Central Fund (US:US31635A1051) , Howmet Aerospace Inc. (US:HWM) , The Bancorp, Inc. (US:TBBK) , Heico Corp. - Class A (US:HEIA) , and Popular, Inc. (US:BPOP) . FMCDX - Fidelity Advisor Stock Selector Mid Cap Fund Class A’s new positions include Kyndryl Holdings, Inc. (MX:KD) , MACOM Technology Solutions Holdings, Inc. (US:MTSI) , Hokuhoku Financial Group, Inc. (JP:8377) , Crown Holdings, Inc. (US:CCK) , and Wingstop Inc. (DE:EWG) .
Top Increases This Quarter
We use the change in the portfolio allocation because this is the most meaningful metric. Changes can be due to trades or changes in share prices.
| Security | Shares (MM) |
Value (MM$) |
Portfolio % | ΔPortfolio % |
|---|---|---|---|---|
| 110.25 | 110.27 | 5.0149 | 3.7051 | |
| 0.08 | 17.17 | 0.7811 | 0.7811 | |
| 0.40 | 15.55 | 0.7070 | 0.7070 | |
| 0.11 | 13.44 | 0.6111 | 0.6111 | |
| 0.64 | 12.34 | 0.5614 | 0.5614 | |
| 0.12 | 12.28 | 0.5586 | 0.5586 | |
| 0.03 | 11.82 | 0.5377 | 0.5377 | |
| 0.05 | 11.70 | 0.5322 | 0.5322 | |
| 0.28 | 28.96 | 1.3172 | 0.4853 | |
| 0.20 | 15.01 | 0.6828 | 0.4802 |
Top Decreases This Quarter
We use the change in the portfolio allocation because this is the most meaningful metric. Changes can be due to trades or changes in share prices.
| Security | Shares (MM) |
Value (MM$) |
Portfolio % | ΔPortfolio % |
|---|---|---|---|---|
| 0.02 | 3.95 | 0.1796 | -0.8977 | |
| 0.04 | 6.15 | 0.2796 | -0.8111 | |
| 0.09 | 9.89 | 0.4500 | -0.7060 | |
| 0.00 | 0.00 | -0.6262 | ||
| 0.07 | 6.78 | 0.3084 | -0.5131 | |
| 0.00 | 0.00 | -0.4085 | ||
| 0.00 | 0.00 | -0.4070 | ||
| 0.00 | 0.00 | -0.3662 | ||
| 0.59 | 30.26 | 1.3764 | -0.3623 | |
| 0.08 | 4.17 | 0.1897 | -0.3270 |
13F and Fund Filings
This form was filed on 2025-07-24 for the reporting period 2025-05-31. Click the link icon to see the full transaction history.
Upgrade to unlock premium data and export to Excel ![]() .
.
| Security | Type | Avg Share Price | Shares (MM) |
ΔShares (%) |
ΔShares (%) |
Value ($MM) |
Portfolio (%) |
ΔPortfolio (%) |
|
|---|---|---|---|---|---|---|---|---|---|
| US31635A1051 / Fidelity Cash Central Fund | 110.25 | 237.04 | 110.27 | 237.05 | 5.0149 | 3.7051 | |||
| HWM / Howmet Aerospace Inc. | 0.20 | -12.73 | 33.18 | 8.53 | 1.5090 | 0.2850 | |||
| TBBK / The Bancorp, Inc. | 0.59 | -23.88 | 30.26 | -30.31 | 1.3764 | -0.3623 | |||
| HEIA / Heico Corp. - Class A | 0.13 | -12.75 | 30.19 | -3.46 | 1.3730 | 0.1210 | |||
| BPOP / Popular, Inc. | 0.28 | 35.21 | 28.96 | 39.39 | 1.3172 | 0.4853 | |||
| CSL / Carlisle Companies Incorporated | 0.07 | -12.78 | 28.03 | -2.68 | 1.2750 | 0.1216 | |||
| XPO / XPO, Inc. | 0.24 | -12.76 | 27.48 | -19.24 | 1.2497 | -0.1124 | |||
| ESAB / ESAB Corporation | 0.21 | -12.77 | 25.45 | -14.38 | 1.1573 | -0.0326 | |||
| SGI / Somnigroup International Inc. | 0.38 | 21.41 | 24.83 | 23.65 | 1.1291 | 0.3253 | |||
| SLM / SLM Corporation | 0.75 | -0.24 | 24.40 | 6.97 | 1.1097 | 0.1964 | |||
| MASI / Masimo Corporation | 0.15 | -9.45 | 24.13 | -22.05 | 1.0975 | -0.1420 | |||
| ITT / ITT Inc. | 0.16 | -12.82 | 24.05 | -7.08 | 1.0940 | 0.0576 | |||
| RGA / Reinsurance Group of America, Incorporated | 0.11 | 0.00 | 23.22 | 0.30 | 1.0561 | 0.1292 | |||
| PFGC / Performance Food Group Company | 0.25 | -7.12 | 21.97 | -2.29 | 0.9991 | 0.0989 | |||
| AFG / American Financial Group, Inc. | 0.18 | 52.24 | 21.87 | 49.46 | 0.9946 | 0.4088 | |||
| WCC / WESCO International, Inc. | 0.13 | -12.84 | 21.21 | -18.91 | 0.9645 | -0.0826 | |||
| THC / Tenet Healthcare Corporation | 0.12 | 2.21 | 21.10 | 36.27 | 0.9594 | 0.3396 | |||
| CR / Crane Company | 0.12 | -12.86 | 20.67 | -8.37 | 0.9401 | 0.0370 | |||
| PEN / Penumbra, Inc. | 0.08 | -17.75 | 20.53 | -23.08 | 0.9337 | -0.1348 | |||
| KEX / Kirby Corporation | 0.18 | -12.81 | 19.96 | -7.44 | 0.9077 | 0.0444 | |||
| FLS / Flowserve Corporation | 0.40 | -12.76 | 19.89 | -20.89 | 0.9048 | -0.1020 | |||
| RS / Reliance, Inc. | 0.07 | -20.43 | 19.50 | -21.59 | 0.8869 | -0.1088 | |||
| SCI / Service Corporation International | 0.24 | -13.05 | 18.92 | -16.27 | 0.8606 | -0.0442 | |||
| CACI / CACI International Inc | 0.04 | -12.87 | 18.83 | 11.37 | 0.8565 | 0.1795 | |||
| ARMK / Aramark | 0.46 | -16.07 | 18.66 | -8.25 | 0.8488 | 0.0344 | |||
| DT / Dynatrace, Inc. | 0.34 | 35.84 | 18.11 | 28.15 | 0.8239 | 0.2580 | |||
| OKTA / Okta, Inc. | 0.17 | 48.66 | 17.78 | 69.51 | 0.8084 | 0.3886 | |||
| EME / EMCOR Group, Inc. | 0.04 | -12.47 | 17.55 | 1.01 | 0.7983 | 0.1025 | |||
| RPM / RPM International Inc. | 0.15 | -18.77 | 17.54 | -25.36 | 0.7978 | -0.1431 | |||
| AR / Antero Resources Corporation | 0.47 | 23.63 | 17.44 | 26.16 | 0.7930 | 0.2397 | |||
| BRP / The Baldwin Insurance Group, Inc. | 0.45 | -23.88 | 17.23 | -28.71 | 0.7837 | -0.1840 | |||
| GWRE / Guidewire Software, Inc. | 0.08 | 17.17 | 0.7811 | 0.7811 | |||||
| USFD / US Foods Holding Corp. | 0.21 | -6.94 | 16.46 | 2.72 | 0.7485 | 0.1071 | |||
| BCO / The Brink's Company | 0.20 | -12.80 | 16.16 | -23.91 | 0.7348 | -0.1153 | |||
| WSO / Watsco, Inc. | 0.04 | -12.87 | 15.61 | -23.37 | 0.7101 | -0.1056 | |||
| KD / Kyndryl Holdings, Inc. | 0.40 | 15.55 | 0.7070 | 0.7070 | |||||
| UNM / Unum Group | 0.19 | -23.88 | 15.37 | -24.42 | 0.6992 | -0.1151 | |||
| FHN / First Horizon Corporation | 0.77 | -9.58 | 15.27 | -16.55 | 0.6945 | -0.0381 | |||
| LSTR / Landstar System, Inc. | 0.11 | -12.89 | 15.21 | -24.73 | 0.6915 | -0.1172 | |||
| WWD / Woodward, Inc. | 0.07 | -12.48 | 15.16 | 0.17 | 0.6897 | 0.0836 | |||
| VTR / Ventas, Inc. | 0.24 | -11.77 | 15.13 | -18.02 | 0.6882 | -0.0508 | |||
| COHR / Coherent Corp. | 0.20 | 194.95 | 15.01 | 196.68 | 0.6828 | 0.4802 | |||
| PRI / Primerica, Inc. | 0.05 | 0.00 | 14.77 | -6.69 | 0.6719 | 0.0380 | |||
| DKS / DICK'S Sporting Goods, Inc. | 0.08 | 1.88 | 14.58 | -18.83 | 0.6631 | -0.0561 | |||
| SNX / TD SYNNEX Corporation | 0.11 | 0.26 | 13.85 | -11.51 | 0.6298 | 0.0032 | |||
| BURL / Burlington Stores, Inc. | 0.06 | -15.91 | 13.75 | -23.01 | 0.6255 | -0.0897 | |||
| CASY / Casey's General Stores, Inc. | 0.03 | -6.82 | 13.75 | -1.53 | 0.6251 | 0.0663 | |||
| BBWI / Bath & Body Works, Inc. | 0.48 | 210.11 | 13.54 | 140.70 | 0.6159 | 0.3906 | |||
| CIEN / Ciena Corporation | 0.17 | 2.44 | 13.45 | 3.06 | 0.6119 | 0.0893 | |||
| MTSI / MACOM Technology Solutions Holdings, Inc. | 0.11 | 13.44 | 0.6111 | 0.6111 | |||||
| CHE / Chemed Corporation | 0.02 | -30.63 | 13.28 | -33.63 | 0.6039 | -0.1971 | |||
| FCPT / Four Corners Property Trust, Inc. | 0.47 | -21.06 | 13.04 | -24.19 | 0.5929 | -0.0956 | |||
| BJ / BJ's Wholesale Club Holdings, Inc. | 0.11 | -11.34 | 12.75 | -0.88 | 0.5797 | 0.0649 | |||
| PR / Permian Resources Corporation | 1.00 | -11.48 | 12.63 | -20.78 | 0.5742 | -0.0638 | |||
| MUSA / Murphy USA Inc. | 0.03 | -4.85 | 12.55 | -13.46 | 0.5707 | -0.0098 | |||
| SNV / Synovus Financial Corp. | 0.26 | -6.26 | 12.48 | -13.58 | 0.5675 | -0.0106 | |||
| CMA / Comerica Incorporated | 0.22 | 24.54 | 12.43 | 10.53 | 0.5654 | 0.1151 | |||
| EXAS / Exact Sciences Corporation | 0.22 | -12.00 | 12.38 | 4.46 | 0.5631 | 0.0886 | |||
| TOL / Toll Brothers, Inc. | 0.12 | -16.08 | 12.35 | -21.63 | 0.5618 | -0.0693 | |||
| 8377 / Hokuhoku Financial Group, Inc. | 0.64 | 12.34 | 0.5614 | 0.5614 | |||||
| CCK / Crown Holdings, Inc. | 0.12 | 12.28 | 0.5586 | 0.5586 | |||||
| ALSN / Allison Transmission Holdings, Inc. | 0.12 | 0.00 | 12.12 | 1.74 | 0.5511 | 0.0743 | |||
| TRNO / Terreno Realty Corporation | 0.21 | -9.50 | 12.09 | -24.72 | 0.5499 | -0.0931 | |||
| SFM / Sprouts Farmers Market, Inc. | 0.07 | -3.62 | 11.96 | 12.26 | 0.5440 | 0.1174 | |||
| CASH / Pathward Financial, Inc. | 0.15 | -9.31 | 11.90 | -8.68 | 0.5410 | 0.0195 | |||
| OWL / Blue Owl Capital Inc. | 0.64 | -32.49 | 11.87 | -41.42 | 0.5399 | -0.2715 | |||
| KBR / KBR, Inc. | 0.23 | -12.61 | 11.87 | -6.98 | 0.5397 | 0.0290 | |||
| ATR / AptarGroup, Inc. | 0.07 | -41.88 | 11.85 | -37.27 | 0.5389 | -0.2173 | |||
| EWG / Wingstop Inc. | 0.03 | 11.82 | 0.5377 | 0.5377 | |||||
| TPR / Tapestry, Inc. | 0.15 | -16.12 | 11.77 | -22.87 | 0.5353 | -0.0756 | |||
| CRS / Carpenter Technology Corporation | 0.05 | 11.70 | 0.5322 | 0.5322 | |||||
| JLL / Jones Lang LaSalle Incorporated | 0.05 | -11.00 | 11.54 | -27.10 | 0.5246 | -0.1089 | |||
| WSC / WillScot Holdings Corporation | 0.43 | -12.58 | 11.52 | -28.50 | 0.5238 | -0.1211 | |||
| CHWY / Chewy, Inc. | 0.25 | -16.15 | 11.34 | 1.83 | 0.5159 | 0.0699 | |||
| EXP / Eagle Materials Inc. | 0.06 | -24.56 | 11.30 | -32.57 | 0.5141 | -0.1570 | |||
| TREX / Trex Company, Inc. | 0.20 | 92.70 | 11.21 | 74.54 | 0.5097 | 0.2526 | |||
| US7587501039 / Regal-Beloit Corp. | 0.08 | -12.54 | 11.08 | -9.81 | 0.5039 | 0.0121 | |||
| DOV / Dover Corporation | 0.06 | -12.50 | 11.07 | -21.76 | 0.5036 | -0.0630 | |||
| BTSG / BrightSpring Health Services, Inc. | 0.47 | -30.60 | 11.07 | -14.29 | 0.5035 | -0.0136 | |||
| ATZ / Aritzia Inc. | 0.23 | -18.02 | 10.99 | -13.63 | 0.4999 | -0.0096 | |||
| CNM / Core & Main, Inc. | 0.20 | -12.60 | 10.95 | -6.08 | 0.4980 | 0.0312 | |||
| EBC / Eastern Bankshares, Inc. | 0.72 | -23.88 | 10.80 | -36.17 | 0.4914 | -0.1863 | |||
| NVT / nVent Electric plc | 0.16 | -12.61 | 10.76 | -4.70 | 0.4893 | 0.0373 | |||
| LPX / Louisiana-Pacific Corporation | 0.12 | -31.04 | 10.75 | -37.68 | 0.4887 | -0.2016 | |||
| PSTL / Postal Realty Trust, Inc. | 0.77 | -11.04 | 10.70 | -11.62 | 0.4867 | 0.0019 | |||
| ALGM / Allegro MicroSystems, Inc. | 0.42 | 47.06 | 10.65 | 67.20 | 0.4842 | 0.2292 | |||
| PVH / PVH Corp. | 0.13 | -8.12 | 10.62 | 2.85 | 0.4829 | 0.0696 | |||
| FND / Floor & Decor Holdings, Inc. | 0.15 | 19.50 | 10.59 | -11.35 | 0.4816 | 0.0034 | |||
| REXR / Rexford Industrial Realty, Inc. | 0.30 | -11.07 | 10.51 | -24.15 | 0.4778 | -0.0768 | |||
| SUI / Sun Communities, Inc. | 0.08 | -18.82 | 10.17 | -26.40 | 0.4626 | -0.0907 | |||
| CUBE / CubeSmart | 0.24 | -10.85 | 10.08 | -7.66 | 0.4585 | 0.0214 | |||
| JBL / Jabil Inc. | 0.06 | -25.69 | 10.01 | -19.41 | 0.4554 | -0.0420 | |||
| CVLT / Commvault Systems, Inc. | 0.05 | 9.98 | 0.4540 | 0.4540 | |||||
| US31635A3032 / Fidelity Securities Lending Cash Central Fund | 9.90 | -39.72 | 9.90 | -39.72 | 0.4504 | -0.2074 | |||
| EXE / Expand Energy Corporation | 0.09 | -70.82 | 9.89 | -65.73 | 0.4500 | -0.7060 | |||
| OUT / OUTFRONT Media Inc. | 0.59 | 6.71 | 9.82 | -5.22 | 0.4467 | 0.0318 | |||
| AB / AllianceBernstein Holding L.P. - Limited Partnership | 0.25 | -28.90 | 9.82 | -24.57 | 0.4466 | -0.0746 | |||
| ASB / Associated Banc-Corp | 0.42 | 0.00 | 9.74 | -6.76 | 0.4428 | 0.0247 | |||
| AMH / American Homes 4 Rent | 0.25 | -11.06 | 9.61 | -9.05 | 0.4372 | 0.0141 | |||
| CHDN / Churchill Downs Incorporated | 0.10 | -15.93 | 9.37 | -32.27 | 0.4263 | -0.1277 | |||
| EAT / Brinker International, Inc. | 0.05 | -23.13 | 9.06 | -19.49 | 0.4122 | -0.0385 | |||
| UGI / UGI Corporation | 0.25 | -15.67 | 9.04 | -10.98 | 0.4111 | 0.0046 | |||
| TXNM / TXNM Energy, Inc. | 0.16 | -26.26 | 9.03 | -19.99 | 0.4105 | -0.0412 | |||
| PAX / Patria Investments Limited | 0.71 | -14.89 | 8.99 | -4.30 | 0.4090 | 0.0328 | |||
| X / United States Steel Corporation | 0.17 | 8.97 | 0.4078 | 0.4078 | |||||
| AVDX / AvidXchange Holdings, Inc. | 0.91 | -23.88 | 8.94 | -1.94 | 0.4064 | 0.0416 | |||
| COOP / Mr. Cooper Group Inc. | 0.07 | -23.88 | 8.78 | -12.25 | 0.3991 | -0.0013 | |||
| UE / Urban Edge Properties | 0.48 | 17.75 | 8.71 | 3.80 | 0.3960 | 0.0602 | |||
| BROS / Dutch Bros Inc. | 0.12 | -34.48 | 8.70 | -40.23 | 0.3957 | -0.1871 | |||
| MOH / Molina Healthcare, Inc. | 0.03 | 20.09 | 8.57 | 16.44 | 0.3898 | 0.0600 | |||
| ESNT / Essent Group Ltd. | 0.15 | -23.88 | 8.56 | -23.38 | 0.3894 | -0.0580 | |||
| BHF / Brighthouse Financial, Inc. | 0.14 | -23.88 | 8.47 | -23.23 | 0.3853 | -0.0565 | |||
| LUNMF / Lundin Mining Corporation | 0.90 | -28.03 | 8.47 | -14.97 | 0.3853 | -0.0136 | |||
| HGV / Hilton Grand Vacations Inc. | 0.22 | -16.20 | 8.43 | -25.44 | 0.3835 | -0.0693 | |||
| OGE / OGE Energy Corp. | 0.19 | -15.72 | 8.27 | -19.01 | 0.3762 | -0.0327 | |||
| PODD / Insulet Corporation | 0.03 | -45.38 | 8.26 | -34.79 | 0.3755 | -0.1314 | |||
| BDC / Belden Inc. | 0.08 | 25.97 | 8.24 | 293.18 | 0.3748 | 0.2562 | |||
| GTLS / Chart Industries, Inc. | 0.05 | -12.65 | 8.24 | -28.09 | 0.3745 | -0.0840 | |||
| WDC / Western Digital Corporation | 0.16 | 8.05 | 0.3662 | 0.3662 | |||||
| NFG / National Fuel Gas Company | 0.10 | -15.73 | 7.92 | -7.50 | 0.3600 | 0.0174 | |||
| VVV / Valvoline Inc. | 0.23 | -16.22 | 7.86 | -21.42 | 0.3576 | -0.0430 | |||
| GKOS / Glaukos Corporation | 0.08 | 38.17 | 7.82 | 8.54 | 0.3555 | 0.0672 | |||
| ONTO / Onto Innovation Inc. | 0.08 | 7.69 | 0.3496 | 0.3496 | |||||
| TRGP / Targa Resources Corp. | 0.05 | -11.48 | 7.68 | -30.69 | 0.3491 | -0.0943 | |||
| US4039491000 / HF Sinclair Corp. | 0.21 | -11.50 | 7.48 | -9.34 | 0.3403 | 0.0099 | |||
| FCFS / FirstCash Holdings, Inc. | 0.06 | 32.96 | 7.35 | 72.60 | 0.3343 | 0.1002 | |||
| MKSI / MKS Inc. | 0.09 | -8.36 | 7.30 | -17.97 | 0.3319 | -0.0243 | |||
| NYT / The New York Times Company | 0.13 | -16.06 | 7.28 | -0.30 | 0.3312 | 0.0388 | |||
| TMHC / Taylor Morrison Home Corporation | 0.13 | -15.88 | 7.27 | -23.20 | 0.3309 | -0.0484 | |||
| VCYT / Veracyte, Inc. | 0.27 | 107.84 | 7.24 | 59.09 | 0.3292 | 0.1470 | |||
| RMBS / Rambus Inc. | 0.13 | 7.14 | 0.3249 | 0.3249 | |||||
| APPF / AppFolio, Inc. | 0.03 | 7.12 | 0.3236 | 0.3236 | |||||
| VOYA / Voya Financial, Inc. | 0.11 | -24.03 | 7.08 | -30.07 | 0.3219 | -0.0833 | |||
| PRVA / Privia Health Group, Inc. | 0.30 | -39.12 | 6.93 | -44.51 | 0.3151 | -0.1848 | |||
| OC / Owens Corning | 0.05 | -12.69 | 6.91 | -24.08 | 0.3143 | -0.0501 | |||
| LEA / Lear Corporation | 0.07 | -36.09 | 6.78 | -56.80 | 0.3084 | -0.5131 | |||
| TWLO / Twilio Inc. | 0.06 | -14.56 | 6.70 | -16.15 | 0.3046 | -0.0152 | |||
| DEI / Douglas Emmett, Inc. | 0.47 | 58.98 | 6.69 | 30.77 | 0.3042 | 0.0994 | |||
| UST BILLS 0% 08/14/2025 / DBT (US912797PN17) | 6.64 | 0.3021 | 0.3021 | ||||||
| CPRI / Capri Holdings Limited | 0.36 | 18.41 | 6.54 | -2.39 | 0.2973 | 0.0292 | |||
| AVNT / Avient Corporation | 0.18 | -37.68 | 6.51 | -47.35 | 0.2963 | -0.1991 | |||
| WFRD / Weatherford International plc | 0.14 | -20.60 | 6.30 | -44.08 | 0.2865 | -0.1646 | |||
| BKP / Piraeus Financial Holdings S.A. | 0.94 | -23.88 | 6.28 | 7.41 | 0.2856 | 0.0515 | |||
| INSP / Inspire Medical Systems, Inc. | 0.05 | -27.36 | 6.27 | -45.91 | 0.2853 | -0.1790 | |||
| MRX / Marex Group plc | 0.14 | 6.25 | 0.2845 | 0.2845 | |||||
| INGR / Ingredion Incorporated | 0.04 | 0.22 | 6.20 | 6.74 | 0.2822 | 0.0495 | |||
| WSM / Williams-Sonoma, Inc. | 0.04 | -72.86 | 6.15 | -77.44 | 0.2796 | -0.8111 | |||
| BIRK / Birkenstock Holding plc | 0.11 | 21.41 | 6.04 | 31.97 | 0.2747 | 0.0914 | |||
| FYBR / Frontier Communications Parent, Inc. | 0.17 | 23.81 | 6.01 | 24.64 | 0.2734 | 0.0803 | |||
| SWX / Southwest Gas Holdings, Inc. | 0.08 | -26.27 | 5.95 | -29.44 | 0.2705 | -0.0669 | |||
| AS / Amer Sports, Inc. | 0.16 | 5.90 | 0.2685 | 0.2685 | |||||
| RPRX / Royalty Pharma plc | 0.18 | -41.64 | 5.85 | -42.96 | 0.2662 | -0.1446 | |||
| MAC / The Macerich Company | 0.36 | -40.43 | 5.85 | -46.57 | 0.2659 | -0.1722 | |||
| PAA / Plains All American Pipeline, L.P. - Limited Partnership | 0.35 | -11.47 | 5.82 | -28.01 | 0.2647 | -0.0590 | |||
| TLN / Talen Energy Corporation | 0.02 | -15.65 | 5.39 | -1.05 | 0.2452 | 0.0271 | |||
| GEN / Gen Digital Inc. | 0.19 | 38.33 | 5.37 | 44.14 | 0.2440 | 0.0950 | |||
| CYBR N / CyberArk Software Ltd. | 0.01 | 5.32 | 0.2420 | 0.2420 | |||||
| HIMS / Hims & Hers Health, Inc. | 0.09 | 5.32 | 0.2418 | 0.2418 | |||||
| VIRT / Virtu Financial, Inc. | 0.13 | -22.87 | 5.28 | 26.64 | 0.2402 | 0.0567 | |||
| WLK / Westlake Corporation | 0.07 | -20.63 | 5.19 | -49.80 | 0.2361 | -0.1779 | |||
| BRBR / BellRing Brands, Inc. | 0.08 | 5.40 | 5.16 | -9.47 | 0.2349 | 0.0065 | |||
| COKE / Coca-Cola Consolidated, Inc. | 0.04 | 680.70 | 5.10 | -36.85 | 0.2320 | -0.0914 | |||
| NOG / Northern Oil and Gas, Inc. | 0.19 | -24.67 | 5.07 | -36.44 | 0.2306 | -0.0888 | |||
| POST / Post Holdings, Inc. | 0.05 | -5.59 | 5.04 | -8.03 | 0.2293 | 0.0099 | |||
| CPT / Camden Property Trust | 0.04 | -5.15 | 4.76 | -10.18 | 0.2164 | 0.0043 | |||
| ELF / e.l.f. Beauty, Inc. | 0.04 | -3.99 | 4.60 | 53.74 | 0.2092 | 0.0894 | |||
| AYI / Acuity Inc. | 0.02 | -12.38 | 4.60 | -23.36 | 0.2092 | -0.0311 | |||
| DAR / Darling Ingredients Inc. | 0.14 | -1.90 | 4.51 | -15.30 | 0.2052 | -0.0081 | |||
| NSIT / Insight Enterprises, Inc. | 0.03 | 4.50 | 0.2046 | 0.2046 | |||||
| SGRY / Surgery Partners, Inc. | 0.19 | -29.00 | 4.49 | -30.39 | 0.2040 | -0.0540 | |||
| CELH / Celsius Holdings, Inc. | 0.12 | -10.37 | 4.45 | 32.17 | 0.2024 | 0.0676 | |||
| COMP / Compass, Inc. | 0.73 | 4.08 | 4.33 | -31.58 | 0.1970 | -0.0565 | |||
| ACI / Albertsons Companies, Inc. | 0.19 | 411.84 | 4.32 | 407.99 | 0.1966 | 0.1536 | |||
| CART / Maplebear Inc. | 0.09 | -7.55 | 4.25 | 2.76 | 0.1934 | 0.0277 | |||
| ICUI / ICU Medical, Inc. | 0.03 | -45.55 | 4.21 | -49.82 | 0.1914 | -0.1443 | |||
| OMF / OneMain Holdings, Inc. | 0.08 | -66.50 | 4.17 | -67.68 | 0.1897 | -0.3270 | |||
| PNW / Pinnacle West Capital Corporation | 0.05 | -30.40 | 4.11 | -31.39 | 0.1871 | -0.0530 | |||
| MNDY / monday.com Ltd. | 0.01 | 4.05 | 0.1840 | 0.1840 | |||||
| IBKR / Interactive Brokers Group, Inc. | 0.02 | -85.70 | 3.95 | -85.33 | 0.1796 | -0.8977 | |||
| PSBD / Palmer Square Capital BDC Inc. | 0.27 | -23.88 | 3.74 | -30.67 | 0.1700 | -0.0458 | |||
| UTHR / United Therapeutics Corporation | 0.01 | -69.37 | 3.73 | -69.49 | 0.1697 | -0.3198 | |||
| ORA / Ormat Technologies, Inc. | 0.05 | -15.67 | 3.68 | -10.25 | 0.1673 | 0.0032 | |||
| SSD / Simpson Manufacturing Co., Inc. | 0.02 | -13.41 | 3.52 | -18.00 | 0.1600 | -0.0118 | |||
| NWE / NorthWestern Energy Group, Inc. | 0.06 | -15.66 | 3.31 | -16.57 | 0.1505 | -0.0083 | |||
| UWMC / UWM Holdings Corporation | 0.77 | -23.90 | 3.29 | -47.90 | 0.1498 | -0.1033 | |||
| SKT / Tanger Inc. | 0.11 | 63.30 | 3.28 | 37.32 | 0.1489 | 0.0534 | |||
| LBRT / Liberty Energy Inc. | 0.28 | -26.94 | 3.26 | -50.97 | 0.1484 | -0.1180 | |||
| PTC / PTC Inc. | 0.02 | 50.78 | 3.25 | 55.11 | 0.1477 | 0.0639 | |||
| LEGN / Legend Biotech Corporation - Depositary Receipt (Common Stock) | 0.11 | 3.18 | 0.1446 | 0.1446 | |||||
| WTRG / Essential Utilities, Inc. | 0.08 | 2.94 | 0.1335 | 0.1335 | |||||
| NXST / Nexstar Media Group, Inc. | 0.02 | 1.20 | 2.88 | 1.98 | 0.1310 | 0.0179 | |||
| WMG / Warner Music Group Corp. | 0.10 | -11.06 | 2.65 | -30.54 | 0.1203 | -0.0322 | |||
| IRDM / Iridium Communications Inc. | 0.10 | -7.93 | 2.62 | -25.92 | 0.1193 | -0.0224 | |||
| BRDG / Bridge Investment Group Holdings Inc. | 0.29 | -60.78 | 2.62 | -65.61 | 0.1193 | -0.1860 | |||
| DOCS / Doximity, Inc. | 0.04 | -32.84 | 2.34 | -50.37 | 0.1066 | -0.0825 | |||
| IDA / IDACORP, Inc. | 0.02 | -16.07 | 2.24 | -15.34 | 0.1017 | -0.0040 | |||
| CLBT / Cellebrite DI Ltd. | 0.13 | 2.15 | 0.0977 | 0.0977 | |||||
| GTM / ZoomInfo Technologies Inc. | 0.16 | -44.32 | 1.52 | -54.40 | 0.0690 | -0.0642 | |||
| UST BILLS 0% 06/20/2025 / DBT (US912797NV50) | 1.50 | 0.0681 | 0.0681 | ||||||
| FWONK / Formula One Group | 0.01 | -11.48 | 1.04 | -11.39 | 0.0474 | 0.0003 | |||
| E20 / EchoStar Corporation | 0.05 | 0.88 | 0.0400 | 0.0400 | |||||
| PSTG / Pure Storage, Inc. | 0.01 | -23.29 | 0.42 | -21.67 | 0.0193 | -0.0024 | |||
| SARO / StandardAero, Inc. | 0.01 | 0.00 | 0.38 | 4.10 | 0.0173 | 0.0026 | |||
| ETORO GROUP LTD / EC (VGG320891077) | 0.00 | 0.18 | 0.0083 | 0.0083 | |||||
| UST BILLS 0% 08/21/2025 / DBT (US912797PP64) | 0.08 | 0.0036 | 0.0036 | ||||||
| UST BILLS 0% 07/17/2025 / DBT (US912797PE18) | 0.06 | 0.0027 | 0.0027 | ||||||
| CRUS / Cirrus Logic, Inc. | 0.00 | -100.00 | 0.00 | -100.00 | -0.6262 | ||||
| FLYW / Flywire Corporation | 0.00 | -100.00 | 0.00 | -100.00 | -0.2041 | ||||
| BLKB / Blackbaud, Inc. | 0.00 | -100.00 | 0.00 | -100.00 | -0.1765 | ||||
| RPAY / Repay Holdings Corporation | 0.00 | -100.00 | 0.00 | -100.00 | -0.4070 | ||||
| BILL / BILL Holdings, Inc. | 0.00 | -100.00 | 0.00 | -100.00 | -0.1903 | ||||
| EPAM / EPAM Systems, Inc. | 0.00 | -100.00 | 0.00 | -100.00 | -0.4085 | ||||
| BL / BlackLine, Inc. | 0.00 | -100.00 | 0.00 | -100.00 | -0.3662 | ||||
| NRDS / NerdWallet, Inc. | 0.00 | -100.00 | 0.00 | -100.00 | -0.0505 | ||||
| US36164VAA52 / GCI Liberty, Inc. DBT | 0.02 | 0.00 | 0.0000 | 0.0000 | |||||
| S and P MID 400 EMINI FUT JUN25 FAM5 / DE (N/A) | -1.63 | -0.0742 | -0.0742 |