Basic Stats
| Short Interest | 57,139 shares - source: NYSE |
| Short Interest Ratio | 0.08 Days to Cover |
| Off-Exchange Short Volume | 177,033 shares - source: FINRA (inc. Dark Pool volume) |
| Off-Exchange Short Volume Ratio | 31.00 % - source: FINRA (inc. Dark Pool volume) |
Introduction
This short interest tracker provides a variety of short interest related data, sourced from a variety of partners. The data is organized by frequency of updates, with intraday data at the top (short shares availability, short borrow fee rate), daily data (short volume, fails-to-deliver) in the middle, and the slowest updated data (short interest) at the bottom. Note that short interest is published twice-monthly, on a schedule set by FINRA.
Short Squeeze Score
The Short Squeeze Score is the result of a sophisticated, multi-factor quantitative model that identifies companies that have the highest risk of experiencing a short squeeze. The scoring model uses a combination of short interest, float, short borrow fee rates, and other metrics. The number ranges from 0 to 100, with higher numbers indicating a higher risk of a short squeeze relative to its peers, and 50 being the average.
Update Frequency: Intraday
See our Short Squeeze Leaderboards for US, Canada, Australia and Hong Kong
Short Borrow Fee Rates
PML / PIMCO Municipal Income Fund II short borrow fee rates are shown in the following table. This table shows the interest rate that must be paid by a short seller of US:PML to the lender of that security. This fee is shown as an annual percentage rate (APR). Lenders are funds or individuals that own the security that have indicated to the broker that they are willing to lend it out. Dividends paid to a shorted security go to the owner/lender of the security, not to the borrower.
- Start, Min, Max, Latest (Borrow Rates)
- These represent borrow rates for the day, with the rate at the start of the day, the end of the day (or the latest for the current day), the minimum rate in the day, and the maximum rate for the day. Unlike the Options Implied Borrow Rates, our source for this data always presents them as positive numbers, and they represent an annualized interest rate that is paid by the borrower for the shares.
Update Frequency: Intraday every 30 minutes.
Last update
: 21 minutes ago
| Date | Start | Min | Max | Latest |
|---|---|---|---|---|
| 2025-09-05 | 1.10 | 1.10 | 1.12 | 1.12 |
| 2025-09-04 | 1.17 | 1.10 | 1.17 | 1.10 |
| 2025-09-03 | 1.38 | 1.17 | 1.38 | 1.17 |
| 2025-09-02 | 1.42 | 1.38 | 1.42 | 1.38 |
| 2025-09-01 | 1.42 | 1.42 | 1.42 | 1.42 |
| 2025-08-29 | 1.31 | 1.24 | 1.42 | 1.42 |
| 2025-08-28 | 1.20 | 1.20 | 1.32 | 1.31 |
| 2025-08-27 | 1.20 | 1.20 | 1.30 | 1.20 |
| 2025-08-26 | 1.43 | 1.20 | 1.43 | 1.20 |
| 2025-08-25 | 1.32 | 1.32 | 1.62 | 1.43 |
Short Sale Volume (Off-Exchange Provided by FINRA)
PML / PIMCO Municipal Income Fund II off-exchange short sale volume is shown in the following chart. Short Sale volume shows the number of trades marked as short sales in various trading venues. For more information on how to interpret this data, read this information notice provided by FINRA.
Update Frequency: Daily at Close of Day
- FINRA Non-Exempt Volume
- Number of short shares traded. This number is not provided by FINRA but we calculate it by subtracting the "Exempt" from the "Short Volume"
- FINRA Exempt Volume
- Number of short shares sold that were exempt from the uptick rule. This is provided by FINRA. This number is included in both the "Short Volume" and "Total Volume" numbers.
- FINRA Short Volume
- Number of short shares traded reported by FINRA. This includes both the exempt and non-exempt.
- FINRA Total Volume
- Total shares traded off exchange reported by FINRA
- FINRA Short Volume Ratio
- FINRA Short Volume / FINRA Total Volume
| Market Date | FINRA Non-Exempt Volume |
FINRA Exempt Volume |
FINRA Short Volume |
FINRA Total Volume |
FINRA Short Volume Ratio |
||||
|---|---|---|---|---|---|---|---|---|---|
| 2025-09-05 | 177,033 | + | 0 | = | 177,033 | / | 571,118 | = | 31.00 |
| 2025-09-04 | 71,287 | + | 0 | = | 71,287 | / | 401,034 | = | 17.78 |
| 2025-09-03 | 101,371 | + | 0 | = | 101,371 | / | 380,697 | = | 26.63 |
| 2025-09-02 | 68,220 | + | 916 | = | 69,136 | / | 475,103 | = | 14.55 |
| 2025-08-29 | 48,314 | + | 2,770 | = | 51,084 | / | 238,509 | = | 21.42 |
| 2025-08-28 | 94,720 | + | 0 | = | 94,720 | / | 409,628 | = | 23.12 |
| 2025-08-27 | 58,547 | + | 700 | = | 59,247 | / | 282,260 | = | 20.99 |
| 2025-08-26 | 69,865 | + | 6,415 | = | 76,280 | / | 240,625 | = | 31.70 |
| 2025-08-25 | 105,047 | + | 4,613 | = | 109,660 | / | 328,970 | = | 33.33 |
| 2025-08-22 | 118,919 | + | 0 | = | 118,919 | / | 370,597 | = | 32.09 |
Short Sale Volume (Combined Exchange + Off-Exchange )
The combined on-exchange and off-exchange short sale volume for PML / PIMCO Municipal Income Fund II is provided in the table below. In order to calculate an accurate short volume ratio, we gather data from a number of trading venues, but not ALL trading venues. This is important because it means the aggregate short and total volume columns do not show the actual volumes across all trading venues, but just the venues we track.
- FINRA Short Volume
- Number of short shares traded off-exchange reported by FINRA. This includes both the exempt and non-exempt.
- CBOE Short Volume
- Number of short shares traded reported by CBOE
- PSX/BX Short Volume
- Number of short shares traded reported by NASDAQ on the PSX/BX trading venues
- Aggregate Short Volume
- FINRA Short Volume + CBOE Short Volume + PSX/BX Short Volume. This is not the total short volume on all trading venues.
- Aggregate Total Volume
- FINRA Total Volume + CBOE Total Volume + PSX/BX Total Volume. This is not total volume on all trading venues.
- Aggregate Short Volume Ratio
- Aggregate Short Volume / Aggregate Total Volume
* Aggregate short volume and aggregate total volume column does not show the actual total volume across all trading venues, but just the venues we track.
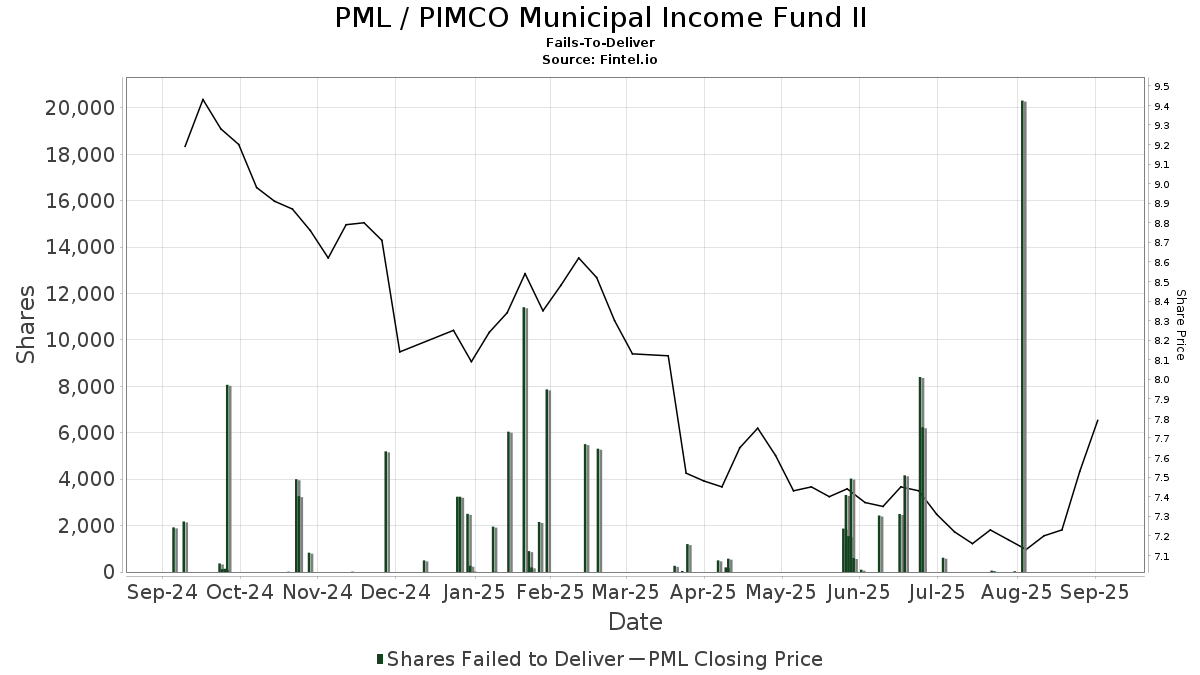
Fails-To-Deliver
The values of total fails-to-deliver shares represent the aggregate net balance of shares that failed to be delivered as of a particular settlement date. Fails to deliver on a given day are a cumulative number of all fails outstanding until that day, plus new fails that occur that day, less fails that settle that day. The figure is not a daily amount of fails, but a combined figure that includes both new fails on the reporting day as well as existing fails. In other words, these numbers reflect aggregate fails as of a specific point in time, and may have little or no relationship to yesterday’s aggregate fails. Thus, it is important to note that the age of fails cannot be determined by looking at these numbers.If all shares were delivered on a particular day, then there will be no entry in the table.
Update Frequency: SEC publishes daily data in batches that are delivered twice monthly and lagged about two weeks. So, for example, daily data for the month of March would arrive around mid April.
This data is NOT split-adjusted - it reflects the raw data provided by the SEC.
| Date | Price | Quantity | Value |
|---|---|---|---|
| 2025-08-08 | 7.22 | 5 | 36.10 |
| 2025-08-07 | 7.23 | 32 | 231.36 |
| 2025-08-06 | 7.25 | 60 | 435.00 |
| 2025-07-18 | 7.27 | 615 | 4,471.05 |
| 2025-07-10 | 7.43 | 6,238 | 46,348.34 |
| 2025-07-09 | 7.44 | 8,401 | 62,503.44 |
| 2025-07-03 | 7.45 | 4,165 | 31,029.25 |
| 2025-07-01 | 7.45 | 2,500 | 18,625.00 |
| 2025-06-23 | 7.34 | 2,435 | 17,872.90 |
| 2025-06-16 | 7.37 | 100 | 737.00 |
| 2025-06-13 | 7.43 | 604 | 4,487.72 |
| 2025-06-12 | 7.44 | 4,026 | 29,953.44 |
| 2025-06-11 | 7.38 | 1,545 | 11,402.10 |
| 2025-06-10 | 7.38 | 3,319 | 24,494.22 |
| 2025-06-09 | 7.38 | 1,871 | 13,807.98 |
| 2025-04-25 | 7.52 | 575 | 4,324.00 |
| 2025-04-24 | 7.45 | 200 | 1,490.00 |
| 2025-04-21 | 7.52 | 501 | 3,767.52 |
| 2025-04-09 | 7.44 | 1,203 | 8,950.32 |
| 2025-04-07 | 8.00 | 45 | 360.00 |
PML Short Interest (Daily Fintel Updates)
This section uses the official NYSE-supplied short interest and provides some value-added metrics, calculated daily. Short Interest is updated twice monthly on set schedule, but float can be updated more frequently (although it does not change every day), so we provide daily updates of the Short Interest % Float for the last fifteen days. Days To Cover is calculated daily based on the most recent five day trading volume.
Update Frequency: Short Interest - Twice Monthly. Float - Daily (although changes infrequently) Short Interest Publication Schedule
This data is split-adjusted.
| Market Date | Short Interest (Shares) |
Days to Cover | Float (MM Shares) |
Float less SI (MM Shares) |
Short Interest % Float |
|---|---|---|---|---|---|
| 2025-09-05 | |||||
| 2025-09-04 | |||||
| 2025-09-03 | |||||
| 2025-09-02 | |||||
| 2025-09-01 | |||||
| 2025-08-29 | |||||
| 2025-08-28 | |||||
| 2025-08-27 | |||||
| 2025-08-26 | |||||
| 2025-08-25 |
Source: Short Interest provided by NYSE-Shares Outstanding and Shares Float provided by Capital IQ.
Short Interest (Official NYSE Data)
This data is the official short interest data, as provided by NYSE. Short Interest is the total number of open short positions of a security. Days to Cover is the short interest divided by the average volume. The Days to Cover listed here is the official value provided by the NYSE and may differ from the Days To Cover published elsewhere on Fintel because we use a shorter lookback period when calculating average volume.
Update Frequency: Twice Monthly
This data is NOT split-adjusted - it reflects the raw data provided by the exchange.
| Settlement Date |
Short Interest | Percent Change | Days to Cover | Float (MM Shares) | Short Interest % of Float |
Shares Outstanding (MM Shares) |
Short Interest % of SO |
|---|---|---|---|---|---|---|---|
| 2025-08-15 | 57,139 | -41.82 | 1.00 | ||||
| 2025-07-31 | 98,217 | 8.45 | 1.00 | ||||
| 2025-07-15 | 90,566 | 159.15 | 1.00 | ||||
| 2025-06-30 | 34,948 | -46.43 | 1.00 | ||||
| 2025-06-13 | 65,243 | -29.39 | 1.00 | ||||
| 2025-05-30 | 92,394 | -45.48 | 1.00 | ||||
| 2025-05-15 | 169,456 | -4.63 | 1.09 | ||||
| 2025-04-30 | 177,689 | 59.48 | 1.00 | ||||
| 2025-04-15 | 111,415 | -13.85 | 1.00 | ||||
| 2025-03-31 | 129,327 | -27.32 | 1.00 | ||||
| 2025-03-14 | 177,947 | -35.06 | 1.36 | ||||
| 2025-02-28 | 274,007 | 7.56 | 1.64 | ||||
| 2025-02-14 | 254,750 | 13.05 | 1.23 | ||||
| 2025-01-31 | 225,344 | 56.76 | 1.28 | ||||
| 2025-01-15 | 143,749 | 461.70 | 1.00 | ||||
| 2024-12-31 | 25,592 | -11.42 | 1.00 | ||||
| 2024-12-13 | 28,890 | 1.38 | 1.00 | ||||
| 2024-11-29 | 28,496 | -83.16 | 1.00 | ||||
| 2024-11-15 | 169,253 | -30.98 | 1.00 | ||||
| 2024-10-31 | 245,220 | 14.39 | 1.67 | ||||
| 2024-10-15 | 214,365 | 8.87 | 1.23 | ||||
| 2024-09-30 | 196,902 | 17.81 | 1.20 | ||||
| 2024-09-13 | 167,132 | 113.52 | 1.00 | ||||
| 2024-08-30 | 78,275 | 166.92 | 1.00 | ||||
| 2024-08-15 | 29,325 | 13.43 | 1.00 | ||||
| 2024-07-31 | 25,854 | -60.10 | 1.00 | ||||
| 2024-07-15 | 64,802 | -32.37 | 1.00 | ||||
| 2024-06-28 | 95,815 | -27.93 | 1.00 | ||||
| 2024-06-14 | 132,952 | 19.10 | 1.00 | ||||
| 2024-05-31 | 111,634 | 80.86 | 1.00 | ||||
| 2024-05-15 | 61,725 | -13.10 | 1.00 | ||||
| 2024-04-30 | 71,026 | -71.20 | 1.00 | ||||
| 2024-04-15 | 246,597 | 527.12 | 1.30 | ||||
| 2024-03-28 | 39,322 | 100.76 | 1.00 | ||||
| 2024-03-15 | 19,587 | -64.66 | 1.00 | ||||
| 2024-02-29 | 55,429 | 28.58 | 1.00 | ||||
| 2024-02-15 | 43,110 | -29.54 | 1.00 | ||||
| 2024-01-31 | 61,187 | 45.00 | 1.00 | ||||
| 2024-01-12 | 42,199 | 297.39 | 1.00 | ||||
| 2023-12-29 | 10,619 | -69.11 | 1.00 | ||||
| 2023-12-15 | 34,374 | 57.40 | 1.00 | ||||
| 2023-11-30 | 21,838 | -44.61 | 1.00 | ||||
| 2023-11-15 | 39,423 | 9.37 | 1.00 | ||||
| 2023-10-31 | 36,044 | 8.08 | 1.00 | ||||
| 2023-10-13 | 33,348 | -50.87 | 1.00 | ||||
| 2023-09-29 | 67,876 | -48.77 | 1.00 | ||||
| 2023-09-15 | 132,490 | -12.18 | 1.00 | ||||
| 2023-08-31 | 150,872 | -11.80 | 1.00 | ||||
| 2023-08-15 | 171,052 | 19.57 | 1.13 | ||||
| 2023-07-31 | 143,053 | 73.40 | 1.24 | ||||
| 2023-07-14 | 82,500 | -14.36 | 1.00 | ||||
| 2023-06-30 | 96,335 | -49.68 | 1.00 | ||||
| 2023-06-15 | 191,450 | -15.01 | 1.35 | ||||
| 2023-05-31 | 225,255 | 105.28 | 1.67 | ||||
| 2023-05-15 | 109,733 | -6.52 | 1.00 | ||||
| 2023-04-28 | 117,391 | 53.68 | 1.00 | ||||
| 2023-04-14 | 76,386 | -19.09 | 1.00 | ||||
| 2023-03-31 | 94,412 | -8.02 | 1.00 | ||||
| 2023-03-15 | 102,648 | -46.20 | 1.00 | ||||
| 2023-02-28 | 190,784 | 280.12 | 1.00 | ||||
| 2023-02-15 | 50,191 | 82.04 | 1.00 | ||||
| 2023-01-31 | 27,571 | 57.06 | 1.00 | ||||
| 2023-01-13 | 17,554 | -84.55 | 1.00 | ||||
| 2022-12-30 | 113,619 | 54.81 | 1.00 | ||||
| 2022-12-15 | 73,393 | 47.50 | 1.00 | ||||
| 2022-11-30 | 49,759 | -53.99 | 1.00 | ||||
| 2022-11-15 | 108,158 | -49.02 | 1.00 | ||||
| 2022-10-31 | 212,170 | -43.87 | 1.00 | ||||
| 2022-10-14 | 377,996 | -19.28 | 1.93 | ||||
| 2022-09-30 | 468,259 | 108.06 | 1.74 | ||||
| 2022-09-15 | 225,065 | -17.02 | 1.32 | ||||
| 2022-08-31 | 271,244 | -4.24 | 2.05 | ||||
| 2022-08-15 | 283,248 | 127.47 | 1.73 | ||||
| 2022-07-29 | 124,519 | -7.75 | 1.13 | ||||
| 2022-07-15 | 134,976 | -9.11 | 1.00 | ||||
| 2022-06-30 | 148,505 | -28.50 | 1.00 | ||||
| 2022-06-15 | 207,704 | -8.28 | 1.01 | ||||
| 2022-05-31 | 226,449 | 45.97 | 1.00 | ||||
| 2022-05-13 | 155,130 | 25.28 | 1.00 | ||||
| 2022-04-29 | 123,826 | 593.47 | 1.00 | ||||
| 2022-04-14 | 17,856 | 113.97 | 1.00 | ||||
| 2022-03-31 | 8,345 | -51.94 | 1.00 | ||||
| 2022-03-15 | 17,363 | -78.52 | 1.00 | ||||
| 2022-02-28 | 80,823 | -42.81 | 1.00 | ||||
| 2022-02-15 | 141,325 | 62.52 | 1.18 | ||||
| 2022-01-31 | 86,961 | -32.84 | 1.00 | ||||
| 2022-01-14 | 129,485 | 72.98 | 1.07 | ||||
| 2021-12-31 | 74,855 | -52.84 | 1.00 | ||||
| 2021-12-15 | 158,724 | 105.81 | 1.69 | ||||
| 2021-11-30 | 77,120 | 248.30 | 1.04 | ||||
| 2021-11-15 | 22,142 | -16.33 | 1.00 | ||||
| 2021-10-29 | 26,462 | -83.73 | 1.00 | ||||
| 2021-10-15 | 162,619 | -29.12 | 1.95 | ||||
| 2021-09-30 | 229,413 | 72.82 | 2.23 | ||||
| 2021-09-15 | 132,749 | -6.44 | 1.73 | ||||
| 2021-08-31 | 141,888 | 28.63 | 2.78 | ||||
| 2021-08-13 | 110,310 | -11.67 | 1.67 | ||||
| 2021-07-30 | 124,886 | -19.56 | 2.03 | ||||
| 2021-07-15 | 155,254 | -12.69 | 1.91 | ||||
| 2021-06-30 | 177,823 | 11.21 | 2.07 | ||||
| 2021-06-15 | 159,899 | -17.75 | 1.86 | ||||
| 2021-05-28 | 194,409 | -5.28 | 3.37 | ||||
| 2021-05-14 | 205,241 | -15.60 | 2.48 | ||||
| 2021-04-30 | 243,176 | -2.81 | 4.03 | ||||
| 2021-04-15 | 250,203 | -4.24 | 3.49 | ||||
| 2021-03-31 | 261,285 | 9.65 | 3.76 | ||||
| 2021-03-15 | 238,293 | 38.84 | 2.31 | ||||
| 2021-02-26 | 171,637 | -4.69 | 1.49 | ||||
| 2021-02-12 | 180,076 | 26.22 | 1.71 | ||||
| 2021-01-29 | 142,674 | -10.33 | 2.04 | ||||
| 2021-01-15 | 159,107 | -3.62 | 1.62 |
Source: Short Interest provided by NYSE-Shares Outstanding and Shares Float provided by Capital IQ.