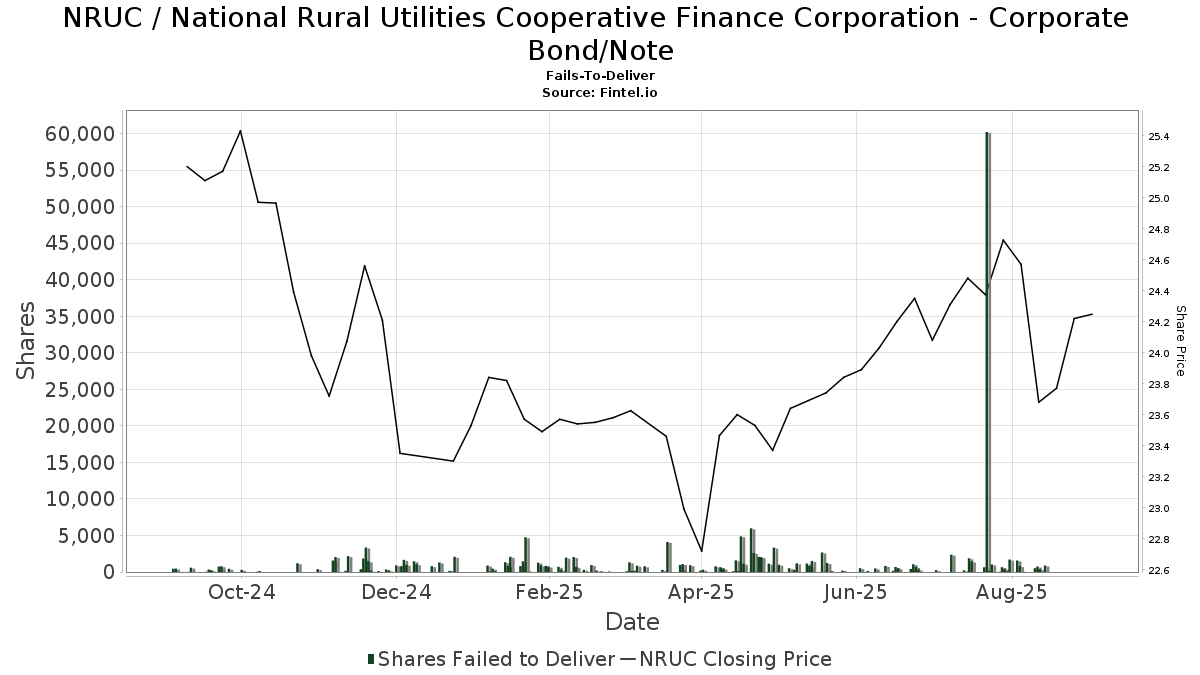
Fails-To-Deliver
The values of total fails-to-deliver shares represent the aggregate net balance of shares that failed to be delivered as of a particular settlement date. Fails to deliver on a given day are a cumulative number of all fails outstanding until that day, plus new fails that occur that day, less fails that settle that day. The figure is not a daily amount of fails, but a combined figure that includes both new fails on the reporting day as well as existing fails. In other words, these numbers reflect aggregate fails as of a specific point in time, and may have little or no relationship to yesterday’s aggregate fails. Thus, it is important to note that the age of fails cannot be determined by looking at these numbers. If all shares were delivered on a particular day, then there will be no entry in the table.
Update Frequency: SEC publishes daily data in batches that are delivered twice monthly and lagged about two weeks. So, for example, daily data for the month of March would arrive on our around mid April.
| Date | Price | Quantity | Value |
|---|---|---|---|
| 24.73 | 79 | 1,953.67 | |
| 24.50 | 456 | 11,172.00 | |
| 24.50 | 655 | 16,047.50 | |
| 24.45 | 33 | 806.85 | |
| 24.37 | 1,033 | 25,174.21 | |
| 24.37 | 148 | 3,606.76 | |
| 24.36 | 60,218 | 1,466,910.48 | |
| 24.46 | 651 | 15,923.46 | |
| 24.48 | 1,449 | 35,471.52 | |
| 24.45 | 1,876 | 45,868.20 | |
| 24.35 | 227 | 5,527.45 | |
| 24.28 | 2,366 | 57,446.48 | |
| 24.08 | 255 | 6,140.40 | |
| 24.35 | 347 | 8,449.45 | |
| 24.22 | 696 | 16,857.12 | |
| 24.13 | 1,064 | 25,674.32 | |
| 24.25 | 419 | 10,160.75 | |
| 24.01 | 503 | 12,077.03 | |
| 23.86 | 685 | 16,344.10 | |
| 24.05 | 163 | 3,920.15 | |
| 24.19 | 835 | 20,198.65 | |
| 24.00 | 42 | 1,008.00 | |
| 23.93 | 490 | 11,725.70 | |
| 23.89 | 142 | 3,392.38 | |
| 23.82 | 12 | 285.84 | |
| 23.80 | 524 | 12,471.20 | |
| 23.92 | 86 | 2,057.12 | |
| 23.89 | 193 | 4,610.77 | |
| 23.92 | 110 | 2,631.20 | |
| 23.76 | 1,226 | 29,129.76 | |
| 23.72 | 43 | 1,019.96 | |
| 23.99 | 2,672 | 64,101.28 | |
| 23.69 | 1,500 | 35,535.00 | |
| 23.78 | 836 | 19,880.08 | |
| 23.54 | 1,152 | 27,118.08 | |
| 23.43 | 1,187 | 27,811.41 | |
| 23.64 | 293 | 6,926.52 | |
| 23.94 | 520 | 12,448.80 | |
| 23.52 | 1,000 | 23,520.00 | |
| 23.41 | 3,338 | 78,142.58 | |
| 23.61 | 1,135 | 26,797.35 | |
| 23.47 | 2,037 | 47,808.39 | |
| 23.53 | 2,064 | 48,565.92 | |
| 23.33 | 2,601 | 60,681.33 | |
| 23.29 | 5,978 | 139,227.62 | |
| 23.15 | 1,144 | 26,483.60 | |
| 23.60 | 4,880 | 115,168.00 | |
| 23.74 | 116 | 2,753.84 | |
| 23.76 | 1,597 | 37,944.72 | |
| 23.60 | 104 | 2,454.40 |


