Basic Stats
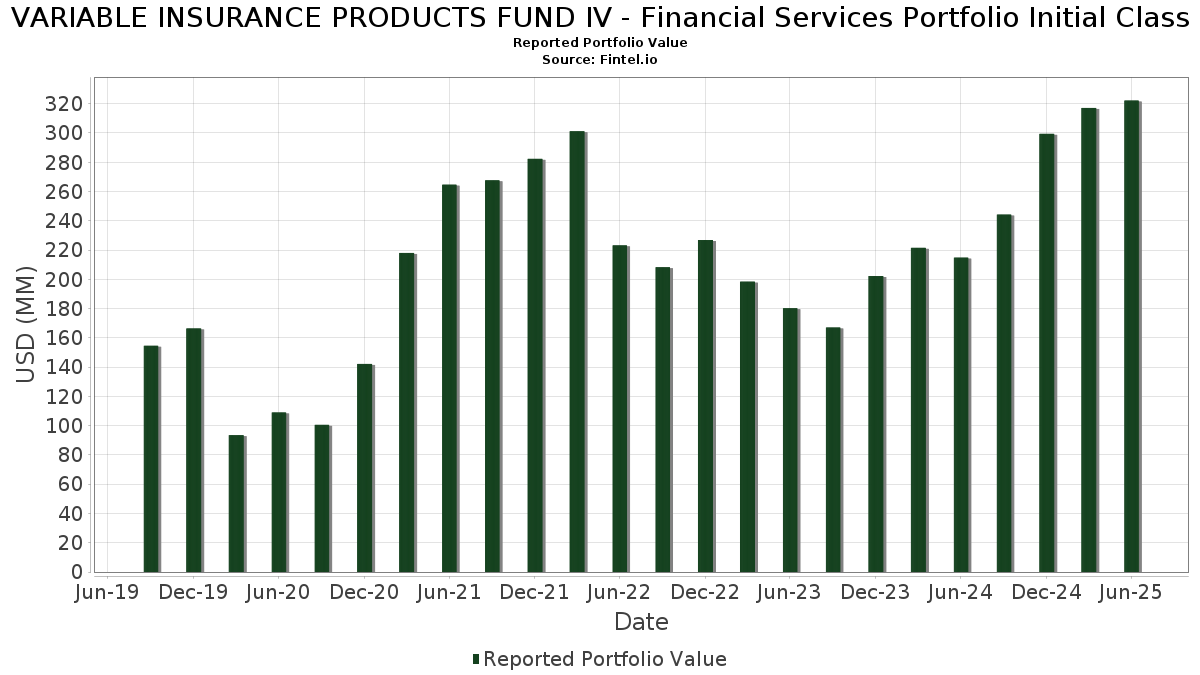
| Portfolio Value | $ 322,137,723 |
| Current Positions | 67 |
Latest Holdings, Performance, AUM (from 13F, 13D)
VARIABLE INSURANCE PRODUCTS FUND IV - Financial Services Portfolio Initial Class has disclosed 67 total holdings in their latest SEC filings. Most recent portfolio value is calculated to be $ 322,137,723 USD. Actual Assets Under Management (AUM) is this value plus cash (which is not disclosed). VARIABLE INSURANCE PRODUCTS FUND IV - Financial Services Portfolio Initial Class’s top holdings are Mastercard Incorporated (US:MA) , Wells Fargo & Company (US:WFC) , Bank of America Corporation (US:BAC) , Citigroup Inc. (US:C) , and Reinsurance Group of America, Incorporated (US:RGA) . VARIABLE INSURANCE PRODUCTS FUND IV - Financial Services Portfolio Initial Class’s new positions include Brown & Brown, Inc. (US:BRO) , PayPal Holdings, Inc. (US:PYPL) , .
Top Increases This Quarter
We use the change in the portfolio allocation because this is the most meaningful metric. Changes can be due to trades or changes in share prices.
| Security | Shares (MM) |
Value (MM$) |
Portfolio % | ΔPortfolio % |
|---|---|---|---|---|
| 0.03 | 7.11 | 2.2107 | 2.2107 | |
| 0.04 | 4.80 | 1.4918 | 1.4918 | |
| 0.05 | 3.70 | 1.1501 | 1.1501 | |
| 0.13 | 5.75 | 1.7861 | 1.0865 | |
| 0.06 | 3.71 | 1.1522 | 0.6794 | |
| 0.05 | 30.46 | 9.4645 | 0.6458 | |
| 0.38 | 17.93 | 5.5716 | 0.5782 | |
| 0.08 | 8.14 | 2.5279 | 0.5580 | |
| 0.04 | 3.84 | 1.1923 | 0.4657 | |
| 0.15 | 3.59 | 1.1166 | 0.4558 |
Top Decreases This Quarter
We use the change in the portfolio allocation because this is the most meaningful metric. Changes can be due to trades or changes in share prices.
| Security | Shares (MM) |
Value (MM$) |
Portfolio % | ΔPortfolio % |
|---|---|---|---|---|
| 0.35 | 0.35 | 0.1094 | -4.0319 | |
| 0.01 | 1.73 | 0.5367 | -1.8657 | |
| 0.95 | 0.95 | 0.2947 | -0.8282 | |
| 0.06 | 2.56 | 0.7968 | -0.7372 | |
| 0.03 | 3.63 | 1.1270 | -0.7030 | |
| 0.01 | 3.71 | 1.1536 | -0.6729 | |
| 0.08 | 3.67 | 1.1413 | -0.3208 | |
| 0.02 | 5.06 | 1.5717 | -0.2760 | |
| 0.07 | 2.34 | 0.7270 | -0.2357 | |
| 0.06 | 11.45 | 3.5567 | -0.1967 |
13F and Fund Filings
This form was filed on 2025-08-22 for the reporting period 2025-06-30. Click the link icon to see the full transaction history.
Upgrade to unlock premium data and export to Excel ![]() .
.
| Security | Type | Avg Share Price | Shares (MM) |
ΔShares (%) |
ΔShares (%) |
Value ($MM) |
Portfolio (%) |
ΔPortfolio (%) |
|
|---|---|---|---|---|---|---|---|---|---|
| MA / Mastercard Incorporated | 0.05 | 11.29 | 30.46 | 14.10 | 9.4645 | 0.6458 | |||
| WFC / Wells Fargo & Company | 0.26 | 0.00 | 20.63 | 11.60 | 6.4104 | 0.3038 | |||
| BAC / Bank of America Corporation | 0.38 | 4.61 | 17.93 | 18.63 | 5.5716 | 0.5782 | |||
| C / Citigroup Inc. | 0.14 | -6.67 | 12.03 | 11.91 | 3.7375 | 0.1867 | |||
| RGA / Reinsurance Group of America, Incorporated | 0.06 | 0.00 | 11.45 | 0.74 | 3.5567 | -0.1967 | |||
| SCHW / The Charles Schwab Corporation | 0.12 | -5.18 | 11.19 | 10.52 | 3.4760 | 0.1322 | |||
| CB / Chubb Limited | 0.03 | 8.71 | 9.76 | 4.29 | 3.0340 | -0.0588 | |||
| STT / State Street Corporation | 0.08 | 14.86 | 8.14 | 36.45 | 2.5279 | 0.5580 | |||
| MS / Morgan Stanley | 0.06 | -2.65 | 7.78 | 17.54 | 2.4162 | 0.2308 | |||
| COF / Capital One Financial Corporation | 0.03 | 7.11 | 2.2107 | 2.2107 | |||||
| NDAQ / Nasdaq, Inc. | 0.07 | 7.34 | 6.54 | 26.52 | 2.0312 | 0.3245 | |||
| APO / Apollo Global Management, Inc. | 0.05 | 9.13 | 6.44 | 13.06 | 2.0015 | 0.1195 | |||
| TFC / Truist Financial Corporation | 0.13 | 240.20 | 5.75 | 275.38 | 1.7861 | 1.0865 | |||
| NTRS / Northern Trust Corporation | 0.05 | 0.00 | 5.73 | 28.53 | 1.7809 | 0.3078 | |||
| USB / U.S. Bancorp | 0.12 | -2.68 | 5.58 | 4.30 | 1.7338 | -0.0335 | |||
| SLM / SLM Corporation | 0.17 | -5.71 | 5.42 | 5.27 | 1.6833 | -0.0167 | |||
| MTB / M&T Bank Corporation | 0.03 | -2.87 | 5.24 | 5.41 | 1.6294 | -0.0140 | |||
| FI / Fiserv, Inc. | 0.03 | 31.70 | 5.09 | 2.83 | 1.5805 | -0.0537 | |||
| AJG / Arthur J. Gallagher & Co. | 0.02 | -2.47 | 5.06 | -9.57 | 1.5717 | -0.2760 | |||
| VOYA / Voya Financial, Inc. | 0.07 | 6.71 | 4.86 | 11.81 | 1.5091 | 0.0742 | |||
| BRO / Brown & Brown, Inc. | 0.04 | 4.80 | 1.4918 | 1.4918 | |||||
| H2X3 / Hiscox Ltd | 0.27 | -3.08 | 4.66 | 9.92 | 1.4470 | 0.0473 | |||
| AIZ / Assurant, Inc. | 0.02 | 50.32 | 4.60 | 41.53 | 1.4299 | 0.3558 | |||
| MCO / Moody's Corporation | 0.01 | -4.21 | 4.56 | 3.16 | 1.4184 | -0.0432 | |||
| MKTX / MarketAxess Holdings Inc. | 0.02 | 3.14 | 4.40 | 6.46 | 1.3672 | 0.0021 | |||
| AFG / American Financial Group, Inc. | 0.03 | 7.99 | 4.27 | 3.77 | 1.3256 | -0.0325 | |||
| BPOP / Popular, Inc. | 0.04 | -20.13 | 4.11 | -4.71 | 1.2774 | -0.1477 | |||
| OMF / OneMain Holdings, Inc. | 0.07 | -19.21 | 4.08 | -5.78 | 1.2665 | -0.1627 | |||
| TRU / TransUnion | 0.04 | 64.53 | 3.84 | 74.44 | 1.1923 | 0.4657 | |||
| CG / The Carlyle Group Inc. | 0.07 | -4.51 | 3.81 | 12.60 | 1.1836 | 0.0661 | |||
| LPLA / LPL Financial Holdings Inc. | 0.01 | -41.42 | 3.71 | -32.85 | 1.1536 | -0.6729 | |||
| FAF / First American Financial Corporation | 0.06 | 251.16 | 3.71 | 226.61 | 1.1522 | 0.6794 | |||
| PYPL / PayPal Holdings, Inc. | 0.05 | 3.70 | 1.1501 | 1.1501 | |||||
| VIRT / Virtu Financial, Inc. | 0.08 | -29.37 | 3.67 | -17.02 | 1.1413 | -0.3208 | |||
| FCFS / FirstCash Holdings, Inc. | 0.03 | -41.70 | 3.63 | -34.54 | 1.1270 | -0.7030 | |||
| AUB / AUB Group Limited | 0.15 | 49.13 | 3.59 | 79.65 | 1.1166 | 0.4558 | |||
| UMBF / UMB Financial Corporation | 0.03 | -4.90 | 3.47 | -1.08 | 1.0782 | -0.0806 | |||
| BWIN / The Baldwin Insurance Group, Inc. | 0.08 | -3.77 | 3.39 | -7.81 | 1.0529 | -0.1614 | |||
| CPAY / Corpay, Inc. | 0.01 | 60.66 | 3.25 | 52.84 | 1.0105 | 0.3077 | |||
| LNH / Lancashire Holdings Limited | 0.40 | 6.04 | 3.19 | 12.09 | 0.9910 | 0.0511 | |||
| EWBC / East West Bancorp, Inc. | 0.03 | -13.77 | 3.16 | -3.01 | 0.9822 | -0.0943 | |||
| ONB / Old National Bancorp | 0.15 | -4.10 | 3.15 | -3.44 | 0.9781 | -0.0986 | |||
| LAZ / Lazard, Inc. | 0.06 | 0.00 | 3.06 | 10.80 | 0.9497 | 0.0385 | |||
| FIBK / First Interstate BancSystem, Inc. | 0.11 | 16.38 | 3.03 | 17.03 | 0.9419 | 0.0865 | |||
| RJF / Raymond James Financial, Inc. | 0.02 | 77.63 | 2.98 | 96.12 | 0.9270 | 0.4245 | |||
| ASB / Associated Banc-Corp | 0.11 | -1.46 | 2.63 | 6.66 | 0.8163 | 0.0027 | |||
| AB / AllianceBernstein Holding L.P. - Limited Partnership | 0.06 | -48.18 | 2.56 | -44.78 | 0.7968 | -0.7372 | |||
| KEY / KeyCorp | 0.14 | -1.00 | 2.42 | 7.85 | 0.7514 | 0.0107 | |||
| EBC / Eastern Bankshares, Inc. | 0.16 | -3.13 | 2.41 | -9.80 | 0.7497 | -0.1340 | |||
| US21871X1090 / Corebridge Financial, Inc. | 0.07 | -28.60 | 2.34 | -19.70 | 0.7270 | -0.2357 | |||
| BOKF / BOK Financial Corporation | 0.02 | 0.44 | 2.25 | -5.86 | 0.6991 | -0.0903 | |||
| BRDG / Bridge Investment Group Holdings Inc. | 0.20 | 0.35 | 1.99 | 4.84 | 0.6196 | -0.0086 | |||
| WSBC / WesBanco, Inc. | 0.06 | -5.97 | 1.79 | -3.91 | 0.5573 | -0.0595 | |||
| FHB / First Hawaiian, Inc. | 0.07 | 1.00 | 1.77 | 3.14 | 0.5507 | -0.0169 | |||
| MMC / Marsh & McLennan Companies, Inc. | 0.01 | -73.49 | 1.73 | -76.25 | 0.5367 | -1.8657 | |||
| UCB / United Community Banks, Inc. | 0.06 | 2.18 | 1.68 | 8.26 | 0.5212 | 0.0091 | |||
| PAX / Patria Investments Limited | 0.12 | -26.23 | 1.63 | -8.14 | 0.5051 | -0.0794 | |||
| BOLSAA / Bolsa Mexicana de Valores SAB de CV | 0.70 | -0.06 | 1.60 | 37.86 | 0.4959 | 0.1136 | |||
| SF / Stifel Financial Corp. | 0.02 | 2.68 | 1.59 | 13.03 | 0.4934 | 0.0294 | |||
| ZION / Zions Bancorporation, National Association | 0.03 | 2.41 | 1.55 | 6.69 | 0.4810 | 0.0016 | |||
| TCBK / TriCo Bancshares | 0.04 | 0.00 | 1.42 | 1.36 | 0.4416 | -0.0219 | |||
| PWP / Perella Weinberg Partners | 0.06 | 2.95 | 1.22 | 8.65 | 0.3790 | 0.0082 | |||
| WTFC / Wintrust Financial Corporation | 0.01 | 0.00 | 1.17 | 10.22 | 0.3621 | 0.0129 | |||
| CADE / Cadence Bank | 0.03 | 0.00 | 1.12 | 5.38 | 0.3469 | -0.0032 | |||
| US31635A1051 / Fidelity Cash Central Fund | 0.95 | -72.10 | 0.95 | -72.10 | 0.2947 | -0.8282 | |||
| US31635A3032 / Fidelity Securities Lending Cash Central Fund | 0.35 | -97.19 | 0.35 | -97.20 | 0.1094 | -4.0319 | |||
| HBAN / Huntington Bancshares Incorporated | 0.00 | 0.00 | 0.01 | 10.00 | 0.0035 | 0.0002 |