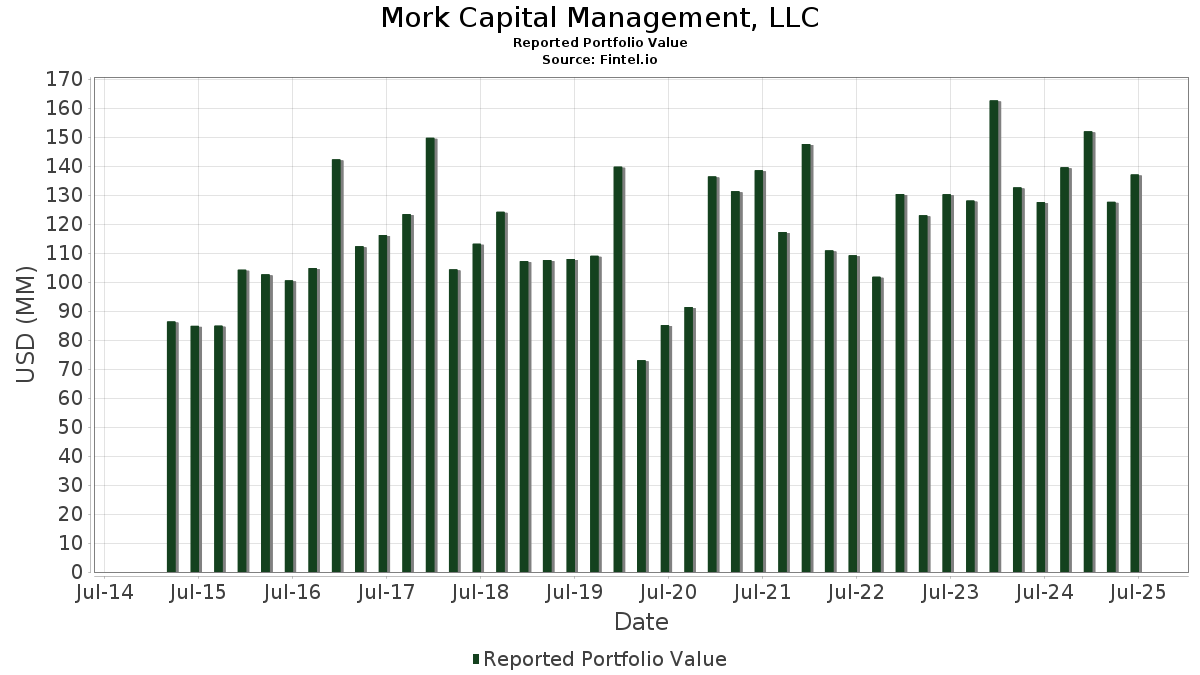
Basic Stats
| Portfolio Value | $ 137,081,236 |
| Current Positions | 109 |
Latest Holdings, Performance, AUM (from 13F, 13D)
Mork Capital Management, LLC has disclosed 109 total holdings in their latest SEC filings. Most recent portfolio value is calculated to be $ 137,081,236 USD. Actual Assets Under Management (AUM) is this value plus cash (which is not disclosed). Mork Capital Management, LLC’s top holdings are Abercrombie & Fitch Co. (US:ANF) , Lincoln National Corporation (US:LNC) , McKesson Corporation (US:MCK) , Air Lease Corporation (US:AL) , and Premier, Inc. (US:PINC) . Mork Capital Management, LLC’s top industries are "Petroleum Refining And Related Industries" (sic 29) , "Miscellaneous Manufacturing Industries" (sic 39) , and "Transportation Services" (sic 47) .
Top Increases This Quarter
We use the change in the portfolio allocation because this is the most meaningful metric. Changes can be due to trades or changes in share prices.
| Security | Shares (MM) |
Value (MM$) |
Portfolio % | ΔPortfolio % |
|---|---|---|---|---|
| 0.09 | 3.00 | 2.1878 | 1.1562 | |
| 0.04 | 3.73 | 2.7197 | 0.9253 | |
| 0.11 | 1.68 | 1.2233 | 0.6055 | |
| 0.03 | 2.43 | 1.7750 | 0.5739 | |
| 0.05 | 2.08 | 1.5210 | 0.5626 | |
| 0.04 | 1.88 | 1.3749 | 0.5166 | |
| 0.09 | 1.42 | 1.0353 | 0.4830 | |
| 0.25 | 1.32 | 0.9611 | 0.3937 | |
| 0.10 | 0.86 | 0.6281 | 0.3473 | |
| 0.18 | 0.62 | 0.4530 | 0.3129 |
Top Decreases This Quarter
We use the change in the portfolio allocation because this is the most meaningful metric. Changes can be due to trades or changes in share prices.
| Security | Shares (MM) |
Value (MM$) |
Portfolio % | ΔPortfolio % |
|---|---|---|---|---|
| 0.07 | 1.36 | 0.9919 | -0.6916 | |
| 0.03 | 1.39 | 1.0130 | -0.4200 | |
| 0.07 | 0.23 | 0.1676 | -0.2828 | |
| 0.02 | 0.72 | 0.5249 | -0.2825 | |
| 0.04 | 2.12 | 1.5457 | -0.2752 | |
| 0.01 | 2.27 | 1.6582 | -0.2511 | |
| 0.03 | 0.57 | 0.4156 | -0.2466 | |
| 0.05 | 0.61 | 0.4457 | -0.2290 | |
| 0.02 | 0.83 | 0.6069 | -0.2179 | |
| 0.17 | 0.72 | 0.5225 | -0.2173 |
13D/G Filings
This is a list of 13D and 13G filings made in the last year (if any). Click the link icon to see the full transaction history. Green rows indicate new positions. Red rows indicate closed positions.
| File Date | Form | Security | Prev Shares |
Current Shares |
ΔShares % | % Ownership |
% ΔOwnership | |
|---|---|---|---|---|---|---|---|---|
| 2025-06-27 | NSFDF / NXT Energy Solutions Inc. | 30,526,321 | 30,526,321 | 0.00 | 28.00 | -14.06 |
13F and Fund Filings
This form was filed on 2025-08-14 for the reporting period 2025-06-30. Click the link icon to see the full transaction history.
Upgrade to unlock premium data and export to Excel ![]() .
.
| Security | Type | Avg Share Price | Shares (MM) |
ΔShares (%) |
ΔShares (%) |
Value ($MM) |
Portfolio (%) |
ΔPortfolio (%) |
|
|---|---|---|---|---|---|---|---|---|---|
| ANF / Abercrombie & Fitch Co. | 0.04 | 50.00 | 3.73 | 62.72 | 2.7197 | 0.9253 | |||
| LNC / Lincoln National Corporation | 0.09 | 136.31 | 3.00 | 127.71 | 2.1878 | 1.1562 | |||
| MCK / McKesson Corporation | 0.00 | 0.00 | 2.93 | 8.92 | 2.1382 | 0.0298 | |||
| AL / Air Lease Corporation | 0.04 | 0.00 | 2.63 | 21.12 | 1.9201 | 0.2174 | |||
| PINC / Premier, Inc. | 0.12 | 0.00 | 2.62 | 13.71 | 1.9127 | 0.1073 | |||
| BGC / BGC Group, Inc. | 0.25 | 0.00 | 2.56 | 11.56 | 1.8657 | 0.0701 | |||
| CMCSA / Comcast Corporation | 0.07 | 0.00 | 2.51 | -3.28 | 1.8285 | -0.2012 | |||
| ACU / Acme United Corporation | 0.06 | 0.00 | 2.49 | 4.67 | 1.8143 | -0.0472 | |||
| GOOGL / Alphabet Inc. | 0.01 | 0.00 | 2.47 | 14.00 | 1.7998 | 0.1042 | |||
| CNR / Core Natural Resources, Inc. | 0.03 | 75.41 | 2.43 | 58.71 | 1.7750 | 0.5739 | |||
| MET / MetLife, Inc. | 0.03 | 0.00 | 2.41 | 0.17 | 1.7600 | -0.1266 | |||
| FDX / FedEx Corporation | 0.01 | 0.00 | 2.27 | -6.73 | 1.6582 | -0.2511 | |||
| AN / AutoNation, Inc. | 0.01 | 0.00 | 2.19 | 22.68 | 1.5941 | 0.1990 | |||
| CI / The Cigna Group | 0.01 | 0.00 | 2.15 | 0.47 | 1.5675 | -0.1074 | |||
| KBH / KB Home | 0.04 | 0.00 | 2.12 | -8.86 | 1.5457 | -0.2752 | |||
| MGA / Magna International Inc. | 0.05 | 50.00 | 2.08 | 70.40 | 1.5210 | 0.5626 | |||
| ABG / Asbury Automotive Group, Inc. | 0.01 | 0.00 | 1.96 | 8.07 | 1.4269 | 0.0086 | |||
| OI / O-I Glass, Inc. | 0.13 | 0.00 | 1.92 | 28.53 | 1.4000 | 0.2303 | |||
| GM / General Motors Company | 0.04 | 64.38 | 1.88 | 72.05 | 1.3749 | 0.5166 | |||
| ARW / Arrow Electronics, Inc. | 0.01 | 0.00 | 1.78 | 22.78 | 1.3014 | 0.1629 | |||
| XRAY / DENTSPLY SIRONA Inc. | 0.11 | 100.00 | 1.68 | 112.69 | 1.2233 | 0.6055 | |||
| GILD / Gilead Sciences, Inc. | 0.01 | 0.00 | 1.66 | -1.01 | 1.2132 | -0.1032 | |||
| TEX / Terex Corporation | 0.04 | 0.00 | 1.63 | 23.60 | 1.1921 | 0.1564 | |||
| ALK / Alaska Air Group, Inc. | 0.03 | 0.00 | 1.61 | 0.56 | 1.1767 | -0.0800 | |||
| QCOM / QUALCOMM Incorporated | 0.01 | 0.00 | 1.59 | 3.65 | 1.1618 | -0.0413 | |||
| PRU / Prudential Financial, Inc. | 0.01 | 0.00 | 1.57 | -3.80 | 1.1443 | -0.1328 | |||
| CVS / CVS Health Corporation | 0.02 | 0.00 | 1.55 | 1.84 | 1.1322 | -0.0617 | |||
| MS / Morgan Stanley | 0.01 | 0.00 | 1.50 | 20.74 | 1.0964 | 0.1214 | |||
| DLX / Deluxe Corporation | 0.09 | 100.00 | 1.42 | 101.28 | 1.0353 | 0.4830 | |||
| BMY / Bristol-Myers Squibb Company | 0.03 | 0.00 | 1.39 | -24.11 | 1.0130 | -0.4200 | |||
| MT / ArcelorMittal S.A. - Depositary Receipt (Common Stock) | 0.04 | 0.00 | 1.36 | 9.47 | 0.9952 | 0.0191 | |||
| ODP / The ODP Corporation | 0.07 | -50.00 | 1.36 | -36.76 | 0.9919 | -0.6916 | |||
| DIN / Dine Brands Global, Inc. | 0.06 | 0.00 | 1.34 | 4.61 | 0.9762 | -0.0262 | |||
| GES / Guess?, Inc. | 0.11 | 0.00 | 1.33 | 9.20 | 0.9702 | 0.0164 | |||
| XRX / Xerox Holdings Corporation | 0.25 | 66.67 | 1.32 | 81.91 | 0.9611 | 0.3937 | |||
| MCFT / MasterCraft Boat Holdings, Inc. | 0.07 | 16.67 | 1.30 | 25.85 | 0.9488 | 0.1395 | |||
| UGI / UGI Corporation | 0.04 | 0.00 | 1.30 | 10.17 | 0.9485 | 0.0238 | |||
| HAS / Hasbro, Inc. | 0.02 | 0.00 | 1.30 | 20.06 | 0.9478 | 0.1002 | |||
| HSBC / HSBC Holdings plc - Depositary Receipt (Common Stock) | 0.02 | 0.00 | 1.23 | 5.92 | 0.9002 | -0.0129 | |||
| AAPL / Apple Inc. | 0.01 | 0.00 | 1.23 | -7.58 | 0.8980 | -0.1459 | |||
| DELL / Dell Technologies Inc. | 0.01 | 0.00 | 1.23 | 34.58 | 0.8944 | 0.1804 | |||
| ADT / ADT Inc. | 0.14 | 0.00 | 1.22 | 4.02 | 0.8867 | -0.0282 | |||
| TKR / The Timken Company | 0.02 | 0.00 | 1.20 | 0.92 | 0.8786 | -0.0559 | |||
| CRDA / Crawford & Co. - Class A | 0.10 | 0.00 | 1.19 | 0.00 | 0.8703 | -0.0641 | |||
| HOG / Harley-Davidson, Inc. | 0.05 | 0.00 | 1.18 | -6.50 | 0.8608 | -0.1280 | |||
| UTHR / United Therapeutics Corporation | 0.00 | 0.00 | 1.18 | -6.73 | 0.8594 | -0.1305 | |||
| CNH / CNH Industrial N.V. | 0.09 | 0.00 | 1.17 | 5.53 | 0.8502 | -0.0147 | |||
| BFH / Bread Financial Holdings, Inc. | 0.02 | 0.00 | 1.17 | 14.10 | 0.8500 | 0.0499 | |||
| IVZ / Invesco Ltd. | 0.07 | 0.00 | 1.16 | 3.95 | 0.8444 | -0.0277 | |||
| VZ / Verizon Communications Inc. | 0.03 | 0.00 | 1.16 | -4.62 | 0.8434 | -0.1059 | |||
| AOSL / Alpha and Omega Semiconductor Limited | 0.04 | 50.00 | 1.15 | 54.90 | 0.8423 | 0.2582 | |||
| BEN / Franklin Resources, Inc. | 0.05 | 0.00 | 1.15 | 23.95 | 0.8421 | 0.1123 | |||
| MO / Altria Group, Inc. | 0.02 | 0.00 | 1.12 | -2.36 | 0.8169 | -0.0810 | |||
| ESCA / Escalade, Incorporated | 0.08 | 0.00 | 1.12 | -8.66 | 0.8159 | -0.1428 | |||
| ES / Eversource Energy | 0.02 | 0.00 | 1.11 | 2.41 | 0.8075 | -0.0389 | |||
| BC / Brunswick Corporation | 0.02 | 0.00 | 1.10 | 2.51 | 0.8059 | -0.0376 | |||
| CNA / CNA Financial Corporation | 0.02 | 0.00 | 1.09 | -8.46 | 0.7980 | -0.1372 | |||
| F / Ford Motor Company | 0.10 | 0.00 | 1.08 | 8.21 | 0.7891 | 0.0059 | |||
| AMGN / Amgen Inc. | 0.00 | 0.00 | 1.08 | -10.37 | 0.7883 | -0.1561 | |||
| LEVI / Levi Strauss & Co. | 0.06 | 0.00 | 1.08 | 18.63 | 0.7850 | 0.0744 | |||
| HBB / Hamilton Beach Brands Holding Company | 0.06 | 0.00 | 1.07 | -7.90 | 0.7830 | -0.1301 | |||
| GPC / Genuine Parts Company | 0.01 | 0.00 | 1.03 | 1.88 | 0.7522 | -0.0410 | |||
| OTEX / Open Text Corporation | 0.04 | 0.00 | 1.03 | 15.60 | 0.7519 | 0.0535 | |||
| WHR / Whirlpool Corporation | 0.01 | 0.00 | 1.01 | 12.54 | 0.7399 | 0.0339 | |||
| CVX / Chevron Corporation | 0.01 | 0.00 | 1.00 | -14.41 | 0.7281 | -0.1852 | |||
| SIRI / Sirius XM Holdings Inc. | 0.04 | 0.00 | 0.99 | 1.95 | 0.7239 | -0.0389 | |||
| AMCR / Amcor plc | 0.11 | 0.00 | 0.97 | -5.26 | 0.7093 | -0.0945 | |||
| RELL / Richardson Electronics, Ltd. | 0.10 | 0.00 | 0.96 | -13.53 | 0.7040 | -0.1701 | |||
| BRSL / Brightstar Lottery PLC | 0.06 | 0.00 | 0.93 | -2.73 | 0.6759 | -0.0704 | |||
| TWI / Titan International, Inc. | 0.09 | 0.00 | 0.92 | 22.38 | 0.6743 | 0.0829 | |||
| DXC / DXC Technology Company | 0.06 | 0.00 | 0.92 | -10.33 | 0.6715 | -0.1324 | |||
| DOW / Dow Inc. | 0.03 | 33.92 | 0.90 | 1.58 | 0.6574 | -0.0376 | |||
| ASO / Academy Sports and Outdoors, Inc. | 0.02 | 0.00 | 0.90 | -1.75 | 0.6538 | -0.0607 | |||
| VTRS / Viatris Inc. | 0.10 | 0.00 | 0.89 | 2.53 | 0.6514 | -0.0308 | |||
| DENN / Denny's Corporation | 0.21 | 26.47 | 0.88 | 41.41 | 0.6430 | 0.1544 | |||
| SON / Sonoco Products Company | 0.02 | 0.00 | 0.87 | -7.73 | 0.6355 | -0.1045 | |||
| BLMN / Bloomin' Brands, Inc. | 0.10 | 100.00 | 0.86 | 140.50 | 0.6281 | 0.3473 | |||
| COLB / Columbia Banking System, Inc. | 0.04 | 0.00 | 0.86 | -6.22 | 0.6276 | -0.0912 | |||
| UPBD / Upbound Group, Inc. | 0.03 | 0.00 | 0.86 | 4.76 | 0.6262 | -0.0156 | |||
| BBY / Best Buy Co., Inc. | 0.01 | 0.00 | 0.85 | -8.89 | 0.6214 | -0.1102 | |||
| WU / The Western Union Company | 0.10 | 0.00 | 0.84 | -20.42 | 0.6142 | -0.2144 | |||
| KHC / The Kraft Heinz Company | 0.03 | 0.00 | 0.84 | -15.22 | 0.6140 | -0.1629 | |||
| TAP / Molson Coors Beverage Company | 0.02 | 0.00 | 0.83 | -21.08 | 0.6069 | -0.2179 | |||
| SWKS / Skyworks Solutions, Inc. | 0.01 | 0.00 | 0.83 | 15.34 | 0.6034 | 0.0415 | |||
| EMN / Eastman Chemical Company | 0.01 | 0.00 | 0.82 | -15.31 | 0.6018 | -0.1607 | |||
| AES / The AES Corporation | 0.08 | 0.00 | 0.82 | -15.31 | 0.6017 | -0.1610 | |||
| CXT / Crane NXT, Co. | 0.01 | 0.00 | 0.81 | 4.80 | 0.5898 | -0.0141 | |||
| HPQ / HP Inc. | 0.03 | 0.00 | 0.81 | -11.71 | 0.5890 | -0.1269 | |||
| UPS / United Parcel Service, Inc. | 0.01 | 0.00 | 0.80 | -8.18 | 0.5817 | -0.0988 | |||
| HY / Hyster-Yale, Inc. | 0.02 | 0.00 | 0.79 | -4.24 | 0.5775 | -0.0700 | |||
| LYB / LyondellBasell Industries N.V. | 0.01 | 0.00 | 0.79 | -17.79 | 0.5766 | -0.1766 | |||
| MAN / ManpowerGroup Inc. | 0.02 | 0.00 | 0.72 | -30.19 | 0.5249 | -0.2825 | |||
| UWMC / UWM Holdings Corporation | 0.17 | 0.00 | 0.72 | -24.15 | 0.5225 | -0.2173 | |||
| IMXI / International Money Express, Inc. | 0.07 | 0.00 | 0.71 | -20.05 | 0.5152 | -0.1767 | |||
| PLTK / Playtika Holding Corp. | 0.15 | 0.00 | 0.70 | -8.52 | 0.5096 | -0.0884 | |||
| WPP / WPP plc - Depositary Receipt (Common Stock) | 0.02 | 0.00 | 0.67 | -7.69 | 0.4904 | -0.0805 | |||
| SGA / Saga Communications, Inc. | 0.05 | 0.00 | 0.65 | 4.33 | 0.4742 | -0.0142 | |||
| HOFT / Hooker Furnishings Corporation | 0.06 | 0.00 | 0.63 | 5.32 | 0.4631 | -0.0087 | |||
| SPWH / Sportsman's Warehouse Holdings, Inc. | 0.18 | 0.00 | 0.62 | 248.88 | 0.4530 | 0.3129 | |||
| CAL / Caleres, Inc. | 0.05 | 0.00 | 0.61 | -29.04 | 0.4457 | -0.2290 | |||
| PII / Polaris Inc. | 0.01 | 0.00 | 0.61 | -0.81 | 0.4448 | -0.0362 | |||
| SCVL / Shoe Carnival, Inc. | 0.03 | 0.00 | 0.60 | -14.94 | 0.4368 | -0.1144 | |||
| ENR / Energizer Holdings, Inc. | 0.03 | 0.00 | 0.57 | -32.66 | 0.4156 | -0.2466 | |||
| TSQ / Townsquare Media, Inc. | 0.06 | 0.00 | 0.47 | -2.87 | 0.3462 | -0.0363 | |||
| GPRK / GeoPark Limited | 0.07 | 0.00 | 0.46 | -19.29 | 0.3329 | -0.1101 | |||
| ACCO / ACCO Brands Corporation | 0.10 | 0.00 | 0.36 | -14.56 | 0.2612 | -0.0670 | |||
| NFE / New Fortress Energy Inc. | 0.07 | 0.00 | 0.23 | -60.17 | 0.1676 | -0.2828 | |||
| AMCX / AMC Networks Inc. | 0.04 | 0.00 | 0.22 | -8.75 | 0.1601 | -0.0285 | |||
| RILY / B. Riley Financial, Inc. | 0.03 | 0.00 | 0.07 | -22.92 | 0.0542 | -0.0216 |