Basic Stats
| Manager | John Khoury |
| Insider Profile | Long Pond Capital, LP |
| Portfolio Value | $ 1,550,023,356 |
| Current Positions | 29 |
Latest Holdings, Performance, AUM (from 13F, 13D)
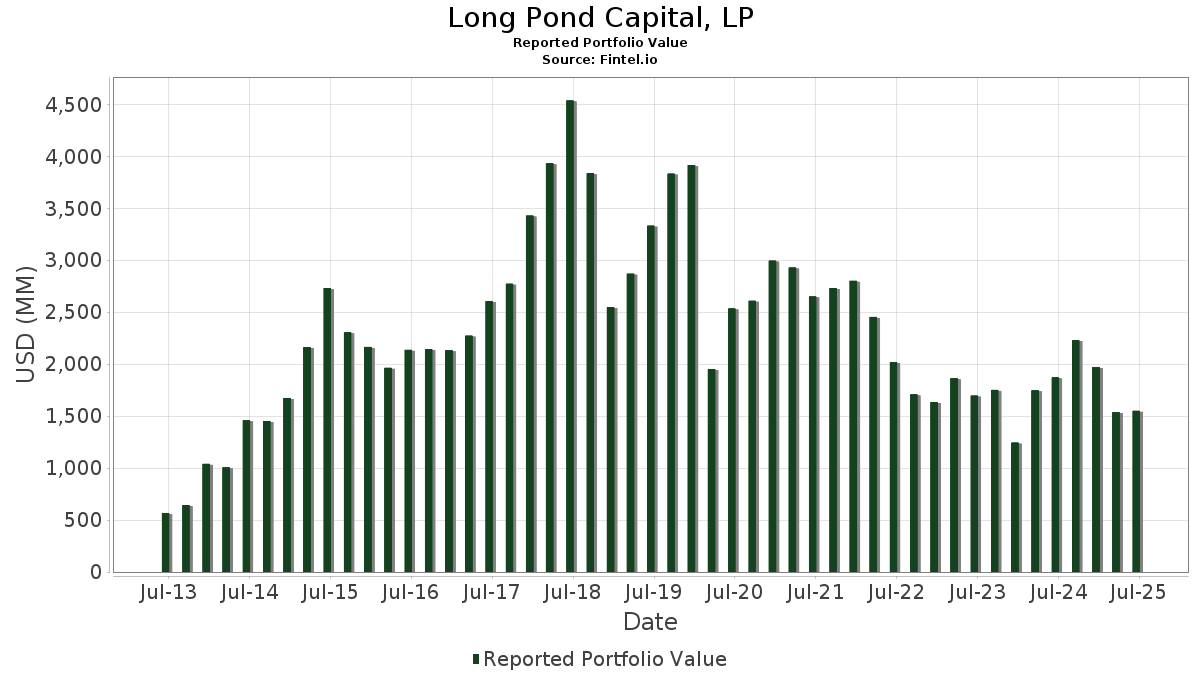
Long Pond Capital, LP has disclosed 29 total holdings in their latest SEC filings. Portfolio manager(s) are listed as John Khoury. Most recent portfolio value is calculated to be $ 1,550,023,356 USD. Actual Assets Under Management (AUM) is this value plus cash (which is not disclosed). Long Pond Capital, LP’s top holdings are Hyatt Hotels Corporation (US:H) , Wyndham Hotels & Resorts, Inc. (US:WH) , Brightstar Lottery PLC (US:BRSL) , Camden Property Trust (US:CPT) , and Six Flags Entertainment Corporation (US:FUN) . Long Pond Capital, LP’s new positions include Summit Hotel Properties, Inc. (US:INN) , Simon Property Group, Inc. (US:SPG) , M/I Homes, Inc. (US:MHO) , . Long Pond Capital, LP’s top industries are "Non-depository Credit Institutions" (sic 61) , "Real Estate" (sic 65) , and "Automotive Dealers And Gasoline Service Stations" (sic 55) .
Top Increases This Quarter
We use the change in the portfolio allocation because this is the most meaningful metric. Changes can be due to trades or changes in share prices.
| Security | Shares (MM) |
Value (MM$) |
Portfolio % | ΔPortfolio % |
|---|---|---|---|---|
| 1.51 | 122.28 | 7.8892 | 6.5169 | |
| 2.50 | 79.94 | 5.1571 | 5.1571 | |
| 5.50 | 97.30 | 6.2776 | 5.1347 | |
| 1.02 | 115.25 | 7.4356 | 4.8085 | |
| 7.57 | 119.63 | 7.7180 | 4.3091 | |
| 1.56 | 95.91 | 6.1878 | 3.5642 | |
| 0.20 | 51.37 | 3.3141 | 3.3141 | |
| 9.40 | 47.85 | 3.0868 | 3.0868 | |
| 0.21 | 33.52 | 2.1624 | 2.1624 | |
| 3.30 | 100.32 | 6.4720 | 1.5440 |
Top Decreases This Quarter
We use the change in the portfolio allocation because this is the most meaningful metric. Changes can be due to trades or changes in share prices.
| Security | Shares (MM) |
Value (MM$) |
Portfolio % | ΔPortfolio % |
|---|---|---|---|---|
| 0.92 | 128.65 | 8.2998 | -4.1806 | |
| 0.28 | 18.64 | 1.2026 | -3.9874 | |
| 0.64 | 73.25 | 4.7260 | -2.9389 | |
| 2.28 | 13.93 | 0.8984 | -2.3836 | |
| 0.09 | 2.58 | 0.1663 | -0.9412 | |
| 1.31 | 54.43 | 3.5118 | -0.9388 | |
| 0.74 | 96.00 | 6.1934 | -0.6606 | |
| 0.90 | 46.96 | 3.0299 | -0.3919 | |
| 7.30 | 56.38 | 3.6376 | -0.2332 | |
| 10.07 | 9.97 | 0.6429 | -0.1491 |
13D/G Filings
This is a list of 13D and 13G filings made in the last year (if any). Click the link icon to see the full transaction history. Green rows indicate new positions. Red rows indicate closed positions.
| File Date | Form | Security | Prev Shares |
Current Shares |
ΔShares % | % Ownership |
% ΔOwnership | |
|---|---|---|---|---|---|---|---|---|
| 2025-08-13 | INN / Summit Hotel Properties, Inc. | 9,400,000 | 8.38 | |||||
| 2025-08-13 | JBGS / JBG SMITH Properties | 3,603,883 | 3,867,406 | 7.31 | 5.29 | 20.50 | ||
| 2025-05-14 | PGRE / Paramount Group, Inc. | 0 | 11,737,433 | 5.35 | ||||
| 2025-05-14 | PLYA / Playa Hotels & Resorts N.V. | 7,941,444 | 3,757,576 | -52.68 | 2.94 | -54.98 | ||
| 2025-05-14 | NLOP / Net Lease Office Properties | 861,601 | 0 | -100.00 | 0.00 | -100.00 | ||
| 2025-02-13 | SMRT / SmartRent, Inc. | 10,066,093 | 5.23 | |||||
| 2025-02-13 | TRTX / TPG RE Finance Trust, Inc. | 7,303,626 | 9.02 |
13F and Fund Filings
This form was filed on 2025-08-13 for the reporting period 2025-06-30. Click the link icon to see the full transaction history.
Upgrade to unlock premium data and export to Excel ![]() .
.
| Security | Type | Avg Share Price | Shares (MM) |
ΔShares (%) |
ΔShares (%) |
Value ($MM) |
Portfolio (%) |
ΔPortfolio (%) |
|
|---|---|---|---|---|---|---|---|---|---|
| H / Hyatt Hotels Corporation | 0.92 | -41.20 | 128.65 | -32.97 | 8.2998 | -4.1806 | |||
| WH / Wyndham Hotels & Resorts, Inc. | 1.51 | 545.83 | 122.28 | 479.49 | 7.8892 | 6.5169 | |||
| BRSL / Brightstar Lottery PLC | 7.57 | 134.70 | 119.63 | 128.21 | 7.7180 | 4.3091 | |||
| CPT / Camden Property Trust | 1.02 | 209.61 | 115.25 | 185.28 | 7.4356 | 4.8085 | |||
| FUN / Six Flags Entertainment Corporation | 3.30 | 55.17 | 100.32 | 32.37 | 6.4720 | 1.5440 | |||
| IRT / Independence Realty Trust, Inc. | 5.50 | 564.46 | 97.30 | 453.68 | 6.2776 | 5.1347 | |||
| DHI / D.R. Horton, Inc. | 0.74 | -10.18 | 96.00 | -8.92 | 6.1934 | -0.6606 | |||
| TMHC / Taylor Morrison Home Corporation | 1.56 | 132.39 | 95.91 | 137.73 | 6.1878 | 3.5642 | |||
| NSA / National Storage Affiliates Trust | 2.50 | 79.94 | 5.1571 | 5.1571 | |||||
| TOL / Toll Brothers, Inc. | 0.64 | -42.50 | 73.25 | -37.85 | 4.7260 | -2.9389 | |||
| JBGS / JBG SMITH Properties | 3.83 | 6.39 | 66.33 | 14.24 | 4.2792 | 0.5038 | |||
| TRTX / TPG RE Finance Trust, Inc. | 7.30 | 0.00 | 56.38 | -5.28 | 3.6376 | -0.2332 | |||
| HGV / Hilton Grand Vacations Inc. | 1.31 | -28.36 | 54.43 | -20.47 | 3.5118 | -0.9388 | |||
| JLL / Jones Lang LaSalle Incorporated | 0.20 | 51.37 | 3.3141 | 3.3141 | |||||
| INN / Summit Hotel Properties, Inc. | 9.40 | 47.85 | 3.0868 | 3.0868 | |||||
| RRR / Red Rock Resorts, Inc. | 0.90 | -25.60 | 46.96 | -10.75 | 3.0299 | -0.3919 | |||
| SPG / Simon Property Group, Inc. | 0.21 | 33.52 | 2.1624 | 2.1624 | |||||
| BRSL / Brightstar Lottery PLC | Call | 2.00 | 0.00 | 31.62 | -2.77 | 2.0400 | -0.0747 | ||
| KRC / Kilroy Realty Corporation | 0.79 | 6.36 | 26.94 | 11.39 | 1.7379 | 0.1653 | |||
| MTH / Meritage Homes Corporation | 0.28 | -75.28 | 18.64 | -76.64 | 1.2026 | -3.9874 | |||
| AIV / Apartment Investment and Management Company | 1.70 | 14.69 | 0.9474 | 0.9474 | |||||
| MAA / Mid-America Apartment Communities, Inc. | 0.09 | 0.95 | 13.97 | -10.84 | 0.9016 | -0.1176 | |||
| PGRE / Paramount Group, Inc. | 2.28 | -80.55 | 13.93 | -72.41 | 0.8984 | -2.3836 | |||
| DBRG / DigitalBridge Group, Inc. | 1.33 | 13.75 | 0.8869 | 0.8869 | |||||
| MHO / M/I Homes, Inc. | 0.12 | 13.69 | 0.8835 | 0.8835 | |||||
| SMRT / SmartRent, Inc. | 10.07 | 0.00 | 9.97 | -18.18 | 0.6429 | -0.1491 | |||
| PLD / Prologis, Inc. | 0.03 | 3.63 | 0.2343 | 0.2343 | |||||
| CZR / Caesars Entertainment, Inc. | 0.09 | -86.67 | 2.58 | -84.87 | 0.1663 | -0.9412 | |||
| LXP / LXP Industrial Trust | 0.15 | 1.24 | 0.0799 | 0.0799 | |||||
| KRG / Kite Realty Group Trust | 0.00 | -100.00 | 0.00 | 0.0000 | |||||
| UHALB / U-Haul Holding Company - Series N | 0.00 | -100.00 | 0.00 | 0.0000 | |||||
| HLT / Hilton Worldwide Holdings Inc. | 0.00 | -100.00 | 0.00 | 0.0000 | |||||
| VNO / Vornado Realty Trust | 0.00 | -100.00 | 0.00 | 0.0000 | |||||
| GDEN / Golden Entertainment, Inc. | 0.00 | -100.00 | 0.00 | 0.0000 | |||||
| PLYA / Playa Hotels & Resorts N.V. | 0.00 | -100.00 | 0.00 | 0.0000 | |||||
| REXR / Rexford Industrial Realty, Inc. | 0.00 | -100.00 | 0.00 | 0.0000 | |||||
| CUBE / CubeSmart | 0.00 | -100.00 | 0.00 | 0.0000 | |||||
| WYNN / Wynn Resorts, Limited | 0.00 | -100.00 | 0.00 | 0.0000 | |||||
| PHM / PulteGroup, Inc. | 0.00 | -100.00 | 0.00 | 0.0000 | |||||
| MSGE / Madison Square Garden Entertainment Corp. | 0.00 | -100.00 | 0.00 | 0.0000 | |||||
| VTMX / Corporación Inmobiliaria Vesta, S.A.B. de C.V. - Depositary Receipt (Common Stock) | 0.00 | -100.00 | 0.00 | 0.0000 | |||||
| DEI / Douglas Emmett, Inc. | 0.00 | -100.00 | 0.00 | 0.0000 | |||||
| VAC / Marriott Vacations Worldwide Corporation | 0.00 | -100.00 | 0.00 | 0.0000 |