Basic Stats
| Insider Profile | JB CAPITAL PARTNERS LP |
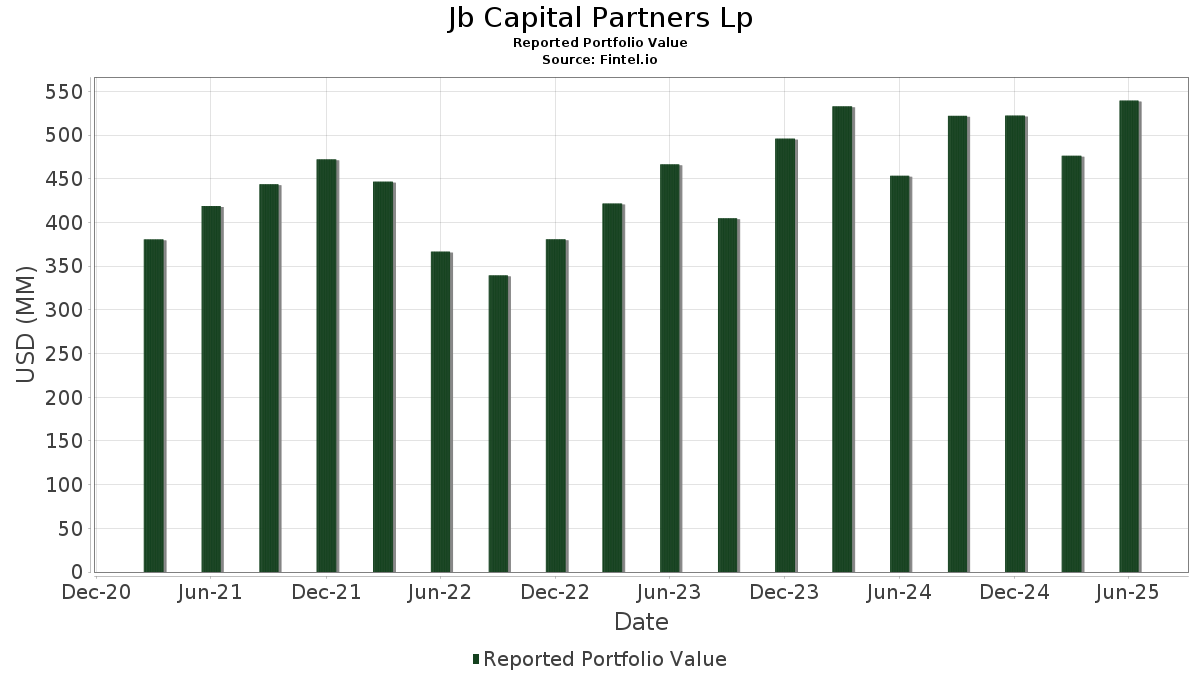
| Portfolio Value | $ 539,520,828 |
| Current Positions | 82 |
Latest Holdings, Performance, AUM (from 13F, 13D)
Jb Capital Partners Lp has disclosed 82 total holdings in their latest SEC filings. Most recent portfolio value is calculated to be $ 539,520,828 USD. Actual Assets Under Management (AUM) is this value plus cash (which is not disclosed). Jb Capital Partners Lp’s top holdings are RadNet, Inc. (US:RDNT) , Ryerson Holding Corporation (US:RYI) , Tutor Perini Corporation (US:TPC) , Builders FirstSource, Inc. (US:BLDR) , and Oppenheimer Holdings Inc. (US:OPY) . Jb Capital Partners Lp’s new positions include Fluent, Inc. (US:FLNT) , Forum Energy Technologies, Inc. (US:FET) , 180 Degree Capital Corp. (US:TURN) , Rayonier Advanced Materials Inc. (US:RYAM) , and . Jb Capital Partners Lp’s top industries are "Water Transportation" (sic 44) , and "Health Services" (sic 80) .
Top Increases This Quarter
We use the change in the portfolio allocation because this is the most meaningful metric. Changes can be due to trades or changes in share prices.
| Security | Shares (MM) |
Value (MM$) |
Portfolio % | ΔPortfolio % |
|---|---|---|---|---|
| 0.89 | 41.85 | 7.7564 | 3.4035 | |
| 0.04 | 12.40 | 2.2975 | 0.8472 | |
| 1.71 | 5.90 | 1.0940 | 0.7577 | |
| 1.85 | 31.58 | 5.8536 | 0.7055 | |
| 0.07 | 1.40 | 0.2591 | 0.2591 | |
| 0.02 | 2.80 | 0.5193 | 0.2067 | |
| 0.29 | 2.56 | 0.4741 | 0.2062 | |
| 0.15 | 2.28 | 0.4235 | 0.1947 | |
| 1.47 | 83.89 | 15.5488 | 0.1637 | |
| 0.99 | 6.84 | 1.2671 | 0.1382 |
Top Decreases This Quarter
We use the change in the portfolio allocation because this is the most meaningful metric. Changes can be due to trades or changes in share prices.
| Security | Shares (MM) |
Value (MM$) |
Portfolio % | ΔPortfolio % |
|---|---|---|---|---|
| 2.13 | 45.97 | 8.5200 | -1.7512 | |
| 0.47 | 32.55 | 6.0337 | -1.5210 | |
| 0.29 | 34.10 | 6.3212 | -1.3441 | |
| 0.39 | 29.28 | 5.4270 | -0.7690 | |
| 0.05 | 0.51 | 0.0952 | -0.3485 | |
| 0.85 | 17.81 | 3.3008 | -0.2992 | |
| 0.20 | 1.62 | 0.3003 | -0.1489 | |
| 0.50 | 33.15 | 6.1434 | -0.1458 | |
| 0.08 | 1.92 | 0.3551 | -0.1354 | |
| 0.06 | 2.29 | 0.4239 | -0.1169 |
13D/G Filings
This is a list of 13D and 13G filings made in the last year (if any). Click the link icon to see the full transaction history. Green rows indicate new positions. Red rows indicate closed positions.
| File Date | Form | Security | Prev Shares |
Current Shares |
ΔShares % | % Ownership |
% ΔOwnership | |
|---|---|---|---|---|---|---|---|---|
| 2025-03-17 | NEXN / Nexxen International Ltd. | 3,530,057 | 5.50 | |||||
| 2025-02-10 | / (34380C102) | 1,406,982 | 7.30 | |||||
| 2025-02-10 | RYI / Ryerson Holding Corporation | 1,951,069 | 2,131,069 | 9.23 | 6.70 | 17.54 | ||
| 2025-02-10 | LCUT / Lifetime Brands, Inc. | 1,178,121 | 1,248,121 | 5.94 | 5.60 | 5.66 |
13F and Fund Filings
This form was filed on 2025-08-13 for the reporting period 2025-06-30. Click the link icon to see the full transaction history.
Upgrade to unlock premium data and export to Excel ![]() .
.
| Security | Type | Avg Share Price | Shares (MM) |
ΔShares (%) |
ΔShares (%) |
Value ($MM) |
Portfolio (%) |
ΔPortfolio (%) |
|
|---|---|---|---|---|---|---|---|---|---|
| RDNT / RadNet, Inc. | 1.47 | 0.00 | 83.89 | 14.46 | 15.5488 | 0.1637 | |||
| RYI / Ryerson Holding Corporation | 2.13 | 0.00 | 45.97 | -6.05 | 8.5200 | -1.7512 | |||
| TPC / Tutor Perini Corporation | 0.89 | 0.00 | 41.85 | 101.82 | 7.7564 | 3.4035 | |||
| Nexxen International LTD / SPON ADR (89484T104) | 3.56 | 37.01 | 0.0000 | ||||||
| BLDR / Builders FirstSource, Inc. | 0.29 | 0.00 | 34.10 | -6.60 | 6.3212 | -1.3441 | |||
| OPY / Oppenheimer Holdings Inc. | 0.50 | 0.00 | 33.15 | 10.63 | 6.1434 | -0.1458 | |||
| CNR / Core Natural Resources, Inc. | 0.47 | 0.00 | 32.55 | -9.54 | 6.0337 | -1.5210 | |||
| DAN / Dana Incorporated | 1.85 | 0.00 | 31.58 | 28.78 | 5.8536 | 0.7055 | |||
| BXC / BlueLinx Holdings Inc. | 0.39 | 0.00 | 29.28 | -0.80 | 5.4270 | -0.7690 | |||
| CXW / CoreCivic, Inc. | 0.85 | 0.00 | 17.81 | 3.84 | 3.3008 | -0.2992 | |||
| VCTR / Victory Capital Holdings, Inc. | 0.28 | 0.00 | 17.62 | 10.02 | 3.2667 | -0.0960 | |||
| IESC / IES Holdings, Inc. | 0.04 | 0.00 | 12.40 | 79.40 | 2.2975 | 0.8472 | |||
| LCUT / Lifetime Brands, Inc. | 1.58 | 9.00 | 7.97 | 13.04 | 1.4770 | -0.0030 | |||
| ZEUS / Olympic Steel, Inc. | 0.22 | 7.84 | 7.25 | 11.50 | 1.3440 | -0.0212 | |||
| ASTL / Algoma Steel Group Inc. | 0.99 | 0.00 | 6.84 | 27.13 | 1.2671 | 0.1382 | |||
| MT / ArcelorMittal S.A. - Depositary Receipt (Common Stock) | 0.20 | 0.00 | 6.47 | 9.45 | 1.1999 | -0.0416 | |||
| SPWH / Sportsman's Warehouse Holdings, Inc. | 1.71 | 6.14 | 5.90 | 268.41 | 1.0940 | 0.7577 | |||
| AXL / American Axle & Manufacturing Holdings, Inc. | 1.11 | 15.67 | 4.52 | 15.94 | 0.8375 | 0.0195 | |||
| CVEO / Civeo Corporation | 0.19 | 0.00 | 4.47 | 0.38 | 0.8292 | -0.1063 | |||
| MEC / Mayville Engineering Company, Inc. | 0.25 | 0.00 | 4.00 | 18.85 | 0.7411 | 0.0348 | |||
| CIGI / Colliers International Group Inc. | 0.03 | 0.00 | 3.93 | 7.61 | 0.7284 | -0.0382 | |||
| TSQ / Townsquare Media, Inc. | 0.47 | 0.00 | 3.62 | -2.35 | 0.6707 | -0.1071 | |||
| CSV / Carriage Services, Inc. | 0.07 | 0.00 | 3.24 | 18.12 | 0.6005 | 0.0246 | |||
| Ramaco Resources Inc / COM CL A (75134P900) | 0.23 | 3.09 | 0.0000 | ||||||
| AXR / AMREP Corporation | 0.14 | 0.00 | 2.96 | 4.38 | 0.5484 | -0.0466 | |||
| CNDT / Conduent Incorporated | 1.11 | 7.23 | 2.94 | 4.85 | 0.5446 | -0.0437 | |||
| FLNT / Fluent, Inc. | 1.46 | 2.92 | 0.0000 | ||||||
| LMB / Limbach Holdings, Inc. | 0.02 | 0.00 | 2.80 | 88.18 | 0.5193 | 0.2067 | |||
| Sinclair Broadcast Group Inc / CL A (829226109) | 0.20 | 2.69 | 0.0000 | ||||||
| VREX / Varex Imaging Corporation | 0.29 | 168.18 | 2.56 | 100.39 | 0.4741 | 0.2062 | |||
| HNRG / Hallador Energy Company | 0.16 | 0.00 | 2.53 | 28.92 | 0.4695 | 0.0570 | |||
| HDSN / Hudson Technologies, Inc. | 0.31 | 0.00 | 2.49 | 31.60 | 0.4608 | 0.0643 | |||
| GSM / Ferroglobe PLC | 0.66 | 0.00 | 2.40 | -1.11 | 0.4456 | -0.0646 | |||
| III / Information Services Group, Inc. | 0.49 | 0.00 | 2.34 | 22.77 | 0.4338 | 0.0336 | |||
| RICK / RCI Hospitality Holdings, Inc. | 0.06 | 0.00 | 2.29 | -11.22 | 0.4239 | -0.1169 | |||
| OI / O-I Glass, Inc. | 0.15 | 63.16 | 2.28 | 109.73 | 0.4235 | 0.1947 | |||
| BBCP / Concrete Pumping Holdings, Inc. | 0.34 | 9.39 | 2.10 | 23.18 | 0.3892 | 0.0314 | |||
| GEO / The GEO Group, Inc. | 0.08 | 0.00 | 1.92 | -17.98 | 0.3551 | -0.1354 | |||
| FSV / FirstService Corporation | 0.01 | 0.00 | 1.76 | 5.25 | 0.3270 | -0.0250 | |||
| ATKR / Atkore Inc. | 0.03 | 0.00 | 1.76 | 17.61 | 0.3269 | 0.0121 | |||
| MG / Mistras Group, Inc. | 0.20 | 0.00 | 1.62 | -24.31 | 0.3003 | -0.1489 | |||
| FET / Forum Energy Technologies, Inc. | 0.07 | 1.40 | 0.2591 | 0.2591 | |||||
| PKOH / Park-Ohio Holdings Corp. | 0.08 | 0.00 | 1.36 | -17.50 | 0.2526 | -0.0940 | |||
| ORN / Orion Group Holdings, Inc. | 0.13 | 0.00 | 1.18 | 73.64 | 0.2185 | 0.0758 | |||
| TDW / Tidewater Inc. | 0.03 | 0.00 | 1.15 | 9.19 | 0.2138 | -0.0081 | |||
| RUSHB / Rush Enterprises, Inc. | 0.02 | 0.00 | 1.07 | -6.87 | 0.1986 | -0.0428 | |||
| RUSHA / Rush Enterprises, Inc. | 0.02 | 0.00 | 1.05 | -3.22 | 0.1949 | -0.0331 | |||
| GTX / Garrett Motion Inc. | 0.09 | 0.00 | 0.96 | 25.62 | 0.1773 | 0.0174 | |||
| XPEL / XPEL, Inc. | 0.03 | 0.00 | 0.90 | 22.21 | 0.1664 | 0.0122 | |||
| SAR / Saratoga Investment Corp. | 0.03 | 0.00 | 0.82 | -2.03 | 0.1525 | -0.0237 | |||
| FSK / FS KKR Capital Corp. | 0.04 | 0.00 | 0.78 | -0.89 | 0.1442 | -0.0207 | |||
| TURN / 180 Degree Capital Corp. | 0.18 | 0.72 | 0.1327 | 0.1327 | |||||
| POWW / Outdoor Holding Company | 0.55 | 0.00 | 0.70 | -7.25 | 0.1305 | -0.0288 | |||
| SND / Smart Sand, Inc. | 0.35 | 0.00 | 0.67 | -26.27 | 0.1239 | -0.0664 | |||
| TRS / TriMas Corporation | 0.02 | 0.00 | 0.64 | 22.07 | 0.1180 | 0.0086 | |||
| INSE / Inspired Entertainment, Inc. | 0.07 | 0.00 | 0.53 | -4.32 | 0.0984 | -0.0181 | |||
| LXU / LSB Industries, Inc. | 0.07 | 0.53 | 0.0981 | 0.0981 | |||||
| TWI / Titan International, Inc. | 0.05 | 0.00 | 0.51 | -75.72 | 0.0952 | -0.3485 | |||
| Ramaco Resources Inc / COM CL B (75134P303) | 0.06 | 0.47 | 0.0000 | ||||||
| CURV / Torrid Holdings Inc. | 0.15 | 0.00 | 0.44 | -46.23 | 0.0820 | -0.0905 | |||
| RNGR / Ranger Energy Services, Inc. | 0.04 | 0.00 | 0.43 | -15.89 | 0.0805 | -0.0278 | |||
| EZPW / EZCORP, Inc. | 0.03 | 0.00 | 0.42 | -5.67 | 0.0772 | -0.0155 | |||
| GTN / Gray Media, Inc. | 0.09 | 0.00 | 0.40 | 4.77 | 0.0733 | -0.0059 | |||
| RYAM / Rayonier Advanced Materials Inc. | 0.10 | 0.39 | 0.0714 | 0.0714 | |||||
| QIPT / Quipt Home Medical Corp. | 0.20 | 0.00 | 0.36 | -23.18 | 0.0664 | -0.0315 | |||
| BV / BrightView Holdings, Inc. | 0.02 | 0.00 | 0.33 | 30.08 | 0.0617 | 0.0078 | |||
| NOA / North American Construction Group Ltd. | 0.02 | 0.00 | 0.32 | 1.27 | 0.0592 | -0.0071 | |||
| EAF / GrafTech International Ltd. | 0.29 | 0.00 | 0.28 | 11.42 | 0.0526 | -0.0008 | |||
| LEE / Lee Enterprises, Incorporated | 0.04 | 0.00 | 0.26 | -38.31 | 0.0474 | -0.0397 | |||
| RMNI / Rimini Street, Inc. | 0.06 | 0.00 | 0.22 | 8.78 | 0.0414 | -0.0019 | |||
| VFF / Village Farms International, Inc. | 0.18 | 0.00 | 0.20 | 81.65 | 0.0367 | 0.0137 | |||
| WRLD / World Acceptance Corporation | 0.00 | 0.00 | 0.18 | 30.37 | 0.0327 | 0.0043 | |||
| RMBL / RumbleOn, Inc. | 0.07 | 0.00 | 0.16 | -18.27 | 0.0300 | -0.0115 | |||
| KTOS / Kratos Defense & Security Solutions, Inc. | 0.00 | 0.00 | 0.15 | 56.70 | 0.0282 | 0.0078 | |||
| CVGI / Commercial Vehicle Group, Inc. | 0.07 | 0.00 | 0.11 | 44.16 | 0.0207 | 0.0045 | |||
| GSIT / GSI Technology, Inc. | 0.03 | 0.00 | 0.11 | 66.67 | 0.0206 | 0.0065 | |||
| FTHM / Fathom Holdings Inc. | 0.07 | 0.00 | 0.09 | 40.98 | 0.0161 | 0.0032 | |||
| CLF / Cleveland-Cliffs Inc. | 0.01 | 0.00 | 0.09 | -7.53 | 0.0160 | -0.0036 | |||
| TSE / Trinseo PLC | 0.03 | 0.00 | 0.08 | -16.16 | 0.0156 | -0.0052 | |||
| DXLG / Destination XL Group, Inc. | 0.07 | 0.00 | 0.08 | -23.85 | 0.0154 | -0.0076 | |||
| CNTY / Century Casinos, Inc. | 0.04 | 0.00 | 0.08 | 26.56 | 0.0150 | 0.0015 | |||
| Xcel Brands Inc / (98400M101) | 0.01 | 0.03 | 0.0000 | ||||||
| ATSG / Air Transport Services Group, Inc. | 0.00 | -100.00 | 0.00 | 0.0000 |