Basic Stats
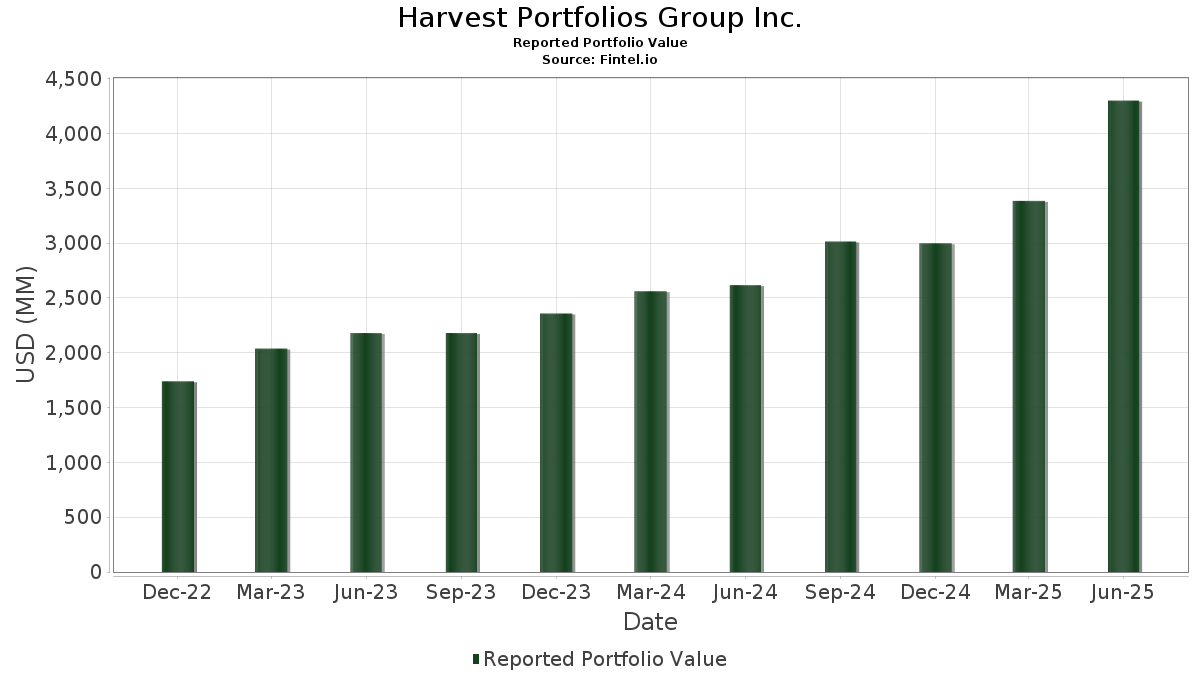
| Portfolio Value | $ 4,299,941,919 |
| Current Positions | 253 |
Latest Holdings, Performance, AUM (from 13F, 13D)
Harvest Portfolios Group Inc. has disclosed 253 total holdings in their latest SEC filings. Most recent portfolio value is calculated to be $ 4,299,941,919 USD. Actual Assets Under Management (AUM) is this value plus cash (which is not disclosed). Harvest Portfolios Group Inc.’s top holdings are iShares Trust - iShares 20+ Year Treasury Bond ETF (US:TLT) , Strategy Inc (US:MSTR) , NVIDIA Corporation (US:NVDA) , iShares Trust - iShares 7-10 Year Treasury Bond ETF (US:IEF) , and Eli Lilly and Company (US:LLY) . Harvest Portfolios Group Inc.’s new positions include Arista Networks Inc (US:ANET) , iShares Bitcoin Trust ETF (US:IBIT) , Emera Incorporated (US:EMRAF) , Cenovus Energy Inc. (US:CVE) , and Galaxy Digital Inc. (US:GLXY) .
Top Increases This Quarter
We use the change in the portfolio allocation because this is the most meaningful metric. Changes can be due to trades or changes in share prices.
| Security | Shares (MM) |
Value (MM$) |
Portfolio % | ΔPortfolio % |
|---|---|---|---|---|
| 0.71 | 286.21 | 6.6562 | 4.5162 | |
| 0.22 | 76.13 | 1.7704 | 1.2079 | |
| 0.32 | 101.48 | 2.3600 | 1.1832 | |
| 1.14 | 180.86 | 4.2061 | 1.1485 | |
| 0.56 | 75.81 | 1.7631 | 1.0168 | |
| 0.36 | 100.01 | 2.3258 | 0.9529 | |
| 0.28 | 61.08 | 1.4205 | 0.7777 | |
| 0.27 | 27.97 | 0.6505 | 0.6505 | |
| 0.10 | 73.07 | 1.6993 | 0.6075 | |
| 0.03 | 38.94 | 0.9057 | 0.5543 |
Top Decreases This Quarter
We use the change in the portfolio allocation because this is the most meaningful metric. Changes can be due to trades or changes in share prices.
| Security | Shares (MM) |
Value (MM$) |
Portfolio % | ΔPortfolio % |
|---|---|---|---|---|
| 3.50 | 309.08 | 7.1880 | -2.5969 | |
| 0.19 | 60.13 | 1.3983 | -0.9332 | |
| 0.13 | 51.87 | 1.2063 | -0.6275 | |
| 0.14 | 29.22 | 0.6795 | -0.6054 | |
| 1.56 | 149.77 | 3.4832 | -0.5826 | |
| 1.13 | 52.42 | 1.2190 | -0.5568 | |
| 0.81 | 56.89 | 1.3231 | -0.4659 | |
| 0.69 | 54.49 | 1.2671 | -0.3992 | |
| 0.20 | 56.34 | 1.3104 | -0.3882 | |
| 0.79 | 44.43 | 1.0332 | -0.3865 |
13F and Fund Filings
This form was filed on 2025-08-06 for the reporting period 2025-06-30. Click the link icon to see the full transaction history.
Upgrade to unlock premium data and export to Excel ![]() .
.
| Security | Type | Avg Share Price | Shares (MM) |
ΔShares (%) |
ΔShares (%) |
Value ($MM) |
Portfolio (%) |
ΔPortfolio (%) |
|
|---|---|---|---|---|---|---|---|---|---|
| TLT / iShares Trust - iShares 20+ Year Treasury Bond ETF | 3.50 | -3.75 | 309.08 | -6.69 | 7.1880 | -2.5969 | |||
| MSTR / Strategy Inc | 0.71 | 181.76 | 286.21 | 295.10 | 6.6562 | 4.5162 | |||
| NVDA / NVIDIA Corporation | 1.14 | 19.87 | 180.86 | 74.74 | 4.2061 | 1.1485 | |||
| IEF / iShares Trust - iShares 7-10 Year Treasury Bond ETF | 1.56 | 8.37 | 149.77 | 8.82 | 3.4832 | -0.5826 | |||
| LLY / Eli Lilly and Company | 0.16 | 28.31 | 126.18 | 21.10 | 2.9345 | -0.1435 | |||
| MSFT / Microsoft Corporation | 0.24 | 18.64 | 121.09 | 57.20 | 2.8162 | 0.5406 | |||
| TSLA / Tesla, Inc. | 0.32 | 107.83 | 101.48 | 154.75 | 2.3600 | 1.1832 | |||
| AVGO / Broadcom Inc. | 0.36 | 30.71 | 100.01 | 115.19 | 2.3258 | 0.9529 | |||
| GOOGL / Alphabet Inc. | 0.44 | 48.19 | 77.61 | 68.88 | 1.8049 | 0.4473 | |||
| COIN / Coinbase Global, Inc. | 0.22 | 96.43 | 76.13 | 299.74 | 1.7704 | 1.2079 | |||
| PLTR / Palantir Technologies Inc. | 0.56 | 85.79 | 75.81 | 200.09 | 1.7631 | 1.0168 | |||
| META / Meta Platforms, Inc. | 0.10 | 54.39 | 73.07 | 97.71 | 1.6993 | 0.6075 | |||
| AMZN / Amazon.com, Inc. | 0.29 | 66.65 | 64.67 | 92.17 | 1.5040 | 0.5098 | |||
| ORCL / Oracle Corporation | 0.28 | 79.50 | 61.08 | 180.69 | 1.4205 | 0.7777 | |||
| UNH / UnitedHealth Group Incorporated | 0.19 | 27.90 | 60.13 | -23.82 | 1.3983 | -0.9332 | |||
| A / Agilent Technologies, Inc. | 0.51 | 24.32 | 59.83 | 25.41 | 1.3914 | -0.0179 | |||
| NVS / Novartis AG - Depositary Receipt (Common Stock) | 0.49 | -2.20 | 59.61 | 6.16 | 1.3862 | -0.2724 | |||
| BSX / Boston Scientific Corporation | 0.55 | 1.15 | 59.03 | 7.70 | 1.3729 | -0.2464 | |||
| ABT / Abbott Laboratories | 0.43 | -1.57 | 58.77 | 0.93 | 1.3668 | -0.3535 | |||
| MDT / Medtronic plc | 0.67 | 8.55 | 58.07 | 5.30 | 1.3505 | -0.2786 | |||
| ISRG / Intuitive Surgical, Inc. | 0.11 | 9.29 | 57.50 | 19.92 | 1.3373 | -0.0793 | |||
| SYK / Stryker Corporation | 0.14 | 2.62 | 57.36 | 9.07 | 1.3340 | -0.2196 | |||
| JNJ / Johnson & Johnson | 0.37 | 8.40 | 57.07 | -0.16 | 1.3273 | -0.3614 | |||
| AZN / AstraZeneca PLC - Depositary Receipt (Common Stock) | 0.81 | -1.19 | 56.89 | -6.06 | 1.3231 | -0.4659 | |||
| ZTS / Zoetis Inc. | 0.36 | 8.07 | 56.65 | 2.36 | 1.3174 | -0.3175 | |||
| AMGN / Amgen Inc. | 0.20 | 9.34 | 56.34 | -2.01 | 1.3104 | -0.3882 | |||
| DHR / Danaher Corporation | 0.28 | 13.14 | 55.44 | 9.02 | 1.2893 | -0.2129 | |||
| ABBV / AbbVie Inc. | 0.30 | 11.06 | 55.10 | -1.60 | 1.2813 | -0.3728 | |||
| MRK / Merck & Co., Inc. | 0.69 | 9.53 | 54.49 | -3.41 | 1.2671 | -0.3992 | |||
| AAPL / Apple Inc. | 0.26 | 41.29 | 53.66 | 30.50 | 1.2479 | 0.0333 | |||
| TMO / Thermo Fisher Scientific Inc. | 0.13 | 30.25 | 52.68 | 6.14 | 1.2250 | -0.2411 | |||
| BMY / Bristol-Myers Squibb Company | 1.13 | 14.89 | 52.42 | -12.80 | 1.2190 | -0.5568 | |||
| REGN / Regeneron Pharmaceuticals, Inc. | 0.10 | 19.39 | 51.98 | -1.17 | 1.2087 | -0.3449 | |||
| ELV / Elevance Health, Inc. | 0.13 | -6.56 | 51.87 | -16.44 | 1.2063 | -0.6275 | |||
| CSCO / Cisco Systems, Inc. | 0.72 | -1.73 | 50.20 | 10.48 | 1.1674 | -0.1748 | |||
| VGLT / Vanguard Scottsdale Funds - Vanguard Long-Term Treasury ETF | 0.79 | -5.10 | 44.43 | -7.56 | 1.0332 | -0.3865 | |||
| ACN / Accenture plc | 0.14 | 21.06 | 42.41 | 15.96 | 0.9862 | -0.0942 | |||
| NFLX / Netflix, Inc. | 0.03 | 127.99 | 38.94 | 227.40 | 0.9057 | 0.5543 | |||
| EDV / Vanguard World Fund - Vanguard Extended Duration Treasury ETF | 0.54 | -5.10 | 36.36 | -10.18 | 0.8457 | -0.3503 | |||
| AMD / Advanced Micro Devices, Inc. | 0.25 | -22.58 | 36.02 | 6.93 | 0.8377 | -0.1574 | |||
| COST / Costco Wholesale Corporation | 0.03 | 132.56 | 31.57 | 143.42 | 0.7342 | 0.3511 | |||
| MU / Micron Technology, Inc. | 0.25 | -8.85 | 31.32 | 29.29 | 0.7283 | 0.0128 | |||
| TXN / Texas Instruments Incorporated | 0.14 | -41.86 | 29.22 | -32.82 | 0.6795 | -0.6054 | |||
| INTU / Intuit Inc. | 0.04 | -10.55 | 28.77 | 14.74 | 0.6691 | -0.0716 | |||
| MS / Morgan Stanley | 0.20 | 7.40 | 28.74 | 29.67 | 0.6683 | 0.0136 | |||
| JPM / JPMorgan Chase & Co. | 0.10 | -0.56 | 28.22 | 17.52 | 0.6564 | -0.0531 | |||
| ANET / Arista Networks Inc | 0.27 | 27.97 | 0.6505 | 0.6505 | |||||
| AMAT / Applied Materials, Inc. | 0.15 | 6.16 | 27.89 | 33.93 | 0.6486 | 0.0334 | |||
| WFC / Wells Fargo & Company | 0.34 | 3.23 | 27.45 | 15.21 | 0.6385 | -0.0655 | |||
| SNPS / Synopsys, Inc. | 0.05 | 6.18 | 26.34 | 26.93 | 0.6125 | -0.0004 | |||
| VZ / Verizon Communications Inc. | 0.60 | 7.49 | 26.03 | 2.53 | 0.6053 | -0.1446 | |||
| PANW / Palo Alto Networks, Inc. | 0.13 | -0.46 | 25.76 | 19.38 | 0.5991 | -0.0384 | |||
| CAT / Caterpillar Inc. | 0.07 | 15.15 | 25.33 | 35.54 | 0.5890 | 0.0370 | |||
| NOW / ServiceNow, Inc. | 0.02 | 16.06 | 24.84 | 49.87 | 0.5777 | 0.0881 | |||
| ADBE / Adobe Inc. | 0.06 | 10.40 | 23.84 | 11.36 | 0.5543 | -0.0780 | |||
| CRM / Salesforce, Inc. | 0.09 | 24.36 | 23.27 | 26.36 | 0.5412 | -0.0028 | |||
| MSI / Motorola Solutions, Inc. | 0.05 | -1.43 | 22.04 | -5.34 | 0.5125 | -0.1752 | |||
| SHEL / Shell plc - Depositary Receipt (Common Stock) | 0.30 | -1.54 | 21.43 | -5.39 | 0.4985 | -0.1708 | |||
| V / Visa Inc. | 0.06 | -0.09 | 19.74 | 1.22 | 0.4592 | -0.1171 | |||
| WMT / Walmart Inc. | 0.19 | -2.14 | 18.76 | 9.00 | 0.4363 | -0.0722 | |||
| PG / The Procter & Gamble Company | 0.12 | 0.42 | 18.54 | -6.12 | 0.4312 | -0.1522 | |||
| PEP / PepsiCo, Inc. | 0.14 | 5.94 | 17.87 | -6.70 | 0.4156 | -0.1503 | |||
| KO / The Coca-Cola Company | 0.25 | -17.27 | 17.82 | -18.27 | 0.4144 | -0.2297 | |||
| IBIT / iShares Bitcoin Trust ETF | 0.28 | 17.32 | 0.4027 | 0.4027 | |||||
| MCD / McDonald's Corporation | 0.06 | -12.69 | 16.97 | -18.34 | 0.3946 | -0.2192 | |||
| TLH / iShares Trust - iShares 10-20 Year Treasury Bond ETF | 0.16 | -5.12 | 15.94 | -7.08 | 0.3707 | -0.1361 | |||
| ENB / Enbridge Inc. | 0.29 | 10.79 | 13.01 | 13.52 | 0.3027 | -0.0360 | |||
| TRP / TC Energy Corporation | 0.26 | 5.95 | 12.66 | 9.53 | 0.2944 | -0.0470 | |||
| PBA / Pembina Pipeline Corporation | 0.33 | 11.32 | 12.31 | 4.50 | 0.2864 | -0.0618 | |||
| RCI / Rogers Communications Inc. | 0.40 | 18.39 | 11.75 | 31.49 | 0.2732 | 0.0093 | |||
| EMRAF / Emera Incorporated | 0.25 | 11.62 | 0.2703 | 0.2703 | |||||
| BEPC / Brookfield Renewable Corporation | 0.35 | 5.60 | 11.39 | 23.98 | 0.2649 | -0.0065 | |||
| RCL / Royal Caribbean Cruises Ltd. | 0.03 | -5.15 | 9.36 | 44.57 | 0.2176 | 0.0264 | |||
| BKNG / Booking Holdings Inc. | 0.00 | -20.06 | 8.38 | 0.47 | 0.1948 | -0.0515 | |||
| KMI / Kinder Morgan, Inc. | 0.28 | 13.63 | 8.24 | 17.09 | 0.1916 | -0.0163 | |||
| T / AT&T Inc. | 0.28 | 13.63 | 7.98 | 16.27 | 0.1855 | -0.0171 | |||
| EVRG / Evergy, Inc. | 0.11 | 22.46 | 7.91 | 22.44 | 0.1840 | -0.0069 | |||
| HLT / Hilton Worldwide Holdings Inc. | 0.03 | -10.12 | 7.65 | 5.20 | 0.1778 | -0.0369 | |||
| MAR / Marriott International, Inc. | 0.03 | -8.44 | 7.64 | 5.01 | 0.1778 | -0.0373 | |||
| D / Dominion Energy, Inc. | 0.13 | 18.97 | 7.58 | 19.93 | 0.1762 | -0.0104 | |||
| OKE / ONEOK, Inc. | 0.09 | 37.23 | 7.55 | 12.90 | 0.1757 | -0.0220 | |||
| ES / Eversource Energy | 0.12 | 13.63 | 7.34 | 16.40 | 0.1707 | -0.0156 | |||
| ABNB / Airbnb, Inc. | 0.06 | -7.93 | 7.33 | 1.99 | 0.1704 | -0.0418 | |||
| FE / FirstEnergy Corp. | 0.18 | 22.10 | 7.30 | 21.61 | 0.1697 | -0.0076 | |||
| PNW / Pinnacle West Capital Corporation | 0.08 | 13.63 | 7.27 | 6.74 | 0.1691 | -0.0322 | |||
| EIX / Edison International | 0.13 | 7.87 | 6.87 | -5.53 | 0.1597 | -0.0550 | |||
| GSCE / GS Connect S&P GSCI Enhanced Commodity Total Return ETN | 0.01 | -10.25 | 6.80 | 16.29 | 0.1581 | -0.0146 | |||
| C / Citigroup Inc. | 0.08 | -5.59 | 6.72 | 13.20 | 0.1564 | -0.0191 | |||
| SCHR / Schwab Strategic Trust - Schwab Intermediate-Term U.S. Treasury ETF | 0.26 | 5.85 | 6.45 | 6.58 | 0.1499 | -0.0288 | |||
| VGIT / Vanguard Scottsdale Funds - Vanguard Intermediate-Term Treasury ETF | 0.11 | 5.84 | 6.44 | 6.57 | 0.1497 | -0.0287 | |||
| CIWV / Citizens Financial Corp. | 0.14 | -3.29 | 6.39 | 5.63 | 0.1487 | -0.0301 | |||
| BAC / Bank of America Corporation | 0.13 | -13.53 | 6.26 | -1.94 | 0.1457 | -0.0430 | |||
| TFC / Truist Financial Corporation | 0.15 | -1.10 | 6.24 | 3.33 | 0.1452 | -0.0333 | |||
| MTB / M&T Bank Corporation | 0.03 | -7.50 | 6.20 | 0.40 | 0.1442 | -0.0383 | |||
| RF / Regions Financial Corporation | 0.26 | -7.50 | 6.16 | 0.11 | 0.1432 | -0.0385 | |||
| FITB / Fifth Third Bancorp | 0.15 | -4.45 | 6.14 | 0.25 | 0.1427 | -0.0381 | |||
| PNC / The PNC Financial Services Group, Inc. | 0.03 | -7.73 | 6.13 | -2.14 | 0.1426 | -0.0425 | |||
| HBAN / Huntington Bancshares Incorporated | 0.37 | -11.42 | 6.13 | -1.08 | 0.1426 | -0.0405 | |||
| USB / U.S. Bancorp | 0.13 | -9.82 | 5.97 | -3.35 | 0.1388 | -0.0436 | |||
| FCNCA / First Citizens BancShares, Inc. | 0.00 | -4.54 | 5.96 | 0.73 | 0.1387 | -0.0362 | |||
| DAL / Delta Air Lines, Inc. | 0.12 | -4.50 | 5.85 | 7.72 | 0.1360 | -0.0244 | |||
| SU / Suncor Energy Inc. | 0.12 | 1.55 | 4.62 | -1.76 | 0.1075 | -0.0315 | |||
| VICI / VICI Properties Inc. | 0.13 | -7.65 | 4.18 | -7.70 | 0.0973 | -0.0366 | |||
| CNQ / Canadian Natural Resources Limited | 0.13 | -13.33 | 4.10 | -11.46 | 0.0955 | -0.0415 | |||
| BNS / The Bank of Nova Scotia | 0.07 | 13.62 | 3.96 | 32.50 | 0.0922 | 0.0038 | |||
| TD / The Toronto-Dominion Bank | 0.05 | 6.10 | 3.95 | 30.25 | 0.0918 | 0.0023 | |||
| RY / Royal Bank of Canada | 0.03 | 12.79 | 3.94 | 31.95 | 0.0915 | 0.0034 | |||
| CM / Canadian Imperial Bank of Commerce | 0.05 | 4.12 | 3.90 | 31.38 | 0.0907 | 0.0030 | |||
| CCL / Carnival Corporation & plc | 0.13 | -0.66 | 3.69 | 43.07 | 0.0859 | 0.0096 | |||
| SLF / Sun Life Financial Inc. | 0.05 | 1.04 | 3.58 | 17.48 | 0.0832 | -0.0068 | |||
| GDXD / MicroSectors Gold Miners -3X Inverse Leveraged ETNs due June 29, 2040 | 0.03 | 3.30 | 3.51 | 19.89 | 0.0816 | -0.0049 | |||
| FTS / Fortis Inc. | 0.07 | -64.99 | 3.50 | -63.31 | 0.0813 | -0.2002 | |||
| SUI / Sun Communities, Inc. | 0.03 | -1.86 | 3.42 | -3.52 | 0.0796 | -0.0252 | |||
| MFC / Manulife Financial Corporation | 0.10 | 5.58 | 3.34 | 8.33 | 0.0778 | -0.0134 | |||
| TU / TELUS Corporation | 0.20 | -1.17 | 3.26 | 10.64 | 0.0757 | -0.0112 | |||
| QSR / Restaurant Brands International Inc. | 0.05 | 7.98 | 3.24 | 7.45 | 0.0754 | -0.0137 | |||
| UAL / United Airlines Holdings, Inc. | 0.04 | -8.29 | 3.16 | 5.78 | 0.0736 | -0.0148 | |||
| CP / Canadian Pacific Kansas City Limited | 0.04 | 31.52 | 2.86 | 48.93 | 0.0665 | 0.0098 | |||
| MGA / Magna International Inc. | 0.07 | -5.19 | 2.79 | 7.84 | 0.0650 | -0.0116 | |||
| AMT / American Tower Corporation | 0.01 | 17.44 | 2.71 | 19.29 | 0.0630 | -0.0041 | |||
| EXPE / Expedia Group, Inc. | 0.02 | -8.67 | 2.63 | -8.36 | 0.0612 | -0.0236 | |||
| CVE / Cenovus Energy Inc. | 0.19 | 2.56 | 0.0595 | 0.0595 | |||||
| NTR / Nutrien Ltd. | 0.04 | -19.24 | 2.55 | -5.20 | 0.0593 | -0.0202 | |||
| LUV / Southwest Airlines Co. | 0.07 | -9.32 | 2.33 | -12.40 | 0.0541 | -0.0243 | |||
| REG / Regency Centers Corporation | 0.03 | 17.32 | 2.32 | 13.27 | 0.0540 | -0.0065 | |||
| CORZ / Core Scientific, Inc. | 0.13 | 81.92 | 2.30 | 329.48 | 0.0536 | 0.0377 | |||
| MAA / Mid-America Apartment Communities, Inc. | 0.02 | 25.70 | 2.25 | 11.02 | 0.0522 | -0.0075 | |||
| STAG / STAG Industrial, Inc. | 0.06 | 17.26 | 2.23 | 17.76 | 0.0518 | -0.0041 | |||
| XYZ / Block, Inc. | 0.03 | 156.73 | 2.20 | 220.88 | 0.0511 | 0.0309 | |||
| MARA / MARA Holdings, Inc. | 0.13 | 103.89 | 2.10 | 178.25 | 0.0488 | 0.0265 | |||
| INVH / Invitation Homes Inc. | 0.06 | 17.35 | 2.06 | 10.44 | 0.0480 | -0.0072 | |||
| ETN / Eaton Corporation plc | 0.01 | -8.99 | 2.05 | 19.52 | 0.0476 | -0.0030 | |||
| URI / United Rentals, Inc. | 0.00 | -1.46 | 2.04 | 18.48 | 0.0474 | -0.0034 | |||
| RTX / RTX Corporation | 0.01 | 5.67 | 2.03 | 16.49 | 0.0473 | -0.0043 | |||
| FAST / Fastenal Company | 0.05 | 113.11 | 2.02 | 15.41 | 0.0470 | -0.0047 | |||
| CPRT / Copart, Inc. | 0.04 | 30.00 | 2.02 | 12.72 | 0.0470 | -0.0060 | |||
| PH / Parker-Hannifin Corporation | 0.00 | 2.09 | 2.01 | 17.32 | 0.0468 | -0.0039 | |||
| RIOT / Riot Platforms, Inc. | 0.18 | 97.65 | 2.01 | 213.75 | 0.0467 | 0.0278 | |||
| GE / General Electric Company | 0.01 | -8.37 | 2.01 | 17.80 | 0.0466 | -0.0036 | |||
| UNP / Union Pacific Corporation | 0.01 | 16.49 | 2.00 | 13.47 | 0.0465 | -0.0056 | |||
| DE / Deere & Company | 0.00 | 5.68 | 1.99 | 14.52 | 0.0462 | -0.0051 | |||
| UPS / United Parcel Service, Inc. | 0.02 | 23.97 | 1.99 | 13.80 | 0.0462 | -0.0054 | |||
| AME / AMETEK, Inc. | 0.01 | 9.66 | 1.99 | 15.27 | 0.0462 | -0.0047 | |||
| UBER / Uber Technologies, Inc. | 0.02 | -9.65 | 1.98 | 15.72 | 0.0461 | -0.0045 | |||
| RSG / Republic Services, Inc. | 0.01 | 9.84 | 1.98 | 11.88 | 0.0460 | -0.0062 | |||
| LVS / Las Vegas Sands Corp. | 0.05 | -11.12 | 1.98 | 0.10 | 0.0460 | -0.0124 | |||
| GD / General Dynamics Corporation | 0.01 | 4.08 | 1.97 | 11.36 | 0.0458 | -0.0064 | |||
| LMT / Lockheed Martin Corporation | 0.00 | 8.06 | 1.97 | 12.07 | 0.0458 | -0.0061 | |||
| TXT / Textron Inc. | 0.02 | 4.01 | 1.97 | 15.56 | 0.0458 | -0.0045 | |||
| IR / Ingersoll Rand Inc. | 0.02 | 7.08 | 1.94 | 11.28 | 0.0452 | -0.0064 | |||
| O / Realty Income Corporation | 0.03 | 17.28 | 1.93 | 16.46 | 0.0449 | -0.0041 | |||
| GSK / GSK plc - Depositary Receipt (Common Stock) | 0.05 | 0.00 | 1.93 | -0.87 | 0.0448 | -0.0126 | |||
| AEM / Agnico Eagle Mines Limited | 0.02 | 180.69 | 1.90 | 208.93 | 0.0443 | 0.0261 | |||
| ADC / Agree Realty Corporation | 0.03 | 17.41 | 1.89 | 11.14 | 0.0439 | -0.0063 | |||
| GLXY / Galaxy Digital Inc. | 0.09 | 1.88 | 0.0438 | 0.0438 | |||||
| DLR / Digital Realty Trust, Inc. | 0.01 | 3.53 | 1.84 | 25.98 | 0.0428 | -0.0004 | |||
| VLO / Valero Energy Corporation | 0.01 | 0.32 | 1.75 | 2.10 | 0.0408 | -0.0100 | |||
| PSX / Phillips 66 | 0.01 | -4.74 | 1.74 | -7.99 | 0.0405 | -0.0154 | |||
| UDR / UDR, Inc. | 0.04 | 17.25 | 1.71 | 6.00 | 0.0399 | -0.0079 | |||
| PFE / Pfizer Inc. | 0.07 | 0.00 | 1.71 | -4.36 | 0.0398 | -0.0130 | |||
| SPG / Simon Property Group, Inc. | 0.01 | 7.81 | 1.71 | 4.33 | 0.0398 | -0.0086 | |||
| PLD / Prologis, Inc. | 0.02 | 29.44 | 1.70 | 21.70 | 0.0395 | -0.0017 | |||
| SNY / Sanofi - Depositary Receipt (Common Stock) | 0.03 | 0.00 | 1.68 | -12.90 | 0.0391 | -0.0179 | |||
| APA / APA Corporation | 0.09 | 19.58 | 1.68 | 4.04 | 0.0390 | -0.0086 | |||
| PSA / Public Storage | 0.01 | 8.59 | 1.67 | 6.46 | 0.0387 | -0.0075 | |||
| OVV / Ovintiv Inc. | 0.04 | 7.92 | 1.66 | -4.05 | 0.0386 | -0.0125 | |||
| E / Eni S.p.A. - Depositary Receipt (Common Stock) | 0.05 | -20.35 | 1.66 | -16.55 | 0.0386 | -0.0201 | |||
| CLSK / CleanSpark, Inc. | 0.15 | 74.79 | 1.63 | 187.30 | 0.0379 | 0.0211 | |||
| EQNR / Equinor ASA - Depositary Receipt (Common Stock) | 0.06 | -15.41 | 1.61 | -19.61 | 0.0374 | -0.0217 | |||
| DOC / Healthpeak Properties, Inc. | 0.09 | 17.33 | 1.60 | 1.59 | 0.0373 | -0.0093 | |||
| CVX / Chevron Corporation | 0.01 | -3.96 | 1.59 | -17.81 | 0.0369 | -0.0201 | |||
| BP / BP p.l.c. - Depositary Receipt (Common Stock) | 0.05 | -10.01 | 1.57 | -20.30 | 0.0365 | -0.0217 | |||
| GTY / Getty Realty Corp. | 0.06 | 17.33 | 1.57 | 3.98 | 0.0365 | -0.0081 | |||
| H / Hyatt Hotels Corporation | 0.01 | -12.68 | 1.57 | -0.45 | 0.0364 | -0.0101 | |||
| EOG / EOG Resources, Inc. | 0.01 | -3.45 | 1.56 | -9.99 | 0.0363 | -0.0149 | |||
| TTE / TotalEnergies SE - Depositary Receipt (Common Stock) | 0.03 | -18.81 | 1.55 | -22.95 | 0.0361 | -0.0234 | |||
| VIK / Viking Holdings Ltd | 0.03 | 9.19 | 1.54 | 46.48 | 0.0358 | 0.0047 | |||
| OXY / Occidental Petroleum Corporation | 0.04 | 1.53 | 0.0356 | 0.0356 | |||||
| COP / ConocoPhillips | 0.02 | -2.70 | 1.52 | -16.88 | 0.0353 | -0.0186 | |||
| XOM / Exxon Mobil Corporation | 0.01 | -14.40 | 1.51 | -22.41 | 0.0352 | -0.0224 | |||
| IREN / IREN Limited | 0.10 | 122.49 | 1.49 | 432.50 | 0.0347 | 0.0264 | |||
| HOOD / Robinhood Markets, Inc. | 0.02 | 1.47 | 0.0342 | 0.0342 | |||||
| SLB / Schlumberger Limited | 0.04 | 3.11 | 1.44 | -16.63 | 0.0336 | -0.0176 | |||
| HIW / Highwoods Properties, Inc. | 0.04 | 17.34 | 1.38 | 23.10 | 0.0321 | -0.0010 | |||
| HST / Host Hotels & Resorts, Inc. | 0.08 | -9.20 | 1.30 | -1.81 | 0.0303 | -0.0089 | |||
| CCI / Crown Castle Inc. | 0.01 | 17.06 | 1.10 | 15.41 | 0.0256 | -0.0026 | |||
| NCLH / Norwegian Cruise Line Holdings Ltd. | 0.05 | -8.02 | 1.08 | -1.65 | 0.0250 | -0.0073 | |||
| CPT / Camden Property Trust | 0.01 | -1.28 | 1.04 | -9.05 | 0.0241 | -0.0095 | |||
| PAAS / Pan American Silver Corp. | 0.04 | 56.95 | 1.02 | 72.42 | 0.0237 | 0.0062 | |||
| CDE / Coeur Mining, Inc. | 0.11 | 25.33 | 0.98 | 87.72 | 0.0228 | 0.0073 | |||
| WYNN / Wynn Resorts, Limited | 0.01 | -16.45 | 0.97 | -6.27 | 0.0226 | -0.0080 | |||
| WCN / Waste Connections, Inc. | 0.01 | 0.97 | 0.0226 | 0.0226 | |||||
| BTG / B2Gold Corp. | 0.27 | 28.76 | 0.97 | 63.79 | 0.0225 | 0.0050 | |||
| IAG / IAMGOLD Corporation | 0.13 | 42.63 | 0.96 | 68.25 | 0.0223 | 0.0055 | |||
| NEM / Newmont Corporation | 0.02 | 41.75 | 0.96 | 71.07 | 0.0223 | 0.0057 | |||
| ABR0 / Barrick Mining Corporation | 0.05 | 0.95 | 0.0222 | 0.0222 | |||||
| CNI / Canadian National Railway Company | 0.01 | 0.93 | 0.0215 | 0.0215 | |||||
| KGCRF / Kinross Gold Corporation - Equity Right | 0.06 | 16.85 | 0.92 | 44.97 | 0.0215 | 0.0027 | |||
| MGM / MGM Resorts International | 0.03 | -14.97 | 0.91 | -1.40 | 0.0213 | -0.0061 | |||
| AU / AngloGold Ashanti plc | 0.02 | 10.15 | 0.91 | 35.26 | 0.0212 | 0.0013 | |||
| EGO / Eldorado Gold Corporation | 0.04 | 12.29 | 0.88 | 36.00 | 0.0206 | 0.0014 | |||
| AGI / Alamos Gold Inc. | 0.03 | 35.44 | 0.88 | 34.86 | 0.0205 | 0.0012 | |||
| AAL / American Airlines Group Inc. | 0.07 | -13.68 | 0.83 | -8.18 | 0.0193 | -0.0074 | |||
| CIFR / Cipher Mining Inc. | 0.16 | 141.50 | 0.78 | 403.90 | 0.0181 | 0.0135 | |||
| WH / Wyndham Hotels & Resorts, Inc. | 0.01 | -8.66 | 0.76 | -18.05 | 0.0176 | -0.0097 | |||
| EQX / Equinox Gold Corp. | 0.13 | 60.64 | 0.76 | 35.06 | 0.0176 | 0.0010 | |||
| WULF / TeraWulf Inc. | 0.17 | 66.01 | 0.75 | 166.90 | 0.0175 | 0.0091 | |||
| BTDR / Bitdeer Technologies Group | 0.06 | 76.25 | 0.74 | 129.81 | 0.0172 | 0.0077 | |||
| ALK / Alaska Air Group, Inc. | 0.01 | -10.15 | 0.74 | -9.65 | 0.0172 | -0.0070 | |||
| WPML / Wheaton Precious Metals Corp. | 0.01 | 0.73 | 0.0169 | 0.0169 | |||||
| ARE / Alexandria Real Estate Equities, Inc. | 0.01 | 0.57 | 0.71 | -21.03 | 0.0164 | -0.0100 | |||
| RHP / Ryman Hospitality Properties, Inc. | 0.01 | -8.29 | 0.70 | -1.13 | 0.0163 | -0.0046 | |||
| FNV / Franco-Nevada Corporation | 0.00 | 0.33 | 0.70 | 15.49 | 0.0163 | -0.0115 | |||
| CZR / Caesars Entertainment, Inc. | 0.02 | -10.94 | 0.69 | 1.17 | 0.0160 | -0.0041 | |||
| MTN / Vail Resorts, Inc. | 0.00 | 1.08 | 0.69 | -0.72 | 0.0160 | -0.0045 | |||
| TRI / Thomson Reuters Corporation | 0.00 | 0.65 | 0.0152 | 0.0152 | |||||
| RRR / Red Rock Resorts, Inc. | 0.01 | -7.98 | 0.57 | 10.31 | 0.0132 | -0.0020 | |||
| CPA / Copa Holdings, S.A. | 0.01 | -7.92 | 0.55 | 9.49 | 0.0129 | -0.0021 | |||
| BYD / Boyd Gaming Corporation | 0.01 | -23.11 | 0.54 | -8.57 | 0.0127 | -0.0049 | |||
| GIB / CGI Inc. | 0.00 | 116.31 | 0.51 | 128.13 | 0.0119 | 0.0053 | |||
| HUT / Hut 8 Corp. | 0.05 | 70.92 | 0.44 | 33.33 | 0.0102 | 0.0005 | |||
| CHH / Choice Hotels International, Inc. | 0.00 | -5.77 | 0.41 | -9.93 | 0.0095 | -0.0039 | |||
| IBM / International Business Machines Corporation | 0.00 | -38.10 | 0.39 | -26.57 | 0.0090 | -0.0066 | |||
| INTC / Intel Corporation | 0.02 | -22.22 | 0.38 | -23.27 | 0.0088 | -0.0057 | |||
| WIT / Wipro Limited - Depositary Receipt (Common Stock) | 0.12 | -22.65 | 0.36 | -23.68 | 0.0084 | -0.0056 | |||
| SAP / SAP SE - Depositary Receipt (Common Stock) | 0.00 | -40.60 | 0.35 | -32.82 | 0.0082 | -0.0072 | |||
| ORA / Ormat Technologies, Inc. | 0.00 | -3.76 | 0.35 | 14.05 | 0.0081 | -0.0009 | |||
| INFY / Infosys Limited - Depositary Receipt (Common Stock) | 0.02 | -29.00 | 0.35 | -28.01 | 0.0081 | -0.0062 | |||
| CWENA / Clearway Energy Inc - Class A | 0.01 | -3.74 | 0.34 | 2.39 | 0.0080 | -0.0019 | |||
| MA / Mastercard Incorporated | 0.00 | -39.80 | 0.34 | -38.35 | 0.0078 | -0.0083 | |||
| STN / Stantec Inc. | 0.00 | 0.33 | 0.0076 | 0.0076 | |||||
| JKS / JinkoSolar Holding Co., Ltd. - Depositary Receipt (Common Stock) | 0.01 | -3.77 | 0.29 | 9.29 | 0.0069 | -0.0011 | |||
| RNW / ReNew Energy Global Plc | 0.04 | -3.76 | 0.28 | 13.06 | 0.0065 | -0.0008 | |||
| FSLR / First Solar, Inc. | 0.00 | -3.86 | 0.26 | 25.84 | 0.0061 | -0.0001 | |||
| SHLS / Shoals Technologies Group, Inc. | 0.06 | -3.77 | 0.26 | 23.44 | 0.0060 | -0.0002 | |||
| BCE / BCE Inc. | 0.01 | 0.26 | 0.0060 | 0.0060 | |||||
| DSG / The Descartes Systems Group Inc. | 0.00 | 0.25 | 0.0058 | 0.0058 | |||||
| DQ / Daqo New Energy Corp. - Depositary Receipt (Common Stock) | 0.02 | -3.78 | 0.25 | -19.41 | 0.0057 | -0.0033 | |||
| RUN / Sunrun Inc. | 0.03 | -3.76 | 0.25 | 34.62 | 0.0057 | 0.0003 | |||
| ARRY / Array Technologies, Inc. | 0.04 | -3.77 | 0.24 | 16.92 | 0.0055 | -0.0005 | |||
| ENS / EnerSys | 0.00 | -3.72 | 0.23 | -9.80 | 0.0054 | -0.0022 | |||
| DEFTF / DeFi Technologies Inc. | 0.08 | 0.23 | 0.0053 | 0.0053 | |||||
| PLUG / Plug Power Inc. | 0.13 | -3.76 | 0.19 | 6.18 | 0.0044 | -0.0009 | |||
| AMRC / Ameresco, Inc. | 0.01 | -3.78 | 0.18 | 21.19 | 0.0043 | -0.0002 | |||
| PSFE / Paysafe Limited | 0.01 | 22.23 | 0.17 | -1.75 | 0.0039 | -0.0011 | |||
| FUFU / BitFuFu Inc. | 0.04 | 0.14 | 0.0033 | 0.0033 | |||||
| FLNC / Fluence Energy, Inc. | 0.02 | -3.77 | 0.13 | 33.00 | 0.0031 | 0.0001 | |||
| MFH / Mercurity Fintech Holding Inc. | 0.03 | 171.76 | 0.13 | 96.92 | 0.0030 | 0.0010 | |||
| BITF / Bitfarms Ltd. | 0.15 | 40.63 | 0.12 | 49.38 | 0.0028 | 0.0004 | |||
| BTBT / Bit Digital, Inc. | 0.05 | 21.66 | 0.12 | 32.22 | 0.0028 | 0.0001 | |||
| HIVE / HIVE Digital Technologies Ltd. | 0.06 | 37.99 | 0.12 | 70.59 | 0.0027 | 0.0007 | |||
| FLD / Fold Holdings, Inc. | 0.01 | 0.04 | 0.0010 | 0.0010 | |||||
| ARBK / Argo Blockchain plc - Depositary Receipt (Common Stock) | 0.06 | 144.92 | 0.01 | 42.86 | 0.0002 | 0.0000 | |||
| ENPH / Enphase Energy, Inc. | 0.00 | -100.00 | 0.00 | 0.0000 | |||||
| GOLD / Barrick Mining Corporation | 0.00 | -100.00 | 0.00 | 0.0000 | |||||
| KNTK / Kinetik Holdings Inc. | 0.00 | -100.00 | 0.00 | 0.0000 | |||||
| MUR / Murphy Oil Corporation | 0.00 | -100.00 | 0.00 | 0.0000 | |||||
| AQNB / Algonquin Power & Utilities Corp. - Corporate Bond/Note | 0.00 | -100.00 | 0.00 | 0.0000 | |||||
| DGXX / Digi Power X Inc. | 0.00 | -100.00 | 0.00 | 0.0000 | |||||
| RBA / RB Global, Inc. | 0.00 | -100.00 | 0.00 | 0.0000 |