Basic Stats
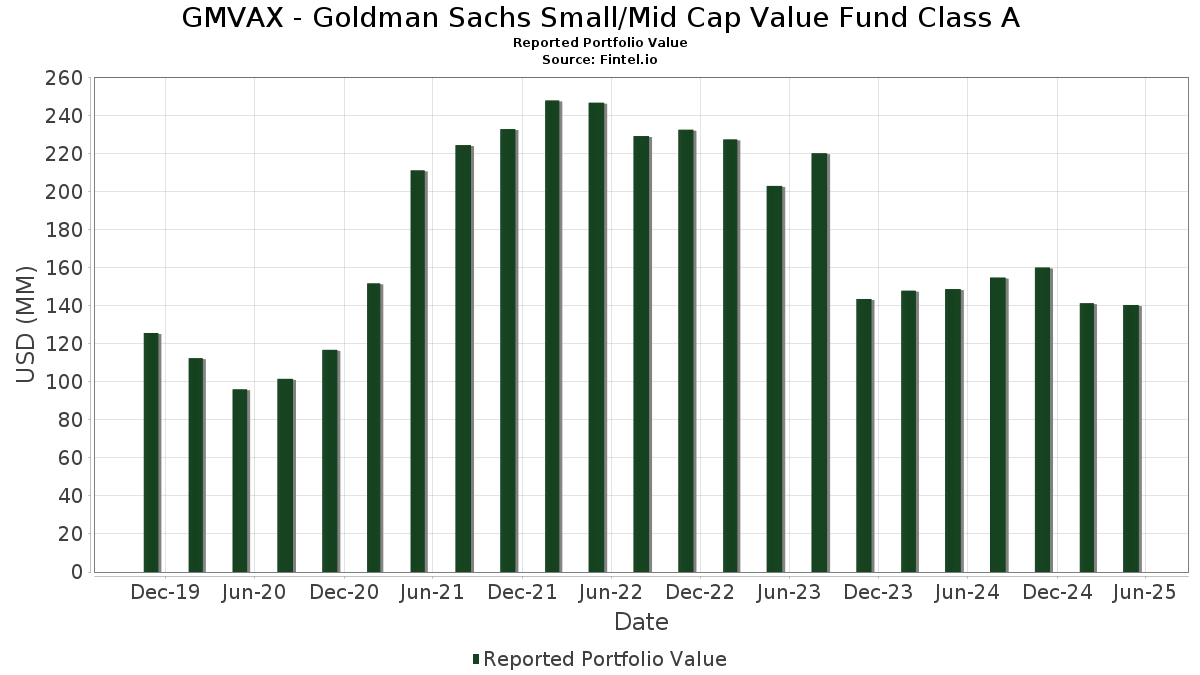
| Portfolio Value | $ 140,438,489 |
| Current Positions | 113 |
Latest Holdings, Performance, AUM (from 13F, 13D)
GMVAX - Goldman Sachs Small/Mid Cap Value Fund Class A has disclosed 113 total holdings in their latest SEC filings. Most recent portfolio value is calculated to be $ 140,438,489 USD. Actual Assets Under Management (AUM) is this value plus cash (which is not disclosed). GMVAX - Goldman Sachs Small/Mid Cap Value Fund Class A’s top holdings are Regency Centers Corporation (US:REG) , Curtiss-Wright Corporation (US:CW) , East West Bancorp, Inc. (US:EWBC) , TXNM Energy, Inc. (US:TXNM) , and Webster Financial Corporation (US:WBS) . GMVAX - Goldman Sachs Small/Mid Cap Value Fund Class A’s new positions include Primo Brands Corporation (US:PRMB) , Flowserve Corporation (US:FLS) , Valvoline Inc. (US:VVV) , BlackLine, Inc. (US:BL) , and ESC GCI LIBERTY INC SR (US:US361ESC0496) .
Top Increases This Quarter
We use the change in the portfolio allocation because this is the most meaningful metric. Changes can be due to trades or changes in share prices.
| Security | Shares (MM) |
Value (MM$) |
Portfolio % | ΔPortfolio % |
|---|---|---|---|---|
| 0.05 | 1.49 | 1.0607 | 1.0607 | |
| 0.03 | 1.29 | 0.9187 | 0.9187 | |
| 0.01 | 2.57 | 1.8258 | 0.8078 | |
| 0.01 | 1.79 | 1.2710 | 0.7693 | |
| 0.00 | 1.81 | 1.2879 | 0.5971 | |
| 0.06 | 0.95 | 0.6745 | 0.5712 | |
| 0.02 | 2.22 | 1.5788 | 0.4994 | |
| 0.02 | 0.66 | 0.4687 | 0.4687 | |
| 0.01 | 0.65 | 0.4581 | 0.4581 | |
| 0.01 | 1.81 | 1.2858 | 0.3741 |
Top Decreases This Quarter
We use the change in the portfolio allocation because this is the most meaningful metric. Changes can be due to trades or changes in share prices.
| Security | Shares (MM) |
Value (MM$) |
Portfolio % | ΔPortfolio % |
|---|---|---|---|---|
| 0.04 | 1.75 | 1.2439 | -0.3650 | |
| 0.01 | 1.39 | 0.9866 | -0.3233 | |
| 0.01 | 0.86 | 0.6092 | -0.3167 | |
| 0.00 | 0.79 | 0.5584 | -0.2623 | |
| 0.01 | 0.68 | 0.4798 | -0.2610 | |
| 0.01 | 0.78 | 0.5539 | -0.2268 | |
| 0.02 | 1.09 | 0.7747 | -0.2238 | |
| 0.01 | 1.56 | 1.1041 | -0.1947 | |
| 0.00 | 0.00 | -0.1750 | ||
| 0.01 | 0.92 | 0.6558 | -0.1592 |
13F and Fund Filings
This form was filed on 2025-07-22 for the reporting period 2025-05-31. Click the link icon to see the full transaction history.
Upgrade to unlock premium data and export to Excel ![]() .
.
| Security | Type | Avg Share Price | Shares (MM) |
ΔShares (%) |
ΔShares (%) |
Value ($MM) |
Portfolio (%) |
ΔPortfolio (%) |
|
|---|---|---|---|---|---|---|---|---|---|
| REG / Regency Centers Corporation | 0.04 | 3.58 | 2.74 | -2.56 | 1.9448 | -0.0184 | |||
| CW / Curtiss-Wright Corporation | 0.01 | 28.92 | 2.57 | 76.41 | 1.8258 | 0.8078 | |||
| EWBC / East West Bancorp, Inc. | 0.03 | 3.58 | 2.56 | 0.00 | 1.8187 | 0.0305 | |||
| TXNM / TXNM Energy, Inc. | 0.04 | 3.58 | 2.47 | 12.36 | 1.7554 | 0.2191 | |||
| WBS / Webster Financial Corporation | 0.04 | 3.58 | 2.25 | -5.31 | 1.5966 | -0.0620 | |||
| PNR / Pentair plc | 0.02 | 36.64 | 2.22 | 43.95 | 1.5788 | 0.4994 | |||
| PB / Prosperity Bancshares, Inc. | 0.03 | 3.58 | 2.21 | -6.03 | 1.5714 | -0.0731 | |||
| RRC / Range Resources Corporation | 0.06 | 3.58 | 2.14 | 6.16 | 1.5166 | 0.1113 | |||
| GTES / Gates Industrial Corporation plc | 0.09 | 3.58 | 2.00 | 1.22 | 1.4189 | 0.0404 | |||
| IDA / IDACORP, Inc. | 0.02 | 11.36 | 1.97 | 12.34 | 1.3959 | 0.1739 | |||
| SNX / TD SYNNEX Corporation | 0.02 | 3.58 | 1.87 | -8.60 | 1.3287 | -0.1009 | |||
| MTG / MGIC Investment Corporation | 0.07 | 3.58 | 1.87 | 11.27 | 1.3253 | 0.1544 | |||
| NI / NiSource Inc. | 0.05 | 3.58 | 1.83 | 0.33 | 1.2996 | 0.0259 | |||
| CACI / CACI International Inc | 0.00 | 43.45 | 1.81 | 83.42 | 1.2879 | 0.5971 | |||
| SPXC / SPX Technologies, Inc. | 0.01 | 32.84 | 1.81 | 38.77 | 1.2858 | 0.3741 | |||
| MTZ / MasTec, Inc. | 0.01 | 108.69 | 1.79 | 149.30 | 1.2710 | 0.7693 | |||
| ESAB / ESAB Corporation | 0.01 | 3.57 | 1.76 | 1.67 | 1.2524 | 0.0408 | |||
| JEF / Jefferies Financial Group Inc. | 0.04 | 3.58 | 1.75 | -23.96 | 1.2439 | -0.3650 | |||
| US7587501039 / Regal-Beloit Corp. | 0.01 | 3.58 | 1.75 | 6.79 | 1.2401 | 0.0982 | |||
| PFSI / PennyMac Financial Services, Inc. | 0.02 | 23.69 | 1.73 | 14.61 | 1.2310 | 0.1741 | |||
| CR / Crane Company | 0.01 | 3.60 | 1.72 | 8.92 | 1.2229 | 0.1189 | |||
| CCK / Crown Holdings, Inc. | 0.02 | 3.57 | 1.71 | 13.87 | 1.2127 | 0.1648 | |||
| STAG / STAG Industrial, Inc. | 0.05 | 3.58 | 1.71 | 2.40 | 1.2123 | 0.0482 | |||
| SF / Stifel Financial Corp. | 0.02 | 3.58 | 1.70 | -8.14 | 1.2103 | -0.0850 | |||
| KBR / KBR, Inc. | 0.03 | 3.58 | 1.69 | 10.27 | 1.1962 | 0.1291 | |||
| SSB / SouthState Corporation | 0.02 | 3.57 | 1.67 | -9.81 | 1.1888 | -0.1072 | |||
| WTFC / Wintrust Financial Corporation | 0.01 | 3.57 | 1.66 | -0.60 | 1.1807 | 0.0119 | |||
| AMH / American Homes 4 Rent | 0.04 | 3.58 | 1.62 | 5.97 | 1.1466 | 0.0820 | |||
| KMPR / Kemper Corporation | 0.03 | 3.57 | 1.61 | -2.31 | 1.1432 | -0.0080 | |||
| RPM / RPM International Inc. | 0.01 | 3.57 | 1.57 | -4.84 | 1.1164 | -0.0374 | |||
| ELS / Equity LifeStyle Properties, Inc. | 0.02 | 26.76 | 1.57 | 17.57 | 1.1117 | 0.1812 | |||
| COOP / Mr. Cooper Group Inc. | 0.01 | -27.47 | 1.56 | -16.40 | 1.1041 | -0.1947 | |||
| RS / Reliance, Inc. | 0.01 | 3.60 | 1.55 | 2.11 | 1.1021 | 0.0403 | |||
| PNFP / Pinnacle Financial Partners, Inc. | 0.01 | 3.57 | 1.55 | -3.67 | 1.1008 | -0.0230 | |||
| GPI / Group 1 Automotive, Inc. | 0.00 | 3.60 | 1.54 | -4.42 | 1.0912 | -0.0319 | |||
| AFG / American Financial Group, Inc. | 0.01 | 3.58 | 1.54 | 1.72 | 1.0905 | 0.0358 | |||
| EQT / EQT Corporation | 0.03 | 3.57 | 1.51 | 18.57 | 1.0698 | 0.1822 | |||
| ACM / AECOM | 0.01 | 3.58 | 1.50 | 13.67 | 1.0633 | 0.1437 | |||
| PRMB / Primo Brands Corporation | 0.05 | 1.49 | 1.0607 | 1.0607 | |||||
| EG / Everest Group, Ltd. | 0.00 | 3.59 | 1.49 | 1.78 | 1.0583 | 0.0361 | |||
| CUBE / CubeSmart | 0.03 | 3.58 | 1.45 | 7.25 | 1.0298 | 0.0858 | |||
| TOL / Toll Brothers, Inc. | 0.01 | 3.57 | 1.45 | -3.28 | 1.0258 | -0.0174 | |||
| IWN / iShares Trust - iShares Russell 2000 Value ETF | 0.01 | 4.40 | 1.39 | -12.66 | 0.9892 | -0.0037 | |||
| BJ / BJ's Wholesale Club Holdings, Inc. | 0.01 | -33.74 | 1.39 | -25.96 | 0.9866 | -0.3233 | |||
| NLY / Annaly Capital Management, Inc. | 0.07 | 3.58 | 1.32 | -10.67 | 0.9397 | -0.0943 | |||
| FLS / Flowserve Corporation | 0.03 | 1.29 | 0.9187 | 0.9187 | |||||
| PR / Permian Resources Corporation | 0.10 | 9.00 | 1.29 | -2.42 | 0.9153 | -0.0075 | |||
| JBL / Jabil Inc. | 0.01 | 24.72 | 1.27 | 35.18 | 0.9007 | 0.2458 | |||
| IRT / Independence Realty Trust, Inc. | 0.07 | 39.20 | 1.25 | 18.67 | 0.8852 | 0.1517 | |||
| ATI / ATI Inc. | 0.02 | 3.57 | 1.23 | 41.72 | 0.8759 | 0.2685 | |||
| FTI / TechnipFMC plc | 0.04 | 3.58 | 1.23 | 9.63 | 0.8732 | 0.0896 | |||
| MTH / Meritage Homes Corporation | 0.02 | 3.58 | 1.22 | -9.11 | 0.8645 | -0.0708 | |||
| CNO / CNO Financial Group, Inc. | 0.03 | 3.58 | 1.22 | -5.67 | 0.8629 | -0.0370 | |||
| WCC / WESCO International, Inc. | 0.01 | 3.59 | 1.21 | -3.65 | 0.8620 | -0.0177 | |||
| MOGA / Moog, Inc. - Class A | 0.01 | 3.61 | 1.21 | 12.58 | 0.8580 | 0.1086 | |||
| JLL / Jones Lang LaSalle Incorporated | 0.01 | 3.59 | 1.20 | -15.18 | 0.8531 | -0.1358 | |||
| AN / AutoNation, Inc. | 0.01 | 3.59 | 1.20 | 4.36 | 0.8504 | 0.0495 | |||
| EVR / Evercore Inc. | 0.01 | 28.43 | 1.20 | 22.94 | 0.8484 | 0.1698 | |||
| KN / Knowles Corporation | 0.07 | 30.88 | 1.17 | 29.46 | 0.8305 | 0.1995 | |||
| OMF / OneMain Holdings, Inc. | 0.02 | 3.58 | 1.13 | -0.09 | 0.8034 | 0.0126 | |||
| COHR / Coherent Corp. | 0.01 | 3.57 | 1.12 | 4.20 | 0.7934 | 0.0444 | |||
| GL / Globe Life Inc. | 0.01 | 3.57 | 1.11 | -0.98 | 0.7900 | 0.0056 | |||
| CASY / Casey's General Stores, Inc. | 0.00 | 3.63 | 1.11 | 9.46 | 0.7893 | 0.0805 | |||
| MTSI / MACOM Technology Solutions Holdings, Inc. | 0.01 | 22.94 | 1.10 | 29.36 | 0.7788 | 0.1862 | |||
| GMED / Globus Medical, Inc. | 0.02 | 3.57 | 1.09 | -23.71 | 0.7747 | -0.2238 | |||
| SLGN / Silgan Holdings Inc. | 0.02 | 3.57 | 1.07 | 5.01 | 0.7593 | 0.0482 | |||
| US38141W2733 / Goldman Sachs Financial Square Funds - Government Fund | 1.07 | -0.69 | 1.07 | -0.65 | 0.7571 | 0.0073 | |||
| FUL / H.B. Fuller Company | 0.02 | 3.57 | 1.04 | 1.86 | 0.7408 | 0.0257 | |||
| FLEX / Flex Ltd. | 0.02 | 3.58 | 1.03 | 15.60 | 0.7315 | 0.1093 | |||
| US4039491000 / HF Sinclair Corp. | 0.03 | 3.58 | 1.02 | 6.03 | 0.7247 | 0.0529 | |||
| HIW / Highwoods Properties, Inc. | 0.03 | 3.58 | 1.02 | 5.59 | 0.7243 | 0.0497 | |||
| CMC / Commercial Metals Company | 0.02 | 3.58 | 1.02 | -0.29 | 0.7220 | 0.0092 | |||
| ASGN / ASGN Incorporated | 0.02 | 3.58 | 1.01 | -18.88 | 0.7176 | -0.1518 | |||
| BLD / TopBuild Corp. | 0.00 | 3.63 | 1.00 | -4.39 | 0.7113 | -0.0199 | |||
| QRVO / Qorvo, Inc. | 0.01 | 48.43 | 0.99 | 55.36 | 0.6995 | 0.2563 | |||
| TECH / Bio-Techne Corporation | 0.02 | 3.57 | 0.98 | -18.82 | 0.6951 | -0.1470 | |||
| DAN / Dana Incorporated | 0.06 | 600.04 | 0.95 | 711.97 | 0.6745 | 0.5712 | |||
| RGLD / Royal Gold, Inc. | 0.01 | 3.61 | 0.94 | 25.47 | 0.6685 | 0.1448 | |||
| WH / Wyndham Hotels & Resorts, Inc. | 0.01 | 3.57 | 0.92 | -20.91 | 0.6558 | -0.1592 | |||
| AIT / Applied Industrial Technologies, Inc. | 0.00 | 71.28 | 0.91 | 54.93 | 0.6472 | 0.2361 | |||
| LADR / Ladder Capital Corp | 0.09 | 3.58 | 0.91 | -8.21 | 0.6434 | -0.0459 | |||
| GPK / Graphic Packaging Holding Company | 0.04 | 3.58 | 0.91 | -13.73 | 0.6428 | -0.0901 | |||
| ECPG / Encore Capital Group, Inc. | 0.02 | 3.58 | 0.89 | 3.99 | 0.6296 | 0.0347 | |||
| RNR / RenaissanceRe Holdings Ltd. | 0.00 | 50.13 | 0.88 | 124.23 | 0.6241 | 0.3638 | |||
| OLLI / Ollie's Bargain Outlet Holdings, Inc. | 0.01 | 37.64 | 0.88 | 48.23 | 0.6240 | 0.2099 | |||
| SIGI / Selective Insurance Group, Inc. | 0.01 | 3.56 | 0.88 | 5.92 | 0.6227 | 0.0446 | |||
| ACA / Arcosa, Inc. | 0.01 | -37.08 | 0.86 | -35.29 | 0.6092 | -0.3167 | |||
| GVA / Granite Construction Incorporated | 0.01 | 3.56 | 0.85 | 12.22 | 0.6003 | 0.0740 | |||
| VOYA / Voya Financial, Inc. | 0.01 | 3.58 | 0.83 | -4.60 | 0.5894 | -0.0186 | |||
| PPBI / Pacific Premier Bancorp, Inc. | 0.04 | 3.58 | 0.81 | -8.08 | 0.5737 | -0.0402 | |||
| FCFS / FirstCash Holdings, Inc. | 0.01 | 3.57 | 0.79 | 18.01 | 0.5635 | 0.0938 | |||
| SKX / Skechers U.S.A., Inc. | 0.01 | -18.55 | 0.79 | -17.16 | 0.5592 | -0.1046 | |||
| SAIA / Saia, Inc. | 0.00 | 3.62 | 0.79 | -33.11 | 0.5584 | -0.2623 | |||
| ITRI / Itron, Inc. | 0.01 | -46.17 | 0.78 | -32.87 | 0.5539 | -0.2268 | |||
| AVY / Avery Dennison Corporation | 0.00 | 3.60 | 0.74 | -1.98 | 0.5264 | -0.0021 | |||
| CUZ / Cousins Properties Incorporated | 0.03 | 3.58 | 0.72 | -4.12 | 0.5120 | -0.0133 | |||
| DECK / Deckers Outdoor Corporation | 0.01 | 1,068.94 | 0.71 | 37.62 | 0.5017 | 0.1570 | |||
| CHDN / Churchill Downs Incorporated | 0.01 | 3.56 | 0.69 | -16.65 | 0.4876 | -0.0872 | |||
| CROX / Crocs, Inc. | 0.01 | -37.81 | 0.68 | -36.38 | 0.4798 | -0.2610 | |||
| VVV / Valvoline Inc. | 0.02 | 0.66 | 0.4687 | 0.4687 | |||||
| BL / BlackLine, Inc. | 0.01 | 0.65 | 0.4581 | 0.4581 | |||||
| ENOV / Enovis Corporation | 0.02 | 3.58 | 0.63 | -16.06 | 0.4451 | -0.0768 | |||
| BC / Brunswick Corporation | 0.01 | 3.57 | 0.58 | -13.88 | 0.4102 | -0.0580 | |||
| UTHR / United Therapeutics Corporation | 0.00 | 3.65 | 0.52 | 3.21 | 0.3662 | 0.0174 | |||
| NE / Noble Corporation plc | 0.02 | 3.57 | 0.50 | -1.00 | 0.3526 | 0.0025 | |||
| BRKR / Bruker Corporation | 0.01 | 3.57 | 0.45 | -19.50 | 0.3225 | -0.0715 | |||
| SMTC / Semtech Corporation | 0.01 | 3.57 | 0.40 | 1.27 | 0.2844 | 0.0081 | |||
| ONTO / Onto Innovation Inc. | 0.00 | 3.57 | 0.40 | -34.60 | 0.2821 | -0.1423 | |||
| TENB / Tenable Holdings, Inc. | 0.01 | 3.57 | 0.40 | -12.58 | 0.2817 | -0.0350 | |||
| NEO / NeoGenomics, Inc. | 0.05 | 3.58 | 0.37 | -24.49 | 0.2605 | -0.0790 | |||
| TGNA / TEGNA Inc. | 0.02 | 3.58 | 0.32 | -4.80 | 0.2254 | -0.0076 | |||
| CYTK / Cytokinetics, Incorporated | 0.01 | 3.56 | 0.20 | -30.45 | 0.1434 | -0.0585 | |||
| CRNX / Crinetics Pharmaceuticals, Inc. | 0.00 | 3.55 | 0.13 | -11.64 | 0.0917 | -0.0104 | |||
| US361ESC0496 / ESC GCI LIBERTY INC SR | 0.00 | 0.00 | 0.0000 | 0.0000 | |||||
| FIVE / Five Below, Inc. | 0.00 | -100.00 | 0.00 | -100.00 | -0.1750 |