Basic Stats
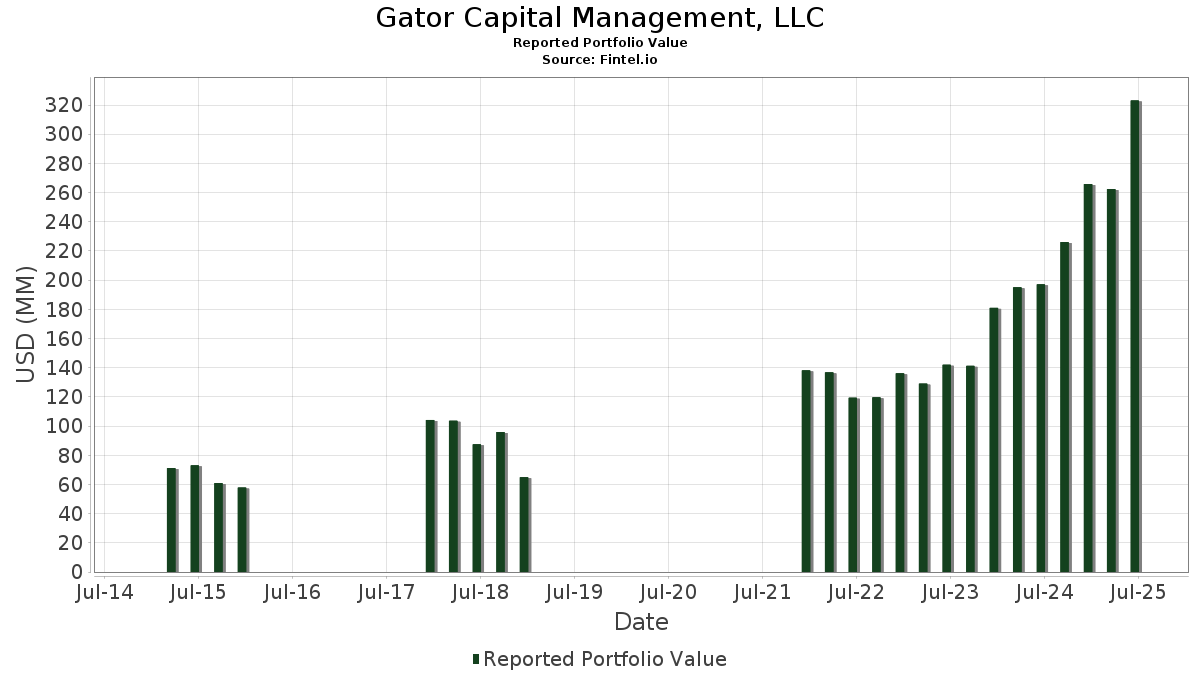
| Portfolio Value | $ 323,053,733 |
| Current Positions | 73 |
Latest Holdings, Performance, AUM (from 13F, 13D)
Gator Capital Management, LLC has disclosed 73 total holdings in their latest SEC filings. Most recent portfolio value is calculated to be $ 323,053,733 USD. Actual Assets Under Management (AUM) is this value plus cash (which is not disclosed). Gator Capital Management, LLC’s top holdings are Robinhood Markets, Inc. (US:HOOD) , First Citizens BancShares, Inc. (US:FCNCA) , SLM Corporation (US:SLM) , Axos Financial, Inc. (US:AX) , and Virtus Investment Partners, Inc. (US:VRTS) . Gator Capital Management, LLC’s new positions include Orange County Bancorp, Inc. (US:OBT) , WisdomTree, Inc. (US:WT) , . Gator Capital Management, LLC’s top industries are "Printing, Publishing, And Allied Industries" (sic 27) , "Primary Metal Industries" (sic 33) , and "Measuring, Analyzing, And Controlling Instruments; Photographic, Medical And Optical Goods; Watches And Clocks" (sic 38) .
Top Increases This Quarter
We use the change in the portfolio allocation because this is the most meaningful metric. Changes can be due to trades or changes in share prices.
| Security | Shares (MM) |
Value (MM$) |
Portfolio % | ΔPortfolio % |
|---|---|---|---|---|
| 0.56 | 52.16 | 16.1463 | 6.9326 | |
| 0.07 | 9.62 | 2.9764 | 2.8088 | |
| 0.07 | 1.18 | 0.3661 | 0.3661 | |
| 0.18 | 1.44 | 0.4445 | 0.2670 | |
| 0.02 | 0.52 | 0.1600 | 0.1600 | |
| 0.00 | 1.55 | 0.4783 | 0.1167 | |
| 0.03 | 1.57 | 0.4847 | 0.1166 | |
| 0.02 | 0.28 | 0.0858 | 0.0858 | |
| 0.02 | 0.25 | 0.0789 | 0.0789 | |
| 0.28 | 6.53 | 2.0221 | 0.0696 |
Top Decreases This Quarter
We use the change in the portfolio allocation because this is the most meaningful metric. Changes can be due to trades or changes in share prices.
| Security | Shares (MM) |
Value (MM$) |
Portfolio % | ΔPortfolio % |
|---|---|---|---|---|
| 0.09 | 6.93 | 2.1462 | -1.0906 | |
| 0.01 | 17.12 | 5.2985 | -1.0216 | |
| 0.27 | 4.16 | 1.2876 | -0.7385 | |
| 0.11 | 9.82 | 3.0412 | -0.5881 | |
| 0.06 | 11.01 | 3.4090 | -0.5860 | |
| 0.10 | 10.64 | 3.2934 | -0.5784 | |
| 0.07 | 6.53 | 2.0228 | -0.5393 | |
| 0.09 | 7.13 | 2.2081 | -0.4562 | |
| 0.40 | 13.26 | 4.1047 | -0.4381 | |
| 0.20 | 8.66 | 2.6819 | -0.4059 |
13D/G Filings
This is a list of 13D and 13G filings made in the last year (if any). Click the link icon to see the full transaction history. Green rows indicate new positions. Red rows indicate closed positions.
| File Date | Form | Security | Prev Shares |
Current Shares |
ΔShares % | % Ownership |
% ΔOwnership | |
|---|---|---|---|---|---|---|---|---|
| 2025-08-05 | GROW / U.S. Global Investors, Inc. | 596,734 | 684,223 | 14.66 | 6.18 | 18.62 | ||
| 2025-08-05 | SOHO / Sotherly Hotels Inc. | 1,000,187 | 1,002,962 | 0.28 | 4.89 | -2.98 | ||
| 2024-11-29 | CBNA / Chain Bridge Bancorp, Inc. | 165,000 | 199,722 | 21.04 | 10.80 | 21.08 |
13F and Fund Filings
This form was filed on 2025-08-13 for the reporting period 2025-06-30. Click the link icon to see the full transaction history.
Upgrade to unlock premium data and export to Excel ![]() .
.
| Security | Type | Avg Share Price | Shares (MM) |
ΔShares (%) |
ΔShares (%) |
Value ($MM) |
Portfolio (%) |
ΔPortfolio (%) |
|
|---|---|---|---|---|---|---|---|---|---|
| HOOD / Robinhood Markets, Inc. | 0.56 | -4.08 | 52.16 | 115.79 | 16.1463 | 6.9326 | |||
| FCNCA / First Citizens BancShares, Inc. | 0.01 | -2.17 | 17.12 | 3.23 | 5.2985 | -1.0216 | |||
| SLM / SLM Corporation | 0.40 | -0.34 | 13.26 | 11.26 | 4.1047 | -0.4381 | |||
| AX / Axos Financial, Inc. | 0.15 | 0.00 | 11.65 | 17.85 | 3.6067 | -0.1616 | |||
| VRTS / Virtus Investment Partners, Inc. | 0.06 | -0.16 | 11.01 | 5.07 | 3.4090 | -0.5860 | |||
| UMBF / UMB Financial Corporation | 0.10 | 0.70 | 10.64 | 4.74 | 3.2934 | -0.5784 | |||
| CUBI / Customers Bancorp, Inc. | 0.17 | -5.70 | 9.88 | 10.35 | 3.0592 | -0.3546 | |||
| JXN / Jackson Financial Inc. | 0.11 | -2.64 | 9.82 | 3.18 | 3.0412 | -0.5881 | |||
| WEX / WEX Inc. | 0.07 | 2,237.02 | 9.62 | 2,090.21 | 2.9764 | 2.8088 | |||
| BCS / Barclays PLC - Depositary Receipt (Common Stock) | 0.51 | -1.53 | 9.54 | 19.17 | 2.9545 | -0.0982 | |||
| HOUS / Anywhere Real Estate Inc. | 2.55 | -0.25 | 9.24 | 8.43 | 2.8593 | -0.3876 | |||
| CRBG / Corebridge Financial, Inc. | 0.25 | 0.00 | 8.82 | 12.44 | 2.7307 | -0.2595 | |||
| ESQ / Esquire Financial Holdings, Inc. | 0.09 | 0.00 | 8.81 | 25.59 | 2.7268 | 0.0530 | |||
| OFG / OFG Bancorp | 0.20 | 0.00 | 8.66 | 6.95 | 2.6819 | -0.4059 | |||
| CG / The Carlyle Group Inc. | 0.16 | -0.37 | 8.30 | 17.48 | 2.5701 | -0.1237 | |||
| VCTR / Victory Capital Holdings, Inc. | 0.13 | -0.46 | 8.29 | 9.51 | 2.5657 | -0.3190 | |||
| PYPL / PayPal Holdings, Inc. | 0.11 | -0.34 | 8.14 | 13.52 | 2.5204 | -0.2135 | |||
| WAL / Western Alliance Bancorporation | 0.09 | 0.55 | 7.13 | 2.06 | 2.2081 | -0.4562 | |||
| GPN / Global Payments Inc. | 0.09 | -0.12 | 6.93 | -18.36 | 2.1462 | -1.0906 | |||
| NBN / Northeast Bank | 0.07 | 0.00 | 6.53 | -2.80 | 2.0228 | -0.5393 | |||
| CNOB / ConnectOne Bancorp, Inc. | 0.28 | 33.86 | 6.53 | 27.53 | 2.0221 | 0.0696 | |||
| OSBC / Old Second Bancorp, Inc. | 0.33 | -0.39 | 5.91 | 6.20 | 1.8283 | -0.2916 | |||
| CBNA / Chain Bridge Bancorp, Inc. | 0.20 | 0.00 | 5.22 | 8.37 | 1.6153 | -0.2201 | |||
| OMF / OneMain Holdings, Inc. | 0.08 | -7.20 | 4.78 | 8.22 | 1.4795 | -0.2039 | |||
| BANC / Banc of California, Inc. | 0.32 | -0.49 | 4.53 | -1.48 | 1.4036 | -0.3506 | |||
| KINS / Kingstone Companies, Inc. | 0.27 | -15.45 | 4.16 | -21.75 | 1.2876 | -0.7385 | |||
| WBS / Webster Financial Corporation | 0.07 | 0.00 | 4.06 | 5.92 | 1.2575 | -0.2044 | |||
| RSP / Invesco Exchange-Traded Fund Trust - Invesco S&P 500 Equal Weight ETF | 0.02 | 0.41 | 4.02 | 5.35 | 1.2437 | -0.2100 | |||
| OPBK / OP Bancorp | 0.25 | 0.00 | 3.30 | 8.08 | 1.0224 | -0.1425 | |||
| CBNK / Capital Bancorp, Inc. | 0.09 | 0.00 | 2.99 | 18.54 | 0.9243 | -0.0359 | |||
| HMST / HomeStreet, Inc. | 0.22 | 16.76 | 2.88 | 29.97 | 0.8929 | 0.0470 | |||
| DCOM / Dime Community Bancshares, Inc. | 0.09 | 0.00 | 2.52 | -3.38 | 0.7792 | -0.2137 | |||
| TFC / Truist Financial Corporation | 0.06 | 0.00 | 2.49 | 4.48 | 0.7718 | -0.1379 | |||
| IBKR / Interactive Brokers Group, Inc. | 0.04 | 300.00 | 2.26 | 33.81 | 0.6998 | 0.0560 | |||
| XYZ / Block, Inc. | 0.03 | 0.00 | 2.13 | 25.10 | 0.6603 | 0.0100 | |||
| GROW / U.S. Global Investors, Inc. | 0.68 | 5.47 | 1.78 | 21.28 | 0.5507 | -0.0082 | |||
| UBS / UBS Group AG | 0.05 | 0.00 | 1.61 | 10.43 | 0.4983 | -0.0574 | |||
| BWB / Bridgewater Bancshares, Inc. | 0.10 | -0.94 | 1.60 | 13.51 | 0.4941 | -0.0421 | |||
| UNTY / Unity Bancorp, Inc. | 0.03 | 40.17 | 1.57 | 62.18 | 0.4847 | 0.1166 | |||
| UBS / UBS Group AG | Call | 0.00 | 0.00 | 1.55 | 62.97 | 0.4783 | 0.1167 | ||
| META / Meta Platforms, Inc. | 0.00 | 0.00 | 1.54 | 28.13 | 0.4752 | 0.0183 | |||
| GNW / Genworth Financial, Inc. | 0.18 | 181.04 | 1.44 | 208.60 | 0.4445 | 0.2670 | |||
| AMP / Ameriprise Financial, Inc. | 0.00 | 0.00 | 1.39 | 10.25 | 0.4296 | -0.0502 | |||
| SF / Stifel Financial Corp. | 0.01 | 0.00 | 1.25 | 10.08 | 0.3855 | -0.0456 | |||
| INBK / First Internet Bancorp | 0.05 | -1.18 | 1.24 | -0.72 | 0.3840 | -0.0923 | |||
| FBIZ / First Business Financial Services, Inc. | 0.02 | 0.00 | 1.20 | 7.44 | 0.3709 | -0.0542 | |||
| IVZ / Invesco Ltd. | 0.07 | 1.18 | 0.3661 | 0.3661 | |||||
| BFST / Business First Bancshares, Inc. | 0.04 | 0.00 | 1.06 | 1.25 | 0.3266 | -0.0707 | |||
| PKW / Invesco Exchange-Traded Fund Trust - Invesco BuyBack Achievers ETF | 0.01 | 0.00 | 1.01 | 9.80 | 0.3120 | -0.0382 | |||
| SOHO / Sotherly Hotels Inc. | 1.00 | -14.29 | 0.95 | 10.06 | 0.2949 | -0.0349 | |||
| MDY / SPDR S&P MidCap 400 ETF Trust | 0.00 | 21.28 | 0.92 | 28.71 | 0.2848 | 0.0125 | |||
| V / Visa Inc. | 0.00 | 0.00 | 0.85 | 1.31 | 0.2628 | -0.0566 | |||
| SYF / Synchrony Financial | 0.01 | 0.00 | 0.84 | 25.94 | 0.2603 | 0.0061 | |||
| ROBINHOOD MKTS INC / PUT (770700952) | Put | 0.00 | 0.67 | 0.0000 | |||||
| OBT / Orange County Bancorp, Inc. | 0.02 | 0.52 | 0.1600 | 0.1600 | |||||
| PBFS / Pioneer Bancorp, Inc. | 0.04 | 0.00 | 0.49 | 2.72 | 0.1523 | -0.0302 | |||
| DELL / Dell Technologies Inc. | 0.00 | 0.00 | 0.49 | 34.62 | 0.1518 | 0.0128 | |||
| VTRS / Viatris Inc. | 0.05 | -3.57 | 0.48 | -1.23 | 0.1495 | -0.0367 | |||
| IWN / iShares Trust - iShares Russell 2000 Value ETF | 0.00 | 0.00 | 0.46 | 4.32 | 0.1424 | -0.0254 | |||
| NAVI / Navient Corporation | 0.03 | 0.00 | 0.45 | 11.58 | 0.1405 | -0.0145 | |||
| GIPR / Generation Income Properties, Inc. | 0.23 | 11.97 | 0.33 | 2.15 | 0.1033 | -0.0212 | |||
| HPE / Hewlett Packard Enterprise Company | 0.01 | -54.55 | 0.31 | -39.88 | 0.0950 | -0.0991 | |||
| WT / WisdomTree, Inc. | 0.02 | 0.28 | 0.0858 | 0.0858 | |||||
| GPI / Group 1 Automotive, Inc. | 0.00 | 0.00 | 0.27 | 13.98 | 0.0835 | -0.0064 | |||
| JPM / JPMorgan Chase & Co. | 0.00 | 0.00 | 0.26 | 18.55 | 0.0812 | -0.0034 | |||
| CZR / Caesars Entertainment, Inc. | 0.01 | 0.00 | 0.26 | 13.33 | 0.0791 | -0.0067 | |||
| GHY / PGIM Global High Yield Fund, Inc | 0.02 | 0.25 | 0.0789 | 0.0789 | |||||
| VTI / Vanguard Index Funds - Vanguard Total Stock Market ETF | 0.00 | 0.00 | 0.24 | 10.70 | 0.0739 | -0.0084 | |||
| MSFT / Microsoft Corporation | 0.00 | 0.22 | 0.0685 | 0.0685 | |||||
| PRI / Primerica, Inc. | 0.00 | 0.00 | 0.22 | -3.57 | 0.0669 | -0.0188 | |||
| AAPL / Apple Inc. | 0.00 | 0.00 | 0.22 | -7.73 | 0.0668 | -0.0223 | |||
| KIO / KKR Income Opportunities Fund | 0.01 | 0.00 | 0.17 | 2.37 | 0.0537 | -0.0110 | |||
| AMBC / Ambac Financial Group, Inc. | 0.02 | 0.00 | 0.15 | -18.72 | 0.0471 | -0.0244 | |||
| SXC / SunCoke Energy, Inc. | 0.00 | -100.00 | 0.00 | 0.0000 |