Basic Stats
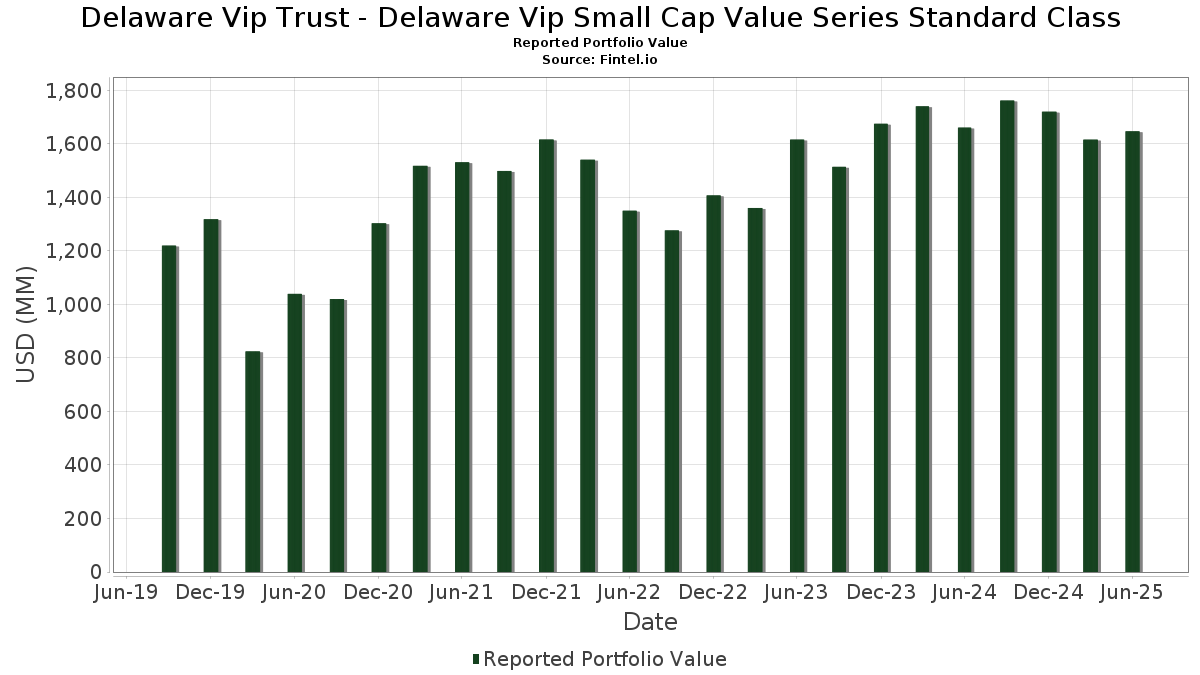
| Portfolio Value | $ 1,647,041,354 |
| Current Positions | 111 |
Latest Holdings, Performance, AUM (from 13F, 13D)
Delaware Vip Trust - Delaware Vip Small Cap Value Series Standard Class has disclosed 111 total holdings in their latest SEC filings. Most recent portfolio value is calculated to be $ 1,647,041,354 USD. Actual Assets Under Management (AUM) is this value plus cash (which is not disclosed). Delaware Vip Trust - Delaware Vip Small Cap Value Series Standard Class’s top holdings are AXIS Capital Holdings Limited (US:AXS) , Hancock Whitney Corporation (US:HWC) , Webster Financial Corporation (US:WBS) , F.N.B. Corporation (US:FNB) , and Synovus Financial Corp. (US:SNV) . Delaware Vip Trust - Delaware Vip Small Cap Value Series Standard Class’s new positions include Gates Industrial Corporation plc (US:GTES) , Silgan Holdings Inc. (US:SLGN) , Huron Consulting Group Inc. (US:HURN) , New Jersey Resources Corporation (US:NJR) , and N-able, Inc. (US:NABL) .
Top Increases This Quarter
We use the change in the portfolio allocation because this is the most meaningful metric. Changes can be due to trades or changes in share prices.
| Security | Shares (MM) |
Value (MM$) |
Portfolio % | ΔPortfolio % |
|---|---|---|---|---|
| 0.60 | 13.84 | 0.8396 | 0.8396 | |
| 0.22 | 12.18 | 0.7389 | 0.7389 | |
| 0.08 | 11.15 | 0.6761 | 0.6761 | |
| 0.25 | 11.12 | 0.6747 | 0.6747 | |
| 0.69 | 28.11 | 1.7047 | 0.6739 | |
| 0.44 | 12.61 | 0.7647 | 0.3951 | |
| 0.22 | 13.73 | 0.8330 | 0.3449 | |
| 0.62 | 21.10 | 1.2797 | 0.3101 | |
| 0.16 | 27.94 | 1.6947 | 0.3100 | |
| 0.05 | 24.41 | 1.4804 | 0.3097 |
Top Decreases This Quarter
We use the change in the portfolio allocation because this is the most meaningful metric. Changes can be due to trades or changes in share prices.
| Security | Shares (MM) |
Value (MM$) |
Portfolio % | ΔPortfolio % |
|---|---|---|---|---|
| 0.01 | 0.95 | 0.0574 | -0.7273 | |
| 0.11 | 12.16 | 0.7377 | -0.3349 | |
| 1.14 | 20.12 | 1.2204 | -0.3246 | |
| 0.22 | 6.39 | 0.3878 | -0.3048 | |
| 0.29 | 21.04 | 1.2760 | -0.2911 | |
| 0.30 | 13.73 | 0.8329 | -0.2289 | |
| 0.32 | 33.44 | 2.0280 | -0.1902 | |
| 0.06 | 6.09 | 0.3695 | -0.1719 | |
| 0.45 | 4.74 | 0.2874 | -0.1566 | |
| 11.97 | 11.97 | 0.7261 | -0.1541 |
13F and Fund Filings
This form was filed on 2025-08-26 for the reporting period 2025-06-30. Click the link icon to see the full transaction history.
Upgrade to unlock premium data and export to Excel ![]() .
.
| Security | Type | Avg Share Price | Shares (MM) |
ΔShares (%) |
ΔShares (%) |
Value ($MM) |
Portfolio (%) |
ΔPortfolio (%) |
|
|---|---|---|---|---|---|---|---|---|---|
| AXS / AXIS Capital Holdings Limited | 0.32 | -10.02 | 33.44 | -6.80 | 2.0280 | -0.1902 | |||
| HWC / Hancock Whitney Corporation | 0.56 | -1.12 | 32.22 | 8.21 | 1.9543 | 0.1133 | |||
| WBS / Webster Financial Corporation | 0.55 | -2.26 | 30.12 | 3.53 | 1.8268 | 0.0280 | |||
| FNB / F.N.B. Corporation | 1.95 | -1.11 | 28.41 | 7.19 | 1.7229 | 0.0844 | |||
| SNV / Synovus Financial Corp. | 0.54 | -1.70 | 28.20 | 8.83 | 1.7103 | 0.1083 | |||
| TTMI / TTM Technologies, Inc. | 0.69 | -15.30 | 28.11 | 68.59 | 1.7047 | 0.6739 | |||
| MTZ / MasTec, Inc. | 0.16 | -14.57 | 27.94 | 24.76 | 1.6947 | 0.3100 | |||
| ITT / ITT Inc. | 0.18 | 0.00 | 27.69 | 21.42 | 1.6797 | 0.2695 | |||
| ONB / Old National Bancorp | 1.23 | -1.12 | 26.19 | -0.42 | 1.5887 | -0.0376 | |||
| EWBC / East West Bancorp, Inc. | 0.26 | -8.74 | 25.85 | 2.67 | 1.5680 | 0.0111 | |||
| SF / Stifel Financial Corp. | 0.25 | -1.12 | 25.58 | 8.86 | 1.5513 | 0.0987 | |||
| VLY / Valley National Bancorp | 2.76 | -1.11 | 24.60 | -0.67 | 1.4922 | -0.0392 | |||
| CACI / CACI International Inc | 0.05 | -0.78 | 24.41 | 28.91 | 1.4804 | 0.3097 | |||
| COLB / Columbia Banking System, Inc. | 1.04 | -1.12 | 24.36 | -7.30 | 1.4775 | -0.1473 | |||
| OGE / OGE Energy Corp. | 0.53 | 0.00 | 23.46 | -3.44 | 1.4229 | -0.0792 | |||
| GPI / Group 1 Automotive, Inc. | 0.05 | 1.18 | 22.43 | 15.69 | 1.3602 | 0.1616 | |||
| THG / The Hanover Insurance Group, Inc. | 0.13 | 1.16 | 22.24 | -1.21 | 1.3492 | -0.0431 | |||
| ESNT / Essent Group Ltd. | 0.36 | 0.23 | 21.57 | 5.45 | 1.3080 | 0.0436 | |||
| ALGM / Allegro MicroSystems, Inc. | 0.62 | -1.11 | 21.10 | 34.54 | 1.2797 | 0.3101 | |||
| ADC / Agree Realty Corporation | 0.29 | -12.30 | 21.04 | -17.00 | 1.2760 | -0.2911 | |||
| SWX / Southwest Gas Holdings, Inc. | 0.28 | 2.04 | 20.68 | 5.72 | 1.2541 | 0.0448 | |||
| GPOR / Gulfport Energy Corporation | 0.10 | -7.77 | 20.59 | 0.76 | 1.2486 | -0.0146 | |||
| IRT / Independence Realty Trust, Inc. | 1.14 | -3.36 | 20.12 | -19.48 | 1.2204 | -0.3246 | |||
| NHI / National Health Investors, Inc. | 0.28 | 1.24 | 19.98 | -3.88 | 1.2121 | -0.0734 | |||
| KRG / Kite Realty Group Trust | 0.83 | 0.25 | 18.87 | 1.51 | 1.1443 | -0.0049 | |||
| LXP / LXP Industrial Trust | 2.25 | 1.85 | 18.59 | -2.74 | 1.1277 | -0.0543 | |||
| BDC / Belden Inc. | 0.16 | 3.75 | 18.28 | 19.84 | 1.1088 | 0.1656 | |||
| LPX / Louisiana-Pacific Corporation | 0.21 | -0.45 | 18.11 | -6.93 | 1.0985 | -0.1047 | |||
| ITGR / Integer Holdings Corporation | 0.15 | 1.66 | 18.06 | 5.94 | 1.0953 | 0.0413 | |||
| TEX / Terex Corporation | 0.38 | 1.41 | 17.81 | 25.32 | 1.0801 | 0.2015 | |||
| SNX / TD SYNNEX Corporation | 0.13 | 1.90 | 17.80 | 33.02 | 1.0794 | 0.2522 | |||
| CMA / Comerica Incorporated | 0.29 | 0.86 | 17.58 | 1.86 | 1.0662 | -0.0008 | |||
| NTB / The Bank of N.T. Butterfield & Son Limited | 0.40 | -0.13 | 17.50 | 13.63 | 1.0611 | 0.1092 | |||
| AIZ / Assurant, Inc. | 0.09 | -0.63 | 17.21 | -6.44 | 1.0439 | -0.0934 | |||
| GFF / Griffon Corporation | 0.24 | 3.07 | 17.14 | 4.32 | 1.0399 | 0.0237 | |||
| PFGC / Performance Food Group Company | 0.19 | -7.99 | 16.87 | 2.35 | 1.0234 | 0.0042 | |||
| TKR / The Timken Company | 0.23 | 1.00 | 16.51 | 1.96 | 1.0015 | 0.0001 | |||
| MTH / Meritage Homes Corporation | 0.25 | -1.12 | 16.50 | -6.58 | 1.0009 | -0.0913 | |||
| KEX / Kirby Corporation | 0.14 | 6.62 | 16.17 | 19.70 | 0.9806 | 0.1455 | |||
| MDU / MDU Resources Group, Inc. | 0.96 | 0.79 | 15.98 | -0.64 | 0.9694 | -0.0252 | |||
| APLE / Apple Hospitality REIT, Inc. | 1.33 | 1.85 | 15.53 | -7.93 | 0.9420 | -0.1010 | |||
| CADE / Cadence Bank | 0.49 | -1.11 | 15.52 | 4.17 | 0.9412 | 0.0201 | |||
| KNTK / Kinetik Holdings Inc. | 0.35 | 20.28 | 15.51 | 2.01 | 0.9407 | 0.0007 | |||
| KGS / Kodiak Gas Services, Inc. | 0.44 | 0.77 | 15.17 | -7.41 | 0.9202 | -0.0929 | |||
| HOPE / Hope Bancorp, Inc. | 1.40 | -1.12 | 14.98 | 1.34 | 0.9083 | -0.0054 | |||
| FLEX / Flex Ltd. | 0.30 | -11.93 | 14.83 | 32.90 | 0.8995 | 0.2095 | |||
| BYD / Boyd Gaming Corporation | 0.19 | 4.10 | 14.61 | 23.70 | 0.8863 | 0.1559 | |||
| FFBC / First Financial Bancorp. | 0.60 | 1.76 | 14.60 | -1.17 | 0.8857 | -0.0279 | |||
| MTDR / Matador Resources Company | 0.30 | 1.22 | 14.50 | -5.46 | 0.8797 | -0.0689 | |||
| WERN / Werner Enterprises, Inc. | 0.53 | -1.11 | 14.49 | -7.66 | 0.8790 | -0.0914 | |||
| BKH / Black Hills Corporation | 0.26 | 0.72 | 14.48 | -6.83 | 0.8781 | -0.0827 | |||
| RRX / Regal Rexnord Corporation | 0.10 | 1.11 | 14.47 | 28.75 | 0.8774 | 0.1827 | |||
| KBR / KBR, Inc. | 0.29 | -8.45 | 13.94 | -11.89 | 0.8456 | -0.1327 | |||
| GTES / Gates Industrial Corporation plc | 0.60 | 13.84 | 0.8396 | 0.8396 | |||||
| ECG / Everus Construction Group, Inc. | 0.22 | 1.57 | 13.73 | 73.99 | 0.8330 | 0.3449 | |||
| DRS / Leonardo DRS, Inc. | 0.30 | -43.43 | 13.73 | -20.04 | 0.8329 | -0.2289 | |||
| ZWS / Zurn Elkay Water Solutions Corporation | 0.37 | 1.69 | 13.67 | 12.76 | 0.8293 | 0.0796 | |||
| MGY / Magnolia Oil & Gas Corporation | 0.60 | 1.16 | 13.60 | -9.97 | 0.8247 | -0.1091 | |||
| KBH / KB Home | 0.26 | 0.83 | 13.51 | -8.11 | 0.8194 | -0.0896 | |||
| WCC / WESCO International, Inc. | 0.07 | -12.54 | 13.31 | 4.30 | 0.8071 | 0.0183 | |||
| NXT / Nextracker Inc. | 0.24 | -1.64 | 13.18 | 26.90 | 0.7991 | 0.1572 | |||
| AVNT / Avient Corporation | 0.40 | 2.38 | 12.84 | -10.98 | 0.7786 | -0.1130 | |||
| PBH / Prestige Consumer Healthcare Inc. | 0.16 | 1.08 | 12.71 | -6.11 | 0.7708 | -0.0661 | |||
| BFH / Bread Financial Holdings, Inc. | 0.22 | -1.11 | 12.67 | 12.79 | 0.7686 | 0.0739 | |||
| ACIW / ACI Worldwide, Inc. | 0.28 | 18.72 | 12.67 | -0.38 | 0.7683 | -0.0179 | |||
| RNG / RingCentral, Inc. | 0.44 | 84.22 | 12.61 | 110.93 | 0.7647 | 0.3951 | |||
| DIOD / Diodes Incorporated | 0.24 | 9.79 | 12.49 | 34.51 | 0.7576 | 0.1834 | |||
| SIGI / Selective Insurance Group, Inc. | 0.14 | 1.31 | 12.38 | -4.10 | 0.7507 | -0.0473 | |||
| GOLF / Acushnet Holdings Corp. | 0.17 | -8.13 | 12.26 | -2.57 | 0.7433 | -0.0344 | |||
| SLGN / Silgan Holdings Inc. | 0.22 | 12.18 | 0.7389 | 0.7389 | |||||
| JJSF / J&J Snack Foods Corp. | 0.11 | -18.56 | 12.16 | -29.88 | 0.7377 | -0.3349 | |||
| FUL / H.B. Fuller Company | 0.20 | 1.13 | 12.11 | 8.40 | 0.7342 | 0.0437 | |||
| HRI / Herc Holdings Inc. | 0.09 | 23.29 | 12.10 | 20.91 | 0.7336 | 0.1152 | |||
| GSAXX / Goldman Sachs Trust - Goldman Sachs Financial Square Government Fund | 11.97 | -15.91 | 11.97 | -15.91 | 0.7261 | -0.1541 | |||
| TFDXX / Blackrock Liquidity Funds - BlackRock Liquidity Funds FedFund Portfolio Institutional Class | 11.97 | -15.91 | 11.97 | -15.91 | 0.7261 | -0.1541 | |||
| US61747C7074 / Morgan Stanley Institutional Liquidity Funds Government Portfolio, Institutional Class | 11.97 | -15.91 | 11.97 | -15.91 | 0.7261 | -0.1541 | |||
| FIGXX / Fidelity Colchester Street Trust - Fidelity Institutional Money Market Funds Government Portfolio Class I | 11.97 | -15.91 | 11.97 | -15.91 | 0.7261 | -0.1541 | |||
| PATK / Patrick Industries, Inc. | 0.13 | 7.73 | 11.96 | 17.55 | 0.7256 | 0.0964 | |||
| UNF / UniFirst Corporation | 0.06 | 32.72 | 11.95 | 43.57 | 0.7247 | 0.2101 | |||
| CSR / Centerspace | 0.19 | 11.96 | 11.55 | 4.07 | 0.7006 | 0.0144 | |||
| HURN / Huron Consulting Group Inc. | 0.08 | 11.15 | 0.6761 | 0.6761 | |||||
| NJR / New Jersey Resources Corporation | 0.25 | 11.12 | 0.6747 | 0.6747 | |||||
| MHO / M/I Homes, Inc. | 0.10 | 10.60 | 11.11 | 8.61 | 0.6739 | 0.0414 | |||
| TXRH / Texas Roadhouse, Inc. | 0.06 | -1.11 | 10.83 | 11.22 | 0.6570 | 0.0548 | |||
| ICUI / ICU Medical, Inc. | 0.08 | 12.04 | 10.57 | 6.64 | 0.6412 | 0.0282 | |||
| INSW / International Seaways, Inc. | 0.29 | 1.61 | 10.49 | 11.64 | 0.6362 | 0.0553 | |||
| MMSI / Merit Medical Systems, Inc. | 0.11 | 1.99 | 10.29 | -9.81 | 0.6240 | -0.0813 | |||
| KNF / Knife River Corporation | 0.12 | 0.00 | 10.13 | -9.50 | 0.6145 | -0.0777 | |||
| SHOO / Steven Madden, Ltd. | 0.42 | 51.37 | 10.03 | 36.26 | 0.6086 | 0.1533 | |||
| CTRI / Centuri Holdings, Inc. | 0.44 | 27.37 | 9.91 | 74.38 | 0.6011 | 0.2497 | |||
| STC / Stewart Information Services Corporation | 0.14 | 4.37 | 9.26 | -4.78 | 0.5617 | -0.0396 | |||
| CHH / Choice Hotels International, Inc. | 0.07 | -1.14 | 8.82 | -5.53 | 0.5348 | -0.0423 | |||
| AMAL / Amalgamated Financial Corp. | 0.28 | 6.64 | 8.62 | 15.73 | 0.5226 | 0.0623 | |||
| MBIN / Merchants Bancorp | 0.25 | -1.12 | 8.36 | -11.62 | 0.5069 | -0.0778 | |||
| PX / P10, Inc. | 0.81 | -1.12 | 8.29 | -13.99 | 0.5030 | -0.0932 | |||
| CSTM / Constellium SE | 0.62 | 0.16 | 8.27 | 32.03 | 0.5013 | 0.1142 | |||
| ASH / Ashland Inc. | 0.16 | 4.02 | 7.87 | -11.79 | 0.4771 | -0.0742 | |||
| PLYM / Plymouth Industrial REIT, Inc. | 0.49 | 13.44 | 7.82 | 11.78 | 0.4743 | 0.0417 | |||
| ATKR / Atkore Inc. | 0.11 | -1.14 | 7.68 | 16.28 | 0.4658 | 0.0574 | |||
| COLM / Columbia Sportswear Company | 0.11 | -1.10 | 6.58 | -20.19 | 0.3994 | -0.1107 | |||
| WAFD / WaFd, Inc | 0.22 | -44.29 | 6.39 | -42.92 | 0.3878 | -0.3048 | |||
| NE / Noble Corporation plc | 0.24 | -1.12 | 6.35 | 10.76 | 0.3852 | 0.0307 | |||
| RYI / Ryerson Holding Corporation | 0.29 | 2.14 | 6.28 | -4.05 | 0.3807 | -0.0237 | |||
| CROX / Crocs, Inc. | 0.06 | -27.05 | 6.09 | -30.44 | 0.3695 | -0.1719 | |||
| LBRT / Liberty Energy Inc. | 0.44 | -1.11 | 5.04 | -28.28 | 0.3058 | -0.1289 | |||
| HUN / Huntsman Corporation | 0.45 | 0.00 | 4.74 | -34.01 | 0.2874 | -0.1566 | |||
| SAIA / Saia, Inc. | 0.01 | 56.59 | 3.90 | 22.81 | 0.2368 | 0.0402 | |||
| CHCT / Community Healthcare Trust Incorporated | 0.19 | -33.67 | 3.18 | -39.26 | 0.1929 | -0.1308 | |||
| NABL / N-able, Inc. | 0.29 | 2.32 | 0.1409 | 0.1409 | |||||
| NMRK / Newmark Group, Inc. | 0.13 | 1.60 | 0.0969 | 0.0969 | |||||
| CRUS / Cirrus Logic, Inc. | 0.01 | -92.87 | 0.95 | -92.55 | 0.0574 | -0.7273 |