Basic Stats
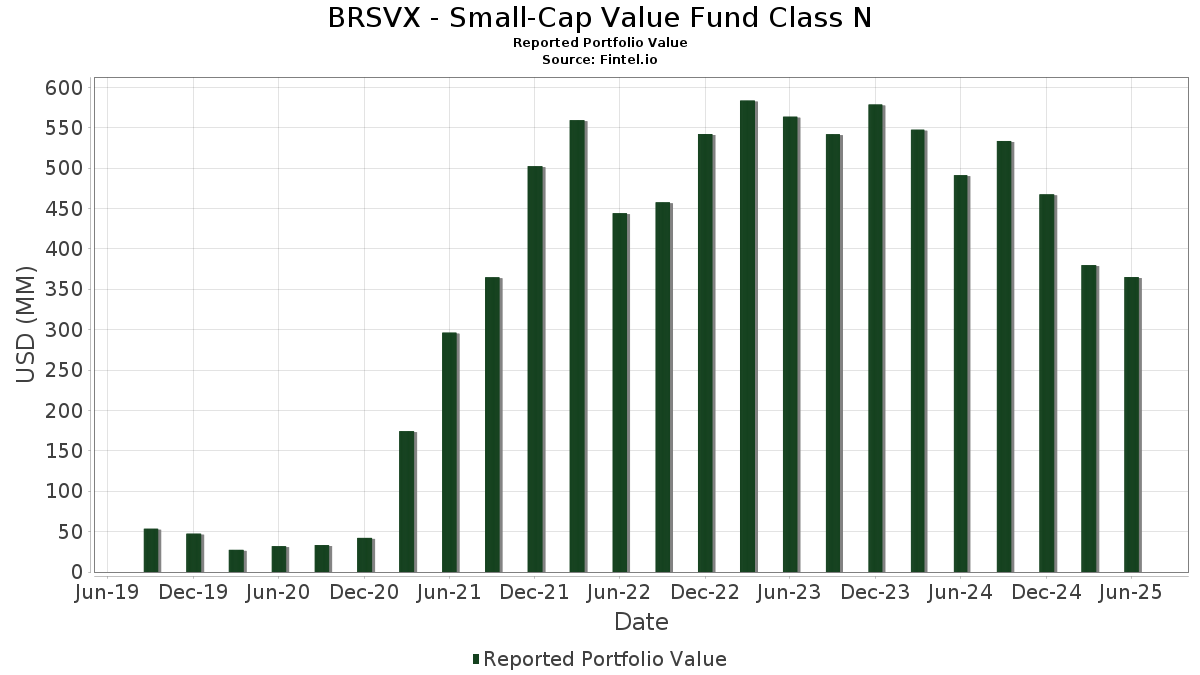
| Portfolio Value | $ 365,029,667 |
| Current Positions | 142 |
Latest Holdings, Performance, AUM (from 13F, 13D)
BRSVX - Small-Cap Value Fund Class N has disclosed 142 total holdings in their latest SEC filings. Most recent portfolio value is calculated to be $ 365,029,667 USD. Actual Assets Under Management (AUM) is this value plus cash (which is not disclosed). BRSVX - Small-Cap Value Fund Class N’s top holdings are Axos Financial, Inc. (US:AX) , SkyWest, Inc. (US:SKYW) , Enova International, Inc. (US:ENVA) , WSFS Financial Corporation (US:WSFS) , and Hancock Whitney Corporation (US:HWC) . BRSVX - Small-Cap Value Fund Class N’s new positions include Rush Enterprises, Inc. (US:RUSHA) , Enterprise Financial Services Corp (US:EFSC) , Graham Holdings Company (US:GHC) , Cadence Bank (US:CADE) , and American Public Education, Inc. (US:APEI) .
Top Increases This Quarter
We use the change in the portfolio allocation because this is the most meaningful metric. Changes can be due to trades or changes in share prices.
| Security | Shares (MM) |
Value (MM$) |
Portfolio % | ΔPortfolio % |
|---|---|---|---|---|
| 4.66 | 4.66 | 1.3213 | 1.3213 | |
| 4.66 | 4.66 | 1.3213 | 1.3213 | |
| 0.07 | 3.71 | 1.0514 | 1.0514 | |
| 0.07 | 3.69 | 1.0466 | 1.0466 | |
| 0.00 | 3.60 | 1.0193 | 1.0193 | |
| 0.05 | 3.55 | 1.0077 | 1.0077 | |
| 0.10 | 3.20 | 0.9069 | 0.9069 | |
| 0.10 | 3.09 | 0.8765 | 0.8765 | |
| 0.10 | 3.77 | 1.0679 | 0.8397 | |
| 0.16 | 2.92 | 0.8287 | 0.8287 |
Top Decreases This Quarter
We use the change in the portfolio allocation because this is the most meaningful metric. Changes can be due to trades or changes in share prices.
| Security | Shares (MM) |
Value (MM$) |
Portfolio % | ΔPortfolio % |
|---|---|---|---|---|
| 0.04 | 2.92 | 0.8269 | -0.6156 | |
| 0.02 | 1.62 | 0.4601 | -0.5357 | |
| 0.00 | 0.00 | -0.4917 | ||
| 0.17 | 0.66 | 0.1882 | -0.4819 | |
| 0.02 | 1.61 | 0.4571 | -0.4596 | |
| 0.03 | 1.94 | 0.5494 | -0.4130 | |
| 0.04 | 1.58 | 0.4484 | -0.4086 | |
| 0.03 | 3.76 | 1.0670 | -0.4080 | |
| 0.12 | 1.08 | 0.3060 | -0.3812 | |
| 0.22 | 2.51 | 0.7111 | -0.3761 |
13F and Fund Filings
This form was filed on 2025-08-26 for the reporting period 2025-06-30. Click the link icon to see the full transaction history.
Upgrade to unlock premium data and export to Excel ![]() .
.
| Security | Type | Avg Share Price | Shares (MM) |
ΔShares (%) |
ΔShares (%) |
Value ($MM) |
Portfolio (%) |
ΔPortfolio (%) |
|
|---|---|---|---|---|---|---|---|---|---|
| AX / Axos Financial, Inc. | 0.07 | -16.29 | 5.08 | -1.34 | 1.4400 | 0.0872 | |||
| SKYW / SkyWest, Inc. | 0.05 | 0.00 | 5.08 | 17.85 | 1.4391 | 0.3074 | |||
| ENVA / Enova International, Inc. | 0.04 | 0.00 | 4.76 | 15.47 | 1.3500 | 0.2667 | |||
| WSFS / WSFS Financial Corporation | 0.09 | 0.00 | 4.73 | 6.05 | 1.3418 | 0.1690 | |||
| DREY INST PREF GOV MM-M / STIV (000000000) | 4.66 | 4.66 | 1.3213 | 1.3213 | |||||
| DREY INST PREF GOV MM-M / STIV (000000000) | 4.66 | 4.66 | 1.3213 | 1.3213 | |||||
| HWC / Hancock Whitney Corporation | 0.08 | 14.53 | 4.52 | 25.36 | 1.2823 | 0.3342 | |||
| EPRT / Essential Properties Realty Trust, Inc. | 0.14 | -19.55 | 4.46 | -21.35 | 1.2656 | -0.2257 | |||
| CHCO / City Holding Company | 0.04 | 0.00 | 4.43 | 4.21 | 1.2563 | 0.1391 | |||
| PBH / Prestige Consumer Healthcare Inc. | 0.05 | -11.36 | 4.36 | -17.68 | 1.2360 | -0.1554 | |||
| NTCT / NetScout Systems, Inc. | 0.17 | -14.83 | 4.27 | 0.56 | 1.2119 | 0.0952 | |||
| TGNA / TEGNA Inc. | 0.25 | 0.00 | 4.21 | -8.03 | 1.1926 | -0.0090 | |||
| KFY / Korn Ferry | 0.06 | 0.00 | 4.17 | 8.11 | 1.1827 | 0.1688 | |||
| CALM / Cal-Maine Foods, Inc. | 0.04 | -19.07 | 4.14 | -11.30 | 1.1750 | -0.0526 | |||
| CASH / Pathward Financial, Inc. | 0.05 | -13.27 | 4.14 | -5.93 | 1.1731 | 0.0173 | |||
| BY / Byline Bancorp, Inc. | 0.15 | -8.12 | 4.08 | -6.12 | 1.1571 | 0.0148 | |||
| FCPT / Four Corners Property Trust, Inc. | 0.15 | -18.03 | 4.04 | -23.15 | 1.1443 | -0.2356 | |||
| FULT / Fulton Financial Corporation | 0.22 | 0.00 | 4.00 | -0.27 | 1.1338 | 0.0801 | |||
| HSII / Heidrick & Struggles International, Inc. | 0.09 | 0.00 | 3.98 | 6.84 | 1.1288 | 0.1496 | |||
| CENTA / Central Garden & Pet Company | 0.12 | -7.45 | 3.89 | -11.51 | 1.1026 | -0.0523 | |||
| ETD / Ethan Allen Interiors Inc. | 0.14 | -11.64 | 3.82 | -11.16 | 1.0834 | -0.0468 | |||
| ACT / Enact Holdings, Inc. | 0.10 | 305.60 | 3.77 | 333.99 | 1.0679 | 0.8397 | |||
| MATX / Matson, Inc. | 0.03 | -22.83 | 3.76 | -32.96 | 1.0670 | -0.4080 | |||
| SXC / SunCoke Energy, Inc. | 0.44 | -10.29 | 3.74 | -16.25 | 1.0613 | -0.1130 | |||
| BCC / Boise Cascade Company | 0.04 | 0.00 | 3.72 | -11.50 | 1.0559 | -0.0497 | |||
| RUSHA / Rush Enterprises, Inc. | 0.07 | 3.71 | 1.0514 | 1.0514 | |||||
| EFSC / Enterprise Financial Services Corp | 0.07 | 3.69 | 1.0466 | 1.0466 | |||||
| SBH / Sally Beauty Holdings, Inc. | 0.40 | 0.00 | 3.66 | 2.55 | 1.0369 | 0.0998 | |||
| GTY / Getty Realty Corp. | 0.13 | -12.01 | 3.65 | -22.00 | 1.0335 | -0.1945 | |||
| NTGR / NETGEAR, Inc. | 0.13 | -13.76 | 3.65 | 2.50 | 1.0334 | 0.0990 | |||
| SPTN / SpartanNash Company | 0.14 | -27.70 | 3.63 | -5.47 | 1.0288 | 0.0201 | |||
| DGII / Digi International Inc. | 0.10 | -10.42 | 3.60 | 12.20 | 1.0199 | 0.1775 | |||
| GHC / Graham Holdings Company | 0.00 | 3.60 | 1.0193 | 1.0193 | |||||
| TILE / Interface, Inc. | 0.17 | 0.00 | 3.58 | 5.51 | 1.0156 | 0.1234 | |||
| CCB / Coastal Financial Corporation | 0.04 | -16.06 | 3.58 | -10.08 | 1.0142 | -0.0309 | |||
| PRIM / Primoris Services Corporation | 0.05 | 3.55 | 1.0077 | 1.0077 | |||||
| PRG / PROG Holdings, Inc. | 0.12 | 0.00 | 3.54 | 10.37 | 1.0022 | 0.1604 | |||
| SCSC / ScanSource, Inc. | 0.08 | -23.02 | 3.50 | -5.36 | 0.9909 | 0.0205 | |||
| GIII / G-III Apparel Group, Ltd. | 0.16 | -8.77 | 3.49 | -25.28 | 0.9906 | -0.2381 | |||
| TK / Teekay Corporation Ltd. | 0.42 | -10.56 | 3.49 | 12.32 | 0.9903 | 0.1731 | |||
| TK / Teekay Corporation Ltd. | 0.42 | -10.56 | 3.49 | 12.32 | 0.9903 | 0.1731 | |||
| BFH / Bread Financial Holdings, Inc. | 0.06 | 0.00 | 3.44 | 14.07 | 0.9748 | 0.1827 | |||
| IBEX / IBEX Limited | 0.12 | -11.31 | 3.42 | 5.98 | 0.9700 | 0.1218 | |||
| SUPN / Supernus Pharmaceuticals, Inc. | 0.11 | 80.00 | 3.40 | 73.23 | 0.9650 | 0.4488 | |||
| DAKT / Daktronics, Inc. | 0.22 | -10.74 | 3.37 | 10.80 | 0.9565 | 0.1565 | |||
| WSBF / Waterstone Financial, Inc. | 0.24 | 0.00 | 3.35 | 2.66 | 0.9510 | 0.0926 | |||
| PRDO / Perdoceo Education Corporation | 0.10 | -13.01 | 3.28 | 12.95 | 0.9299 | 0.1668 | |||
| BANR / Banner Corporation | 0.05 | 0.00 | 3.27 | 0.58 | 0.9275 | 0.0730 | |||
| ASO / Academy Sports and Outdoors, Inc. | 0.07 | 26.27 | 3.23 | 24.04 | 0.9159 | 0.2317 | |||
| CADE / Cadence Bank | 0.10 | 3.20 | 0.9069 | 0.9069 | |||||
| SIG / Signet Jewelers Limited | 0.04 | 0.00 | 3.18 | 37.04 | 0.9021 | 0.2919 | |||
| SRCE / 1st Source Corporation | 0.05 | 0.00 | 3.17 | 3.77 | 0.8974 | 0.0960 | |||
| BMBL / Bumble Inc. | 0.48 | 0.00 | 3.16 | 51.85 | 0.8967 | 0.3494 | |||
| UNFI / United Natural Foods, Inc. | 0.13 | 0.00 | 3.10 | -14.90 | 0.8779 | -0.0781 | |||
| APEI / American Public Education, Inc. | 0.10 | 3.09 | 0.8765 | 0.8765 | |||||
| GMS / GMS Inc. | 0.03 | -52.16 | 2.99 | -28.90 | 0.8483 | -0.2574 | |||
| FBP / First BanCorp. | 0.14 | 0.00 | 2.99 | 8.68 | 0.8480 | 0.1247 | |||
| QCRH / QCR Holdings, Inc. | 0.04 | 0.00 | 2.95 | -4.80 | 0.8373 | 0.0222 | |||
| LOVE / The Lovesac Company | 0.16 | 2.92 | 0.8287 | 0.8287 | |||||
| DLX / Deluxe Corporation | 0.18 | 2.92 | 0.8276 | 0.8276 | |||||
| SYNA / Synaptics Incorporated | 0.04 | 637.70 | 2.92 | 395.92 | 0.8269 | -0.6156 | |||
| GBX / The Greenbrier Companies, Inc. | 0.06 | -23.87 | 2.86 | -31.55 | 0.8120 | -0.2875 | |||
| FFBC / First Financial Bancorp. | 0.12 | 0.00 | 2.86 | -2.89 | 0.8109 | 0.0371 | |||
| SLVM / Sylvamo Corporation | 0.06 | 0.00 | 2.86 | -25.30 | 0.8096 | -0.1949 | |||
| HAFC / Hanmi Financial Corporation | 0.12 | -34.25 | 2.84 | -28.39 | 0.8060 | -0.2371 | |||
| NTB / The Bank of N.T. Butterfield & Son Limited | 0.06 | 0.00 | 2.83 | 13.80 | 0.8021 | 0.1487 | |||
| OSBC / Old Second Bancorp, Inc. | 0.16 | 0.00 | 2.78 | 6.63 | 0.7891 | 0.1031 | |||
| FBK / FB Financial Corporation | 0.06 | -27.65 | 2.69 | -29.32 | 0.7628 | -0.2372 | |||
| OTTR / Otter Tail Corporation | 0.03 | 0.00 | 2.68 | -4.08 | 0.7605 | 0.0257 | |||
| STEL / Stellar Bancorp, Inc. | 0.09 | 0.00 | 2.62 | 1.16 | 0.7428 | 0.0623 | |||
| LZB / La-Z-Boy Incorporated | 0.07 | 27.43 | 2.59 | 21.20 | 0.7343 | 0.1727 | |||
| HSTM / HealthStream, Inc. | 0.09 | 4.26 | 2.56 | -10.34 | 0.7255 | -0.0245 | |||
| CBL / CBL & Associates Properties, Inc. | 0.10 | 17.63 | 2.54 | 12.34 | 0.7203 | 0.1262 | |||
| MGY / Magnolia Oil & Gas Corporation | 0.11 | 2.53 | 0.7169 | 0.7169 | |||||
| LBRT / Liberty Energy Inc. | 0.22 | -16.41 | 2.51 | -39.38 | 0.7111 | -0.3761 | |||
| SCS / Steelcase Inc. | 0.24 | 118.18 | 2.50 | 107.72 | 0.7096 | 0.3929 | |||
| CATY / Cathay General Bancorp | 0.05 | 0.00 | 2.46 | 5.81 | 0.6970 | 0.0865 | |||
| AMAL / Amalgamated Financial Corp. | 0.08 | 0.00 | 2.43 | 8.52 | 0.6899 | 0.1007 | |||
| VRNT / Verint Systems Inc. | 0.12 | 43.53 | 2.40 | 58.14 | 0.6803 | 0.2817 | |||
| SNCY / Sun Country Airlines Holdings, Inc. | 0.20 | 0.00 | 2.30 | -4.61 | 0.6515 | 0.0184 | |||
| DOLE / Dole plc | 0.16 | 0.00 | 2.26 | -3.21 | 0.6409 | 0.0274 | |||
| LTC / LTC Properties, Inc. | 0.07 | 0.00 | 2.25 | -2.39 | 0.6378 | 0.0323 | |||
| HOV / Hovnanian Enterprises, Inc. | 0.02 | 0.00 | 2.15 | -0.19 | 0.6106 | 0.0438 | |||
| PAHC / Phibro Animal Health Corporation | 0.08 | 0.00 | 2.11 | 19.56 | 0.5980 | 0.1345 | |||
| BANF / BancFirst Corporation | 0.02 | 0.00 | 2.10 | 12.53 | 0.5958 | 0.1050 | |||
| IMKTA / Ingles Markets, Incorporated | 0.03 | 0.00 | 2.10 | -2.69 | 0.5947 | 0.0283 | |||
| SANM / Sanmina Corporation | 0.02 | 2.05 | 0.5824 | 0.5824 | |||||
| INVA / Innoviva, Inc. | 0.10 | 66.65 | 2.01 | 84.73 | 0.5695 | 0.2837 | |||
| PCRX / Pacira BioSciences, Inc. | 0.08 | 49.09 | 1.96 | 43.41 | 0.5556 | 0.1965 | |||
| BV / BrightView Holdings, Inc. | 0.12 | 0.00 | 1.95 | 29.69 | 0.5523 | 0.1576 | |||
| BXC / BlueLinx Holdings Inc. | 0.03 | -46.67 | 1.94 | -47.09 | 0.5494 | -0.4130 | |||
| NMIH / NMI Holdings, Inc. | 0.04 | 0.00 | 1.90 | 17.02 | 0.5382 | 0.1120 | |||
| MCY / Mercury General Corporation | 0.03 | 0.00 | 1.89 | 20.45 | 0.5345 | 0.1233 | |||
| WRLD / World Acceptance Corporation | 0.01 | 1.88 | 0.5336 | 0.5336 | |||||
| OFG / OFG Bancorp | 0.04 | 0.00 | 1.85 | 6.99 | 0.5254 | 0.0701 | |||
| POR / Portland General Electric Company | 0.04 | 0.00 | 1.83 | -8.92 | 0.5183 | -0.0090 | |||
| GCO / Genesco Inc. | 0.09 | 34.47 | 1.81 | 24.71 | 0.5139 | 0.1320 | |||
| ABCB / Ameris Bancorp | 0.03 | 0.00 | 1.81 | 12.41 | 0.5136 | 0.0901 | |||
| ATLC / Atlanticus Holdings Corporation | 0.03 | 1.79 | 0.5073 | 0.5073 | |||||
| RYI / Ryerson Holding Corporation | 0.08 | -23.21 | 1.78 | -27.87 | 0.5057 | -0.1440 | |||
| BLX / Banco Latinoamericano de Comercio Exterior, S. A. | 0.04 | -6.77 | 1.78 | 2.65 | 0.5048 | 0.0490 | |||
| IIPR / Innovative Industrial Properties, Inc. | 0.03 | 0.00 | 1.78 | 2.13 | 0.5041 | 0.0465 | |||
| CCSI / Consensus Cloud Solutions, Inc. | 0.08 | 0.00 | 1.77 | -0.06 | 0.5016 | 0.0363 | |||
| AAT / American Assets Trust, Inc. | 0.09 | 0.00 | 1.72 | -1.94 | 0.4871 | 0.0268 | |||
| AXL / American Axle & Manufacturing Holdings, Inc. | 0.41 | 0.00 | 1.67 | 0.30 | 0.4720 | 0.0356 | |||
| IOSP / Innospec Inc. | 0.02 | -51.75 | 1.62 | -57.20 | 0.4601 | -0.5357 | |||
| VMEO / Vimeo, Inc. | 0.40 | -20.00 | 1.62 | -38.56 | 0.4581 | -0.2329 | |||
| ENS / EnerSys | 0.02 | -50.66 | 1.61 | -53.80 | 0.4571 | -0.4596 | |||
| OSUR / OraSure Technologies, Inc. | 0.53 | 0.00 | 1.60 | -10.95 | 0.4542 | -0.0187 | |||
| APOG / Apogee Enterprises, Inc. | 0.04 | -44.66 | 1.58 | -51.52 | 0.4484 | -0.4086 | |||
| DEI / Douglas Emmett, Inc. | 0.10 | 0.00 | 1.55 | -6.01 | 0.4392 | 0.0062 | |||
| UBSI / United Bankshares, Inc. | 0.04 | 0.00 | 1.54 | 5.07 | 0.4353 | 0.0514 | |||
| KMT / Kennametal Inc. | 0.07 | 1.49 | 0.4231 | 0.4231 | |||||
| TCBK / TriCo Bancshares | 0.04 | 0.00 | 1.49 | 1.36 | 0.4224 | 0.0360 | |||
| EIG / Employers Holdings, Inc. | 0.03 | 0.00 | 1.42 | -6.85 | 0.4013 | 0.0021 | |||
| ODP / The ODP Corporation | 0.08 | 0.00 | 1.41 | 26.52 | 0.4004 | 0.1071 | |||
| INN / Summit Hotel Properties, Inc. | 0.24 | 0.00 | 1.24 | -5.94 | 0.3506 | 0.0052 | |||
| AMPY / Amplify Energy Corp. | 0.38 | -41.71 | 1.20 | -50.12 | 0.3411 | -0.2928 | |||
| IBOC / International Bancshares Corporation | 0.02 | 0.00 | 1.13 | 5.50 | 0.3208 | 0.0391 | |||
| AMKR / Amkor Technology, Inc. | 0.05 | 0.00 | 1.10 | 16.14 | 0.3124 | 0.0633 | |||
| CMRE / Costamare Inc. | 0.12 | -55.42 | 1.08 | -58.74 | 0.3060 | -0.3812 | |||
| KOP / Koppers Holdings Inc. | 0.03 | 0.00 | 1.05 | 14.81 | 0.2989 | 0.0577 | |||
| HRTG / Heritage Insurance Holdings, Inc. | 0.04 | -32.43 | 1.04 | 16.87 | 0.2946 | 0.0610 | |||
| LAUR / Laureate Education, Inc. | 0.04 | 1.03 | 0.2930 | 0.2930 | |||||
| HLX / Helix Energy Solutions Group, Inc. | 0.16 | 1.00 | 0.2830 | 0.2830 | |||||
| AGM / Federal Agricultural Mortgage Corporation | 0.00 | -48.32 | 0.93 | -49.04 | 0.2644 | -0.1300 | |||
| UVE / Universal Insurance Holdings, Inc. | 0.03 | 0.92 | 0.2594 | 0.2594 | |||||
| AMCX / AMC Networks Inc. | 0.14 | -51.69 | 0.91 | -56.00 | 0.2570 | -0.2840 | |||
| HMN / Horace Mann Educators Corporation | 0.02 | 0.90 | 0.2558 | 0.2558 | |||||
| DNOW / DNOW Inc. | 0.06 | 0.89 | 0.2522 | 0.2522 | |||||
| REX / REX American Resources Corporation | 0.02 | 0.87 | 0.2475 | 0.2475 | |||||
| PFBC / Preferred Bank | 0.01 | 0.00 | 0.87 | 3.47 | 0.2453 | 0.0255 | |||
| BKH / Black Hills Corporation | 0.01 | 0.84 | 0.2386 | 0.2386 | |||||
| EBF / Ennis, Inc. | 0.04 | 0.00 | 0.82 | -9.73 | 0.2314 | -0.0061 | |||
| PEBO / Peoples Bancorp Inc. | 0.03 | 0.00 | 0.81 | 3.05 | 0.2303 | 0.0230 | |||
| AVA / Avista Corporation | 0.02 | 0.80 | 0.2259 | 0.2259 | |||||
| EGY / VAALCO Energy, Inc. | 0.20 | 0.00 | 0.73 | -4.05 | 0.2084 | 0.0072 | |||
| IHRT / iHeartMedia, Inc. | 0.41 | -8.33 | 0.72 | -2.17 | 0.2042 | 0.0107 | |||
| CLDT / Chatham Lodging Trust | 0.10 | 0.70 | 0.1976 | 0.1976 | |||||
| RYAM / Rayonier Advanced Materials Inc. | 0.17 | -61.13 | 0.66 | -74.00 | 0.1882 | -0.4819 | |||
| SIGA / SIGA Technologies, Inc. | 0.09 | 0.60 | 0.1693 | 0.1693 | |||||
| FIGXX / Fidelity Colchester Street Trust - Fidelity Institutional Money Market Funds Government Portfolio Class I | 0.00 | 120.00 | 0.00 | 0.0002 | 0.0001 | ||||
| BELFB / Bel Fuse Inc. | 0.00 | -100.00 | 0.00 | -100.00 | -0.4917 | ||||
| RBBN / Ribbon Communications Inc. | 0.00 | -100.00 | 0.00 | -100.00 | -0.1607 |