Basic Stats
| Insider Profile | BASSWOOD CAPITAL MANAGEMENT, L.L.C. |
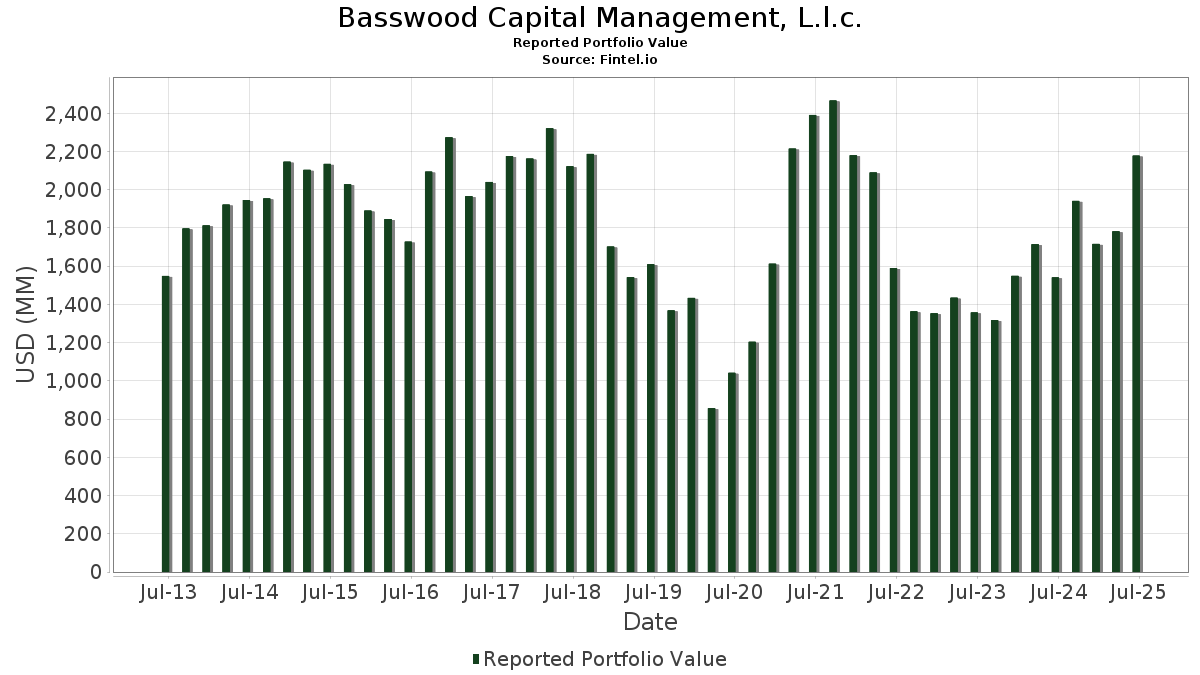
| Portfolio Value | $ 2,177,955,980 |
| Current Positions | 115 |
Latest Holdings, Performance, AUM (from 13F, 13D)
Basswood Capital Management, L.l.c. has disclosed 115 total holdings in their latest SEC filings. Most recent portfolio value is calculated to be $ 2,177,955,980 USD. Actual Assets Under Management (AUM) is this value plus cash (which is not disclosed). Basswood Capital Management, L.l.c.’s top holdings are JPMorgan Chase & Co. (US:JPM) , Bank of America Corporation (US:BAC) , iShares Trust - iShares 20+ Year Treasury Bond ETF (US:TLT) , Mr. Cooper Group Inc. (US:COOP) , and U.S. Bancorp (US:USB) . Basswood Capital Management, L.l.c.’s new positions include SPDR S&P MidCap 400 ETF Trust (US:MDY) , Community Financial System, Inc. (US:CBU) , Equitable Holdings, Inc. (US:EQH) , Jones Lang LaSalle Incorporated (US:JLL) , and P10, Inc. (US:PX) . Basswood Capital Management, L.l.c.’s top industries are "Petroleum Refining And Related Industries" (sic 29) , "Railroad Transportation" (sic 40) , and "Hotels, Rooming Houses, Camps, And Other Lodging Places" (sic 70) .
Top Increases This Quarter
We use the change in the portfolio allocation because this is the most meaningful metric. Changes can be due to trades or changes in share prices.
| Security | Shares (MM) |
Value (MM$) |
Portfolio % | ΔPortfolio % |
|---|---|---|---|---|
| 0.96 | 84.31 | 3.8708 | 3.8224 | |
| 0.82 | 48.42 | 2.2232 | 2.2025 | |
| 0.21 | 37.67 | 1.7298 | 1.6843 | |
| 1.06 | 24.93 | 1.1445 | 1.1445 | |
| 0.04 | 21.57 | 0.9905 | 0.9905 | |
| 0.50 | 21.46 | 0.9855 | 0.9855 | |
| 1.83 | 86.79 | 3.9849 | 0.9423 | |
| 0.58 | 46.14 | 2.1186 | 0.8534 | |
| 0.27 | 15.19 | 0.6972 | 0.6972 | |
| 0.23 | 49.51 | 2.2733 | 0.6701 |
Top Decreases This Quarter
We use the change in the portfolio allocation because this is the most meaningful metric. Changes can be due to trades or changes in share prices.
| Security | Shares (MM) |
Value (MM$) |
Portfolio % | ΔPortfolio % |
|---|---|---|---|---|
| 0.29 | 4.06 | 0.1866 | -1.0866 | |
| 0.27 | 9.05 | 0.4157 | -0.7828 | |
| 0.11 | 3.07 | 0.1409 | -0.7559 | |
| 0.42 | 7.39 | 0.3392 | -0.7523 | |
| 0.00 | 0.09 | 0.0043 | -0.7198 | |
| 2.06 | 55.45 | 2.5458 | -0.6743 | |
| 1.21 | 66.14 | 3.0370 | -0.6212 | |
| 0.21 | 11.82 | 0.5426 | -0.6021 | |
| 0.02 | 3.14 | 0.1441 | -0.6012 | |
| 0.23 | 8.49 | 0.3898 | -0.5721 |
13D/G Filings
This is a list of 13D and 13G filings made in the last year (if any). Click the link icon to see the full transaction history. Green rows indicate new positions. Red rows indicate closed positions.
| File Date | Form | Security | Prev Shares |
Current Shares |
ΔShares % | % Ownership |
% ΔOwnership | |
|---|---|---|---|---|---|---|---|---|
| 2025-02-12 | MCB / Metropolitan Bank Holding Corp. | 607,805 | 468,885 | -22.86 | 4.19 | -22.84 | ||
| 2024-11-14 | DCOM / Dime Community Bancshares, Inc. | 2,106,390 | 1,925,702 | -8.58 | 4.41 | -19.23 |
13F and Fund Filings
This form was filed on 2025-08-14 for the reporting period 2025-06-30. Click the link icon to see the full transaction history.
Upgrade to unlock premium data and export to Excel ![]() .
.
| Security | Type | Avg Share Price | Shares (MM) |
ΔShares (%) |
ΔShares (%) |
Value ($MM) |
Portfolio (%) |
ΔPortfolio (%) |
|
|---|---|---|---|---|---|---|---|---|---|
| JPM / JPMorgan Chase & Co. | 0.47 | 0.00 | 136.11 | 18.19 | 6.2495 | -0.2135 | |||
| BAC / Bank of America Corporation | 1.83 | 41.17 | 86.79 | 60.08 | 3.9849 | 0.9423 | |||
| TLT / iShares Trust - iShares 20+ Year Treasury Bond ETF | Call | 0.96 | 9,900.00 | 84.31 | 9,668.83 | 3.8708 | 3.8224 | ||
| COOP / Mr. Cooper Group Inc. | 0.54 | 15.15 | 80.43 | 43.66 | 3.6930 | 0.5511 | |||
| USB / U.S. Bancorp | 1.62 | 7.33 | 73.22 | 15.03 | 3.3618 | -0.2102 | |||
| WBS / Webster Financial Corporation | 1.21 | -4.20 | 66.14 | 1.47 | 3.0370 | -0.6212 | |||
| PFSI / PennyMac Financial Services, Inc. | 0.57 | 5.90 | 56.82 | 5.40 | 2.6087 | -0.4164 | |||
| DCOM / Dime Community Bancshares, Inc. | 2.06 | 0.00 | 55.45 | -3.37 | 2.5458 | -0.6743 | |||
| MS / Morgan Stanley | 0.37 | 0.00 | 52.01 | 20.73 | 2.3882 | -0.0295 | |||
| OMF / OneMain Holdings, Inc. | 0.91 | 3.64 | 51.72 | 20.86 | 2.3749 | -0.0268 | |||
| LEN / Lennar Corporation | 0.45 | 10.61 | 49.66 | 6.59 | 2.2802 | -0.3345 | |||
| COF / Capital One Financial Corporation | 0.23 | 46.05 | 49.51 | 73.31 | 2.2733 | 0.6701 | |||
| KRE / SPDR Series Trust - SPDR S&P Regional Banking ETF | Put | 0.82 | 12,435.36 | 48.42 | 13,021.95 | 2.2232 | 2.2025 | ||
| WFC / Wells Fargo & Company | 0.58 | 83.38 | 46.14 | 104.67 | 2.1186 | 0.8534 | |||
| FCNCA / First Citizens BancShares, Inc. | 0.02 | 0.00 | 45.65 | 5.52 | 2.0960 | -0.3318 | |||
| SCHW / The Charles Schwab Corporation | 0.47 | -10.59 | 42.94 | 4.22 | 1.9714 | -0.3406 | |||
| RSP / Invesco Exchange-Traded Fund Trust - Invesco S&P 500 Equal Weight ETF | Put | 0.21 | 4,325.70 | 37.67 | 4,545.38 | 1.7298 | 1.6843 | ||
| TOL / Toll Brothers, Inc. | 0.30 | 3.02 | 33.72 | 11.35 | 1.5483 | -0.1512 | |||
| TMHC / Taylor Morrison Home Corporation | 0.54 | 5.91 | 32.98 | 8.35 | 1.5144 | -0.1939 | |||
| FNB / F.N.B. Corporation | 2.12 | 22.30 | 30.97 | 32.57 | 1.4218 | 0.1110 | |||
| PNC / The PNC Financial Services Group, Inc. | 0.16 | 32.24 | 30.26 | 40.25 | 1.3892 | 0.1786 | |||
| RM / Regional Management Corp. | 1.02 | 0.44 | 29.92 | -2.56 | 1.3738 | -0.3494 | |||
| APO / Apollo Global Management, Inc. | 0.21 | 0.00 | 29.54 | 3.60 | 1.3565 | -0.2439 | |||
| CFG / Citizens Financial Group, Inc. | 0.63 | 3.24 | 28.03 | 12.77 | 1.2868 | -0.1079 | |||
| VCTR / Victory Capital Holdings, Inc. | 0.44 | 37.87 | 27.85 | 51.68 | 1.2787 | 0.2484 | |||
| SYF / Synchrony Financial | 0.39 | 1.35 | 26.16 | 27.78 | 1.2010 | 0.0522 | |||
| EVR / Evercore Inc. | 0.10 | 26.47 | 26.10 | 70.99 | 1.1982 | 0.3417 | |||
| ESQ / Esquire Financial Holdings, Inc. | 0.27 | 0.00 | 25.44 | 25.58 | 1.1680 | 0.0312 | |||
| RF / Regions Financial Corporation | 1.06 | 24.93 | 1.1445 | 1.1445 | |||||
| CPF / Central Pacific Financial Corp. | 0.89 | 11.03 | 24.83 | 15.10 | 1.1400 | -0.0705 | |||
| PWP / Perella Weinberg Partners | 1.26 | 58.95 | 24.53 | 67.77 | 1.1264 | 0.3058 | |||
| BOH / Bank of Hawaii Corporation | 0.34 | 32.67 | 22.93 | 29.91 | 1.0528 | 0.0623 | |||
| BANR / Banner Corporation | 0.35 | 29.87 | 22.56 | 30.64 | 1.0357 | 0.0668 | |||
| AMP / Ameriprise Financial, Inc. | 0.04 | 0.00 | 22.38 | 10.25 | 1.0275 | -0.1116 | |||
| SNV / Synovus Financial Corp. | 0.43 | 0.00 | 22.30 | 10.72 | 1.0237 | -0.1064 | |||
| MDY / SPDR S&P MidCap 400 ETF Trust | 0.04 | 21.57 | 0.9905 | 0.9905 | |||||
| TFC / Truist Financial Corporation | 0.50 | 21.46 | 0.9855 | 0.9855 | |||||
| ONB / Old National Bancorp | 0.98 | 46.80 | 21.00 | 47.84 | 0.9640 | 0.1670 | |||
| BLK / BlackRock, Inc. | 0.02 | 2.20 | 20.45 | 13.30 | 0.9388 | -0.0739 | |||
| INDB / Independent Bank Corp. | 0.32 | 126.55 | 19.95 | 127.41 | 0.9162 | 0.4237 | |||
| FNF / Fidelity National Financial, Inc. | 0.33 | 0.00 | 18.73 | -13.86 | 0.8602 | -0.3603 | |||
| BFH / Bread Financial Holdings, Inc. | 0.31 | 73.55 | 17.65 | 97.96 | 0.8103 | 0.3100 | |||
| COLB / Columbia Banking System, Inc. | 0.73 | 4.68 | 17.10 | -1.87 | 0.7851 | -0.1928 | |||
| MHO / M/I Homes, Inc. | 0.15 | -1.88 | 16.96 | -3.65 | 0.7788 | -0.2091 | |||
| OBK / Origin Bancorp, Inc. | 0.47 | 7.79 | 16.86 | 11.12 | 0.7743 | -0.0774 | |||
| ALLY / Ally Financial Inc. | 0.43 | 22.08 | 16.71 | 30.38 | 0.7672 | 0.0480 | |||
| SSB / SouthState Corporation | 0.18 | 24.76 | 16.64 | 23.71 | 0.7641 | 0.0091 | |||
| BPOP / Popular, Inc. | 0.15 | 0.00 | 16.57 | 19.32 | 0.7609 | -0.0186 | |||
| RJF / Raymond James Financial, Inc. | 0.10 | 0.00 | 15.70 | 10.42 | 0.7209 | -0.0771 | |||
| VOYA / Voya Financial, Inc. | 0.22 | 4.74 | 15.62 | 9.75 | 0.7173 | -0.0815 | |||
| MCB / Metropolitan Bank Holding Corp. | 0.22 | 0.00 | 15.50 | 25.03 | 0.7118 | 0.0159 | |||
| CBU / Community Financial System, Inc. | 0.27 | 15.19 | 0.6972 | 0.6972 | |||||
| CRBG / Corebridge Financial, Inc. | 0.42 | 113.98 | 14.92 | 140.64 | 0.6848 | 0.3370 | |||
| PHM / PulteGroup, Inc. | 0.14 | 0.00 | 14.31 | 2.59 | 0.6572 | -0.1258 | |||
| EQH / Equitable Holdings, Inc. | 0.25 | 13.86 | 0.6365 | 0.6365 | |||||
| HWC / Hancock Whitney Corporation | 0.23 | 0.00 | 13.48 | 9.43 | 0.6189 | -0.0723 | |||
| UMBF / UMB Financial Corporation | 0.12 | 0.00 | 12.81 | 4.02 | 0.5880 | -0.1029 | |||
| CCS / Century Communities, Inc. | 0.21 | -30.98 | 11.82 | -42.07 | 0.5426 | -0.6021 | |||
| IVZ / Invesco Ltd. | 0.66 | -19.06 | 10.41 | -15.86 | 0.4781 | -0.2164 | |||
| WAL / Western Alliance Bancorporation | 0.13 | 0.00 | 10.38 | 1.51 | 0.4768 | -0.0974 | |||
| QNST / QuinStreet, Inc. | 0.63 | 4.03 | 10.18 | -6.11 | 0.4674 | -0.1411 | |||
| VLY / Valley National Bancorp | 1.13 | 0.00 | 10.10 | 0.45 | 0.4637 | -0.1005 | |||
| CAC / Camden National Corporation | 0.25 | 0.00 | 10.05 | 0.27 | 0.4615 | -0.1010 | |||
| BKU / BankUnited, Inc. | 0.27 | 0.00 | 9.69 | 3.34 | 0.4451 | -0.0813 | |||
| LAZ / Lazard, Inc. | 0.20 | 0.00 | 9.36 | 10.81 | 0.4297 | -0.0443 | |||
| MBIN / Merchants Bancorp | 0.27 | -52.57 | 9.05 | -57.61 | 0.4157 | -0.7828 | |||
| UBSI / United Bankshares, Inc. | 0.23 | -52.87 | 8.49 | -50.48 | 0.3898 | -0.5721 | |||
| TLT / iShares Trust - iShares 20+ Year Treasury Bond ETF | 0.10 | 0.00 | 8.49 | -3.05 | 0.3896 | -0.1016 | |||
| USCB / USCB Financial Holdings, Inc. | 0.47 | -8.31 | 7.80 | -18.30 | 0.3582 | -0.1776 | |||
| PFS / Provident Financial Services, Inc. | 0.42 | -62.80 | 7.39 | -62.02 | 0.3392 | -0.7523 | |||
| BHLB / Berkshire Hills Bancorp, Inc. | 0.27 | 0.00 | 6.80 | -4.02 | 0.3122 | -0.0854 | |||
| GHLD / Guild Holdings Company | 0.32 | -53.29 | 6.24 | -39.64 | 0.2865 | -0.2936 | |||
| AUB / Atlantic Union Bankshares Corporation | 0.19 | 5.96 | 0.2739 | 0.2739 | |||||
| TCBK / TriCo Bancshares | 0.14 | 0.00 | 5.59 | 1.29 | 0.2565 | -0.0530 | |||
| HFWA / Heritage Financial Corporation | 0.23 | 0.00 | 5.50 | -2.01 | 0.2526 | -0.0625 | |||
| KBH / KB Home | 0.10 | 0.00 | 5.47 | -8.85 | 0.2510 | -0.0856 | |||
| FBNC / First Bancorp | 0.12 | -56.85 | 5.43 | -52.61 | 0.2495 | -0.3939 | |||
| CMA / Comerica Incorporated | 0.09 | 0.00 | 5.37 | 1.00 | 0.2464 | -0.0518 | |||
| FLG / Flagstar Financial, Inc. | 0.50 | 0.00 | 5.29 | -8.79 | 0.2430 | -0.0826 | |||
| CWK / Cushman & Wakefield plc | 0.43 | -37.33 | 4.81 | -32.12 | 0.2207 | -0.1767 | |||
| HOMB / Home Bancshares, Inc. (Conway, AR) | 0.17 | 0.00 | 4.74 | 0.66 | 0.2176 | -0.0466 | |||
| JLL / Jones Lang LaSalle Incorporated | 0.02 | 4.36 | 0.2001 | 0.2001 | |||||
| MYFW / First Western Financial, Inc. | 0.18 | -6.81 | 4.13 | 6.97 | 0.1897 | -0.0270 | |||
| BANC / Banc of California, Inc. | 0.29 | -81.91 | 4.06 | -82.09 | 0.1866 | -1.0866 | |||
| RKT / Rocket Companies, Inc. | 0.28 | 36.98 | 3.92 | 60.97 | 0.1799 | 0.0433 | |||
| KKR / KKR & Co. Inc. | 0.03 | 0.00 | 3.85 | 15.08 | 0.1770 | -0.0110 | |||
| FITB / Fifth Third Bancorp | 0.09 | 0.00 | 3.85 | 4.93 | 0.1768 | -0.0291 | |||
| RY / Royal Bank of Canada | 0.03 | 0.00 | 3.74 | 17.04 | 0.1716 | -0.0076 | |||
| CHMG / Chemung Financial Corporation | 0.07 | -1.38 | 3.42 | 0.47 | 0.1568 | -0.0339 | |||
| PX / P10, Inc. | 0.31 | 3.22 | 0.1477 | 0.1477 | |||||
| AMG / Affiliated Managers Group, Inc. | 0.02 | -79.81 | 3.14 | -76.36 | 0.1441 | -0.6012 | |||
| MOFG / MidWestOne Financial Group, Inc. | 0.11 | -80.24 | 3.07 | -80.80 | 0.1409 | -0.7559 | |||
| CBZ / CBIZ, Inc. | 0.04 | 0.00 | 2.89 | -5.49 | 0.1329 | -0.0389 | |||
| NBN / Northeast Bank | 0.03 | 0.00 | 2.77 | -2.77 | 0.1271 | -0.0327 | |||
| BUSE / First Busey Corporation | 0.12 | 0.00 | 2.68 | 5.93 | 0.1231 | -0.0189 | |||
| MTB / M&T Bank Corporation | 0.01 | 0.00 | 2.59 | 8.50 | 0.1190 | -0.0150 | |||
| WRLD / World Acceptance Corporation | 0.01 | 1.89 | 0.0867 | 0.0867 | |||||
| WSBC / WesBanco, Inc. | 0.06 | 0.00 | 1.86 | 2.14 | 0.0855 | -0.0168 | |||
| NBHC / National Bank Holdings Corporation | 0.05 | 1.77 | 0.0811 | 0.0811 | |||||
| VRTS / Virtus Investment Partners, Inc. | 0.01 | 0.00 | 1.72 | 5.21 | 0.0788 | -0.0127 | |||
| PNFP / Pinnacle Financial Partners, Inc. | 0.02 | 1.71 | 0.0784 | 0.0784 | |||||
| C / Citigroup Inc. | 0.02 | 0.00 | 1.70 | 19.87 | 0.0779 | -0.0015 | |||
| BUR / Burford Capital Limited | 0.12 | 0.00 | 1.69 | 7.94 | 0.0774 | -0.0102 | |||
| LC / LendingClub Corporation | 0.13 | 0.00 | 1.60 | 16.57 | 0.0733 | -0.0036 | |||
| EWBC / East West Bancorp, Inc. | 0.02 | 0.00 | 1.54 | 12.50 | 0.0707 | -0.0061 | |||
| FBK / FB Financial Corporation | 0.03 | 1.50 | 0.0691 | 0.0691 | |||||
| ALRS / Alerus Financial Corporation | 0.06 | 0.00 | 1.30 | 17.18 | 0.0599 | -0.0026 | |||
| SBCF / Seacoast Banking Corporation of Florida | 0.02 | 0.59 | 0.0271 | 0.0271 | |||||
| PGR / The Progressive Corporation | 0.00 | 0.00 | 0.51 | -5.77 | 0.0233 | -0.0069 | |||
| EGBN / Eagle Bancorp, Inc. | 0.02 | 0.00 | 0.42 | -7.16 | 0.0191 | -0.0061 | |||
| NRDS / NerdWallet, Inc. | 0.02 | 0.00 | 0.20 | 21.34 | 0.0091 | -0.0001 | |||
| ALL / The Allstate Corporation | 0.00 | 0.00 | 0.19 | -3.08 | 0.0087 | -0.0022 | |||
| CLST / Catalyst Bancorp, Inc. | 0.01 | 0.00 | 0.14 | 6.11 | 0.0064 | -0.0010 | |||
| WSFS / WSFS Financial Corporation | 0.00 | -99.31 | 0.09 | -99.27 | 0.0043 | -0.7198 | |||
| KEY / KeyCorp | 0.00 | 0.00 | 0.00 | 0.00 | 0.0002 | -0.0000 | |||
| BFST / Business First Bancshares, Inc. | 0.00 | -100.00 | 0.00 | 0.0000 | |||||
| BMRC / Bank of Marin Bancorp | 0.00 | -100.00 | 0.00 | 0.0000 | |||||
| PB / Prosperity Bancshares, Inc. | 0.00 | -100.00 | 0.00 | 0.0000 | |||||
| PGC / Peapack-Gladstone Financial Corporation | 0.00 | -100.00 | 0.00 | 0.0000 | |||||
| SASR / Sandy Spring Bancorp, Inc. | 0.00 | -100.00 | 0.00 | 0.0000 | |||||
| BWB / Bridgewater Bancshares, Inc. | 0.00 | -100.00 | 0.00 | 0.0000 | |||||
| MDY / SPDR S&P MidCap 400 ETF Trust | Put | 0.00 | -100.00 | 0.00 | -100.00 | -0.0225 | |||
| FUNC / First United Corporation | 0.00 | -100.00 | 0.00 | 0.0000 | |||||
| FG / F&G Annuities & Life, Inc. | 0.00 | -100.00 | 0.00 | 0.0000 | |||||
| DFS / Discover Financial Services | 0.00 | -100.00 | 0.00 | 0.0000 | |||||
| VBTX / Veritex Holdings, Inc. | 0.00 | -100.00 | 0.00 | 0.0000 | |||||
| HONE / HarborOne Bancorp, Inc. | 0.00 | -100.00 | 0.00 | 0.0000 |