Basic Stats
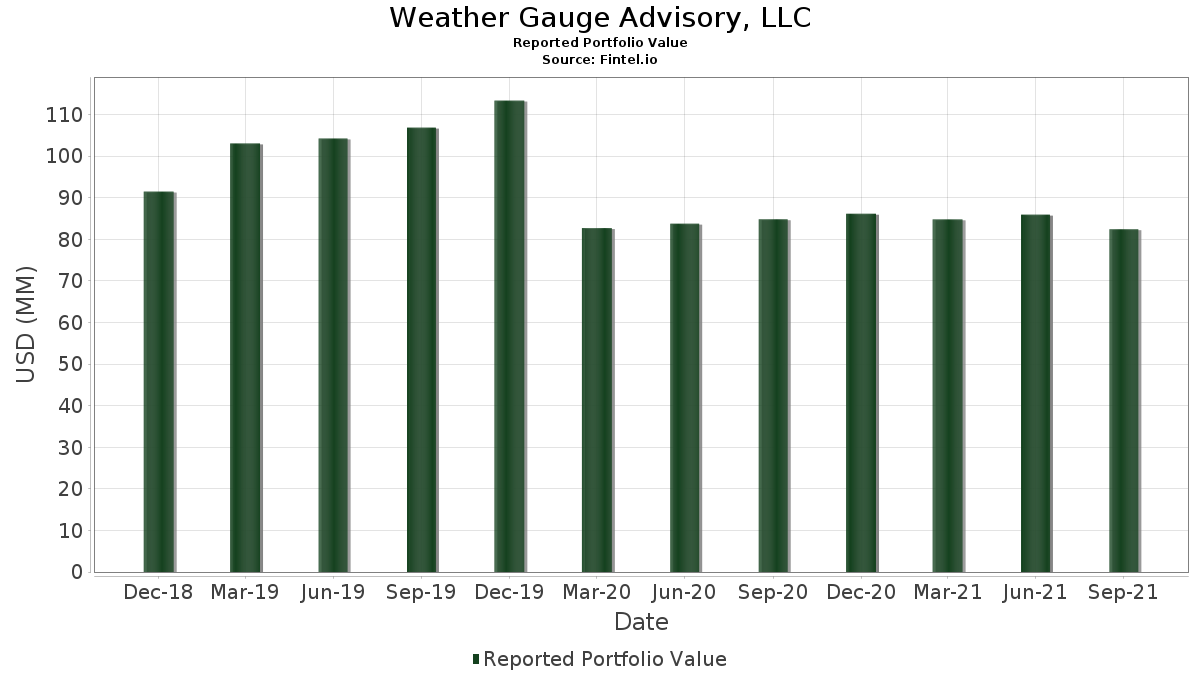
| Portfolio Value | $ 82,422,000 |
| Current Positions | 75 |
Latest Holdings, Performance, AUM (from 13F, 13D)
Weather Gauge Advisory, LLC has disclosed 75 total holdings in their latest SEC filings. Most recent portfolio value is calculated to be $ 82,422,000 USD. Actual Assets Under Management (AUM) is this value plus cash (which is not disclosed). Weather Gauge Advisory, LLC’s top holdings are Johnson & Johnson (US:JNJ) , Brookfield Finance Inc - 4.625% NT REDEEM 16/10/2080 USD 25 (US:BAMH) , Archer-Daniels-Midland Company (US:ADM) , Annaly Capital Management, Inc. (US:NLY) , and Growth Fund Of America - Growth Fund of America - Class F-3 (US:GAFFX) . Weather Gauge Advisory, LLC’s new positions include Barclays PLC - Depositary Receipt (Common Stock) (US:BCS) , American Airlines Group Inc. (US:AAL) , AvalonBay Communities, Inc. (US:AVB) , .
Top Increases This Quarter
We use the change in the portfolio allocation because this is the most meaningful metric. Changes can be due to trades or changes in share prices.
| Security | Shares (MM) |
Value (MM$) |
Portfolio % | ΔPortfolio % |
|---|---|---|---|---|
| 0.03 | 3.90 | 4.7330 | 4.3908 | |
| 0.08 | 4.08 | 4.9526 | 4.3102 | |
| 0.01 | 0.70 | 0.8493 | 0.8493 | |
| 0.01 | 0.38 | 0.4647 | 0.3693 | |
| 0.11 | 5.71 | 6.9338 | 0.2879 | |
| 0.06 | 3.34 | 4.0499 | 0.2574 | |
| 0.04 | 1.66 | 2.0104 | 0.2555 | |
| 0.03 | 1.54 | 1.8636 | 0.1843 | |
| 0.01 | 2.10 | 2.5418 | 0.1527 | |
| 0.01 | 0.11 | 0.1359 | 0.1359 |
Top Decreases This Quarter
We use the change in the portfolio allocation because this is the most meaningful metric. Changes can be due to trades or changes in share prices.
| Security | Shares (MM) |
Value (MM$) |
Portfolio % | ΔPortfolio % |
|---|---|---|---|---|
| 0.00 | 0.00 | -4.9714 | ||
| 0.01 | 0.53 | 0.6418 | -3.9490 | |
| 0.00 | 0.00 | -0.9321 | ||
| 0.00 | 0.00 | -0.4969 | ||
| 0.00 | 0.00 | -0.4329 | ||
| 0.00 | 0.00 | -0.2502 | ||
| 0.00 | 0.00 | -0.1664 | ||
| 0.03 | 2.26 | 2.7444 | -0.1393 | |
| 0.00 | 0.00 | -0.1385 | ||
| 0.02 | 1.01 | 1.2266 | -0.1151 |
13F and Fund Filings
This form was filed on 2021-10-22 for the reporting period 2021-09-30. Click the link icon to see the full transaction history.
Upgrade to unlock premium data and export to Excel ![]() .
.
| Security | Type | Avg Share Price | Shares (MM) |
ΔShares (%) |
ΔShares (%) |
Value ($MM) |
Portfolio (%) |
ΔPortfolio (%) |
|
|---|---|---|---|---|---|---|---|---|---|
| JNJ / Johnson & Johnson | 0.04 | -2.89 | 6.03 | -4.80 | 7.3184 | -0.0548 | |||
| BAMH / Brookfield Finance Inc - 4.625% NT REDEEM 16/10/2080 USD 25 | 0.11 | -4.67 | 5.71 | 0.07 | 6.9338 | 0.2879 | |||
| ADM / Archer-Daniels-Midland Company | 0.08 | 815.29 | 4.08 | 639.49 | 4.9526 | 4.3102 | |||
| NLY / Annaly Capital Management, Inc. | 0.03 | -16.73 | 3.90 | 1,226.87 | 4.7330 | 4.3908 | |||
| GAFFX / Growth Fund Of America - Growth Fund of America - Class F-3 | 0.06 | -3.07 | 3.34 | 2.42 | 4.0499 | 0.2574 | |||
| ABBV / AbbVie Inc. | 0.02 | -2.92 | 2.45 | -7.05 | 2.9737 | -0.0950 | |||
| PLD / Prologis, Inc. | 0.02 | -5.29 | 2.40 | -0.62 | 2.9143 | 0.1016 | |||
| MKC / McCormick & Company, Incorporated | 0.03 | -0.51 | 2.26 | -8.72 | 2.7444 | -0.1393 | |||
| PG / The Procter & Gamble Company | 0.01 | -1.49 | 2.10 | 2.05 | 2.5418 | 0.1527 | |||
| CVX / Chevron Corporation | 0.02 | -1.23 | 2.03 | -4.33 | 2.4678 | -0.0063 | |||
| RA / Brookfield Real Assets Income Fund Inc. | 0.09 | -0.05 | 1.96 | -4.57 | 2.3816 | -0.0121 | |||
| DCUE / Dominion Energy Inc - Units - 2019 Series A | 0.03 | -2.59 | 1.96 | -3.31 | 2.3756 | 0.0191 | |||
| PM / Philip Morris International Inc. | 0.02 | 0.05 | 1.79 | -4.32 | 2.1766 | -0.0054 | |||
| PSA.PRG / Public Storage - Preferred Stock | 0.01 | -0.61 | 1.69 | -1.80 | 2.0528 | 0.0478 | |||
| PFE / Pfizer Inc. | 0.04 | 0.03 | 1.66 | 9.88 | 2.0104 | 0.2555 | |||
| KMB / Kimberly-Clark Corporation | 0.01 | -3.96 | 1.56 | -4.98 | 1.8976 | -0.0179 | |||
| WEC / WEC Energy Group, Inc. | 0.02 | -1.98 | 1.55 | -2.81 | 1.8866 | 0.0247 | |||
| EXC / Exelon Corporation | 0.03 | -2.47 | 1.54 | 6.44 | 1.8636 | 0.1843 | |||
| PPL / PPL Corporation | 0.05 | -3.40 | 1.52 | -3.74 | 1.8442 | 0.0067 | |||
| OKE / ONEOK, Inc. | 0.02 | -4.40 | 1.42 | -0.35 | 1.7228 | 0.0646 | |||
| TTE / TotalEnergies SE - Depositary Receipt (Common Stock) | 0.03 | -3.67 | 1.35 | 2.04 | 1.6403 | 0.0984 | |||
| JPM / JPMorgan Chase & Co. | 0.01 | -6.21 | 1.22 | -1.30 | 1.4790 | 0.0418 | |||
| LLY / Eli Lilly and Company | 0.00 | -2.12 | 1.12 | -1.41 | 1.3589 | 0.0369 | |||
| TOWN / TowneBank | 0.03 | -0.55 | 1.07 | 1.71 | 1.2958 | 0.0739 | |||
| MFC / HEXAOM | 0.05 | -3.13 | 1.03 | -5.41 | 1.2521 | -0.0175 | |||
| MDLZ / Mondelez International, Inc. | 0.02 | -5.85 | 1.01 | -12.32 | 1.2266 | -0.1151 | |||
| PCH / PotlatchDeltic Corporation | 0.02 | 0.09 | 1.00 | -2.92 | 1.2096 | 0.0145 | |||
| O / Realty Income Corporation | 0.02 | -2.93 | 0.99 | -5.73 | 1.1987 | -0.0209 | |||
| CSWI / CSW Industrials, Inc. | 0.01 | -7.10 | 0.94 | 0.21 | 1.1417 | 0.0490 | |||
| MRK / Merck & Co., Inc. | 0.01 | 0.00 | 0.92 | -3.38 | 1.1101 | 0.0081 | |||
| VOD / Vodafone Group Public Limited Company - Depositary Receipt (Common Stock) | 0.06 | -2.96 | 0.85 | -12.49 | 1.0373 | -0.0996 | |||
| ED / Consolidated Edison, Inc. | 0.01 | -1.55 | 0.83 | -0.36 | 1.0058 | 0.0376 | |||
| BRK.B / Berkshire Hathaway Inc. | 0.00 | -3.23 | 0.82 | -4.99 | 0.9937 | -0.0095 | |||
| MET / MetLife, Inc. | 0.01 | -2.26 | 0.81 | 0.74 | 0.9888 | 0.0474 | |||
| DUK / Duke Energy Corporation | 0.01 | 0.09 | 0.80 | -1.11 | 0.9743 | 0.0293 | |||
| WELL / Welltower Inc. | 0.01 | 0.09 | 0.77 | -0.77 | 0.9366 | 0.0313 | |||
| NSC / Norfolk Southern Corporation | 0.00 | 0.00 | 0.75 | -9.86 | 0.9100 | -0.0583 | |||
| VZ / Verizon Communications Inc. | 0.01 | -1.40 | 0.74 | -4.99 | 0.9015 | -0.0086 | |||
| INTC / Intel Corporation | 0.01 | 0.48 | 0.72 | -4.62 | 0.8760 | -0.0049 | |||
| CM / Canadian Imperial Bank of Commerce | 0.01 | -4.33 | 0.71 | -6.42 | 0.8663 | -0.0216 | |||
| BCS / Barclays PLC - Depositary Receipt (Common Stock) | 0.01 | 0.70 | 0.8493 | 0.8493 | |||||
| ISRG / Intuitive Surgical, Inc. | 0.00 | 0.00 | 0.68 | 8.07 | 0.8287 | 0.0932 | |||
| YUM / Yum! Brands, Inc. | 0.00 | -1.06 | 0.60 | 5.03 | 0.7340 | 0.0637 | |||
| JGH / Nuveen Global High Income Fund | 0.04 | -7.80 | 0.58 | -8.62 | 0.7073 | -0.0351 | |||
| KO / The Coca-Cola Company | 0.01 | 0.04 | 0.55 | -2.99 | 0.6685 | 0.0075 | |||
| NVS / Novartis AG - Depositary Receipt (Common Stock) | 0.01 | 0.00 | 0.54 | -10.43 | 0.6564 | -0.0465 | |||
| USB / U.S. Bancorp | 0.01 | -6.86 | 0.53 | -2.75 | 0.6430 | 0.0088 | |||
| AAPL / Apple Inc. | 0.01 | -69.39 | 0.53 | -86.59 | 0.6418 | -3.9490 | |||
| GNL / Global Net Lease, Inc. | 0.03 | -6.41 | 0.50 | -19.00 | 0.6103 | -0.1124 | |||
| ZTS / Zoetis Inc. | 0.00 | -0.60 | 0.48 | 3.64 | 0.5872 | 0.0438 | |||
| PEP / PepsiCo, Inc. | 0.00 | -5.06 | 0.48 | -3.59 | 0.5860 | 0.0030 | |||
| BTI / British American Tobacco p.l.c. - Depositary Receipt (Common Stock) | 0.01 | 0.00 | 0.48 | -10.11 | 0.5824 | -0.0391 | |||
| ETW / Eaton Vance Tax-Managed Global Buy-Write Opportunities Fund | 0.04 | -0.04 | 0.48 | -0.83 | 0.5775 | 0.0189 | |||
| GSK / GSK plc - Depositary Receipt (Common Stock) | 0.01 | -1.99 | 0.46 | -6.07 | 0.5630 | -0.0119 | |||
| TD / The Toronto-Dominion Bank | 0.01 | 0.00 | 0.44 | -5.59 | 0.5326 | -0.0085 | |||
| PNC / The PNC Financial Services Group, Inc. | 0.00 | 0.23 | 0.43 | 2.88 | 0.5205 | 0.0352 | |||
| SAN / Banco Santander, S.A. - Depositary Receipt (Common Stock) | 0.01 | -56.71 | 0.38 | 367.07 | 0.4647 | 0.3693 | |||
| QQQX / Nuveen Nasdaq 100 Dynamic Overwrite Fund | 0.01 | 0.00 | 0.35 | -3.32 | 0.4234 | 0.0033 | |||
| COF / Capital One Financial Corporation | 0.00 | 0.00 | 0.34 | 4.63 | 0.4113 | 0.0343 | |||
| MCD / McDonald's Corporation | 0.00 | -8.12 | 0.29 | -4.30 | 0.3506 | -0.0008 | |||
| BP / BP p.l.c. - Depositary Receipt (Common Stock) | 0.01 | -5.12 | 0.28 | -1.76 | 0.3385 | 0.0080 | |||
| WMT / Walmart Inc. | 0.00 | -11.32 | 0.28 | -12.38 | 0.3349 | -0.0317 | |||
| YUMC / Yum China Holdings, Inc. | 0.00 | -2.13 | 0.27 | -13.96 | 0.3215 | -0.0369 | |||
| COP / ConocoPhillips | 0.00 | 0.05 | 0.26 | 11.39 | 0.3203 | 0.0445 | |||
| TFX / Teleflex Incorporated | 0.00 | -7.96 | 0.24 | -14.03 | 0.2900 | -0.0335 | |||
| ETR / Entergy Corporation | 0.00 | -5.54 | 0.23 | -6.07 | 0.2815 | -0.0060 | |||
| MO / Altria Group, Inc. | 0.01 | 0.04 | 0.23 | -4.53 | 0.2815 | -0.0013 | |||
| XOM / Exxon Mobil Corporation | 0.00 | -2.70 | 0.23 | -9.06 | 0.2803 | -0.0153 | |||
| CSWC / Capital Southwest Corporation | 0.01 | -5.40 | 0.23 | 2.71 | 0.2754 | 0.0182 | |||
| ERF / Enerplus Corporation | 0.03 | -10.55 | 0.20 | -0.49 | 0.2463 | 0.0089 | |||
| RNP / Cohen & Steers REIT and Preferred Income Fund, Inc. | 0.01 | 0.13 | 0.20 | -5.66 | 0.2427 | -0.0041 | |||
| GGN / GAMCO Global Gold, Natural Resources & Income Trust | 0.04 | -0.80 | 0.16 | -7.51 | 0.1941 | -0.0072 | |||
| MTG / MGIC Investment Corporation | 0.01 | -8.84 | 0.15 | 0.00 | 0.1844 | 0.0075 | |||
| AAL / American Airlines Group Inc. | 0.01 | 0.11 | 0.1359 | 0.1359 | |||||
| AVB / AvalonBay Communities, Inc. | 0.02 | 0.07 | 0.0898 | 0.0898 | |||||
| BAC.PRB / Bank of America Corporation - Preferred Stock | 0.00 | -100.00 | 0.00 | -100.00 | -0.4329 | ||||
| APAM / Artisan Partners Asset Management Inc. | 0.00 | -100.00 | 0.00 | -100.00 | -4.9714 | ||||
| T / AT&T Inc. | 0.00 | -100.00 | 0.00 | -100.00 | -0.4969 | ||||
| KHC / The Kraft Heinz Company | 0.00 | -100.00 | 0.00 | -100.00 | -0.2502 | ||||
| GE / General Electric Company | 0.00 | -100.00 | 0.00 | -100.00 | -0.1664 | ||||
| AFIN / American Fin Tr Inc - Class A | 0.00 | -100.00 | 0.00 | -100.00 | -0.1385 | ||||
| BBWI / Bath & Body Works, Inc. | 0.00 | -100.00 | 0.00 | -100.00 | -0.9321 |